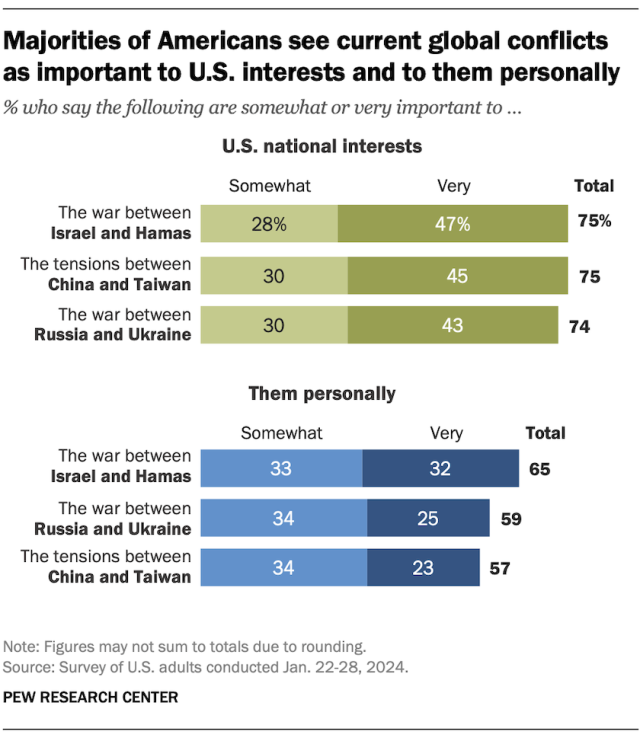
Two years on from Russia’s invasion of Ukraine, 74% of Americans view the war there as important to U.S. national interests – with 43% describing it as very important.
Similar
shares see the war between Israel and Hamas (75%) and tensions between
China and Taiwan (75%) as important to U.S. national interests,
according to a Pew Research Center survey conducted Jan. 22-28.
Pew
Research Center conducted this analysis to understand Americans’ views
of three ongoing global conflicts: the war between Russia and Ukraine,
the war between Israel and Hamas and tensions between China and Taiwan.
We first asked respondents to rate how important each conflict is to
them personally. We then asked them to rate how important each conflict
is to U.S. national interests.
For this analysis, we surveyed
5,146 U.S. adults from Jan. 22 to 28, 2024. Everyone who took part in
this survey is a member of the Center’s American Trends Panel (ATP), an
online survey panel that is recruited through national, random sampling
of residential addresses. This way, nearly all U.S. adults have a chance
of selection. The survey is weighted to be representative of the U.S.
adult population by gender, race, ethnicity, partisan affiliation,
education and other categories. Read more about the ATP’s methodology.
When
asked how important each conflict is to them personally, 59% of
Americans say the war between Russia and Ukraine is important to them.
This
is similar to the share who say tensions between China and Taiwan (57%)
are important to them personally. But it is lower than the share who
see the Israel-Hamas war as personally important (65%).
Roughly a
third of Americans describe the Israel-Hamas war as very important to
them personally, compared with around a quarter for the other two
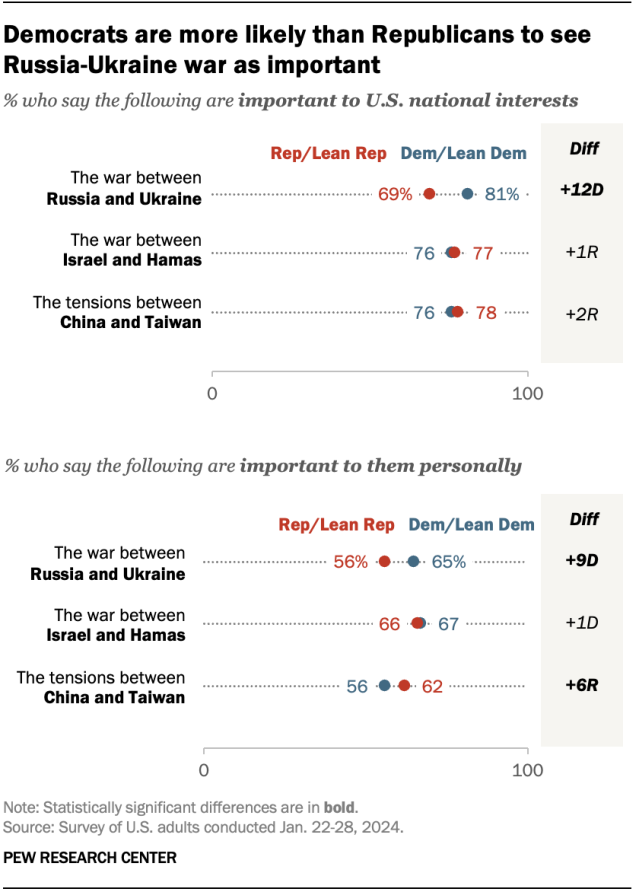
conflicts we asked about. Differences by party
Democrats
and Democratic-leaning independents are more likely than Republicans
and Republican leaners to see the Russia-Ukraine war as important to
U.S. national interests (81% vs. 69%).
However,
Democrats and Republicans are about equally likely to see the
Israel-Hamas war (76% vs. 77%) and China-Taiwan tensions (76% vs. 78%)
as important to U.S. interests.
Americans at the ideological
poles – that is, conservative Republicans and liberal Democrats – are
more likely than their more moderate counterparts in each party to view
both the Israel-Hamas war and China-Taiwan tensions as important to U.S.
interests.
When it comes to the importance of each conflict to
them personally, Democrats are more likely than Republicans to say the
Russia-Ukraine war is important to them (65% vs. 56%), while Republicans
are more likely than Democrats to say this about China-Taiwan tensions
(62% vs. 56%). Roughly equal shares of Democrats (67%) and Republicans
(66%) say the Israel-Hamas war is personally important to them.
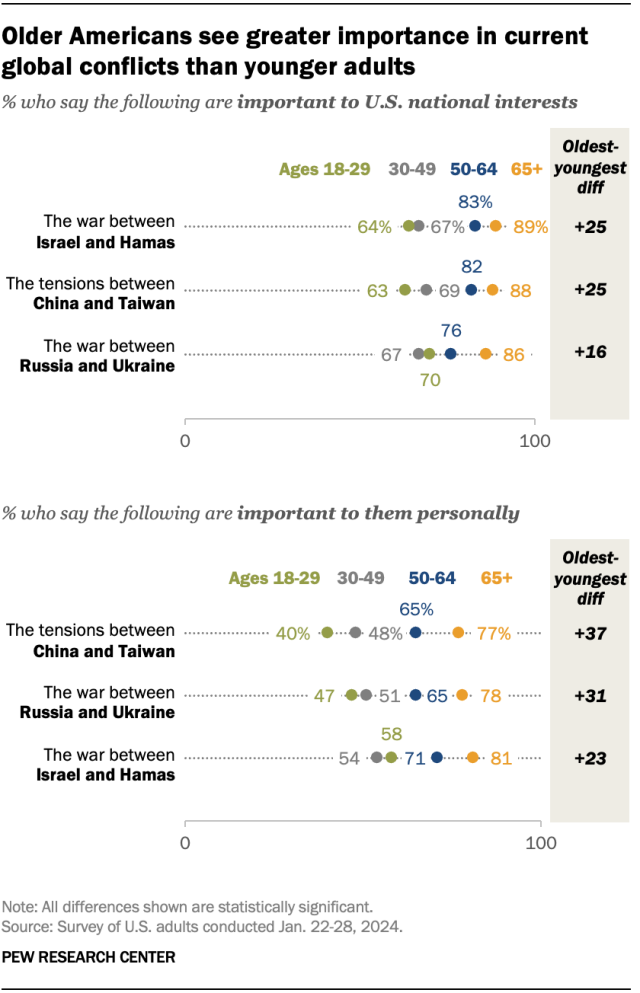
For
all three conflicts we asked about, the oldest Americans are more
likely than younger Americans to perceive them as important to both U.S.
national interests and to them personally.
However, even among
U.S. adults under 30, a majority (58%) see the Israel-Hamas war as
personally important. This is not the case for the Russia-Ukraine war or
for the ongoing tensions between China and Taiwan.
As a shop that studies human behavior through surveys and other
social scientific techniques, we have a good line of sight into the
contradictory nature of human preferences. Today, we’re calling out one
of those that affects us as pollsters: categorizing our survey
participants in ways that enhance our understanding of how people think
and behave.
Here’s the tension: On the one hand, many humans really like to group other humans
into categories. Think, “Women are more likely to vote Democratic and
men to vote Republican.” It helps us get a handle on big, messy trends
in societal thought. To get this info, surveys need to ask each
respondent how they would describe themselves.
On the other hand, most of us as individuals don’t like being put into these categories. “I’m more than my gender! And I’m not really a
Republican, though I do always vote for them.” On top of that, many
don’t like being asked nosy questions about sensitive topics. A list of
the common demographic questions at the end of a survey can basically
serve as a list of things not to raise at Thanksgiving dinner.
But our readers want to see themselves in our reports, and they want
to know what people who are like them – and unlike them – think. To do
that, it’s helpful for us to categorize people.
Which traits do we ask about, and why?
Unlike most Pew Research Center reports, where the emphasis is on
original research and the presentation of findings, our goal here is to
explain how we do this – that is, how we measure some of the
most important core characteristics of the public, which we then use to
describe Americans and talk about their opinions and behaviors.
To do so, we first chose what we judged to be the most important
personal characteristics and identities for comparing people who take
part in our surveys. Then, for each trait, we looked at a range of
aspects: why and how it came to be important to survey research; how its measurement has evolved over time; what challenges exist to the accurate measurement of each; and what controversies, if any, remain over its measurement.
These considerations and more shapehow we at Pew Research Center measure several important personal characteristics and identities in our surveys of the U.S. public. Here are some things to know about key demographic questions we ask:
Our main religion question asks
respondents to choose from 11 groups that encompass 97% of the U.S.
public: eight religious groups and three categories of people who don’t
affiliate with a religion. Other, less common faiths are measured by
respondents writing in their answer. Our questions have evolved in
response to a rise in the share of Americans who do not identify with any religion and to the growing diversity in the country’s population. (Chapter 1)
Measuring income is challenging
because it is both sensitive and sometimes difficult for respondents to
estimate. We ask for a person’s “total family income” the previous
calendar year from all sources before taxes, in part because that may
correspond roughly to what a family computed for filing income taxes. To
reduce the burden, we present ranges (e.g., “$30,000 to less than
$40,000”) rather than asking for a specific number. (Chapter 2)
We ask about political party affiliation
using a two-part question. People who initially identify as an
independent or “something else” (instead of as a Republican or Democrat)
and those who refuse to answer receive a follow-up question asking
whether they lean more to the Republican Party or the Democratic Party.
In many of their attitudes and behaviors, those who only lean to a party
greatly resemble those who identify with it. (Chapter 3)
Our gender question tries to use
terminology that is easily understood. It asks, “Do you describe
yourself as a man, a woman or in some other way?” Amid national
conversation on the subjects, gender and sexual orientation are topics
on the cutting edge of survey measurement. (Chapter 4)
In part because we use U.S. Census Bureau estimates to statistically adjust our data, we ask about race and Hispanic ethnicity
separately, just as the census does. People can select all races that
apply to them. In the future, the census may combine race and ethnicity
into one question. (Chapter 5)
A person’s age tells us both where
they fall in the life span, indicating what social roles and
responsibilities they may have, and what era or generation they belong
to, which may tell us what events in history had an effect on their
political or social thinking. We typically ask people to report just the
year of their birth, which is less intrusive than their exact date of
birth. (Chapter 6)
Each of these presents interesting challenges and choices. While
there are widely accepted best practices for some, polling professionals
disagree about how most effectively to measure many characteristics and
identities. Complicating the effort is that some people rebel against
the very idea of being categorized and think the effort to measure some
of these dimensions is divisive.
It’s important that our surveys accurately represent the public
In addition to being able to describe opinions using characteristics
like race, sex and education, it’s important to measure these traits for
another reason: We can use them to make sure our samples are
representative of the population. That’s because most of them are also
measured in large, high-quality U.S. Census Bureau surveys that produce
trustworthy national statistics. We can make sure that the makeup of our
samples – what share are high school graduates, or are ages 65 or
older, or identify as Hispanic, and so on – match benchmarks established by the Census Bureau. To do this, we use a tool called weighting to adjust our samples mathematically.
Some of the characteristics we’ll talk about are not measured by the
government: notably, religion and party affiliation. We’ve developed an
alternative way of coming up with trustworthy estimates for those
characteristics – our National Public Opinion Reference Survey, which we conduct annually for use in weighting our samples.
You are who you say you are – usually
We mostly follow the rule that “you are who you say you are,” meaning
we place people into whichever categories they say they are in. But
that was not always true in survey research for some kinds of
characteristics. Through 1950, enumerators for the U.S. census typically
coded a person’s race by observation,
not by asking. And pollsters using telephone surveys used respondents’
voices and other cues in the interview to identify their gender, rather
than by asking them.
Nowadays, we typically ask. We still make judgments that sometimes
end up placing a person in a different category than the one in which
they originally placed themselves. For example, when we group people by
religion, we use some categories that are not familiar to everyone, such
as “mainline Protestant” for a set of denominations that includes the
Episcopal Church, the United Methodist Church, the Presbyterian Church
(U.S.A.) and others.
And we sometimes use respondents’ answers to categorize them in ways
that go beyond what a single question can capture – such as when we use a
combination of family income, household size and geographic location to
classify people as living in an upper-, middle- or lower-income household.
Nosy but necessary questions
As much as people enjoy hearing about people like themselves, some
find these types of personal questions intrusive or rude. The advice
columnist Judith Martin, writing under the name Miss Manners, once provided a list of topics
that “polite people do not bring into social conversation.” It included
“sex, religion, politics, money, illness” and many, many more.
Obviously, pollsters have to ask about many of these if we are to
describe the views of different kinds of people (at Pew Research Center,
we at least occasionally ask about all of these). But as a profession,
we have an obligation to do so in a respectful and transparent manner
and to carefully protect the confidentiality of the responses we
receive.
If you’ve participated in a survey, it’s likely that the demographic
questions came at the end. Partly out of concern that people might quit
the survey prematurely in reaction to the questions, pollsters typically
place these questions last because they are sensitive for some people
and boring for most. Like other organizations that use survey panels –
collections of people who have agreed to take surveys on a regular basis
and are compensated for their participation – we benefit from a high
level of trust that builds up over months or years of frequent surveys.
This is reflected in the fact that we have fewer people refusing to
answer our question about family income (about 5%) than is typical for
surveys that ask about that sensitive topic. Historically, in the
individual telephone surveys we conducted before we created the online American Trends Panel, 10% or more of respondents refused to disclose their family income.
One other nice benefit of a survey panel, as opposed to one-off
surveys (which interview a sample of people just one time) is that we
don’t have to subject people to demographic questions as frequently. In a
one-off survey, we have to ask about any and all personal
characteristics we need for the analysis. Those take up precious
questionnaire space and potentially annoy respondents. In our panel, we
ask most of these questions just once per year, since we are
interviewing the same people regularly and most of these characteristics
do not change very much.
Speaking of questions that Miss Manners might avoid, let’s jump into
the deep end: measuring religion. (Or choose your own adventure by
clicking on the menu.)
Americans More Upbeat on the Economy; Biden’s Job Rating Remains Very Low In their own words: How people feel about the economy Americans’
views of the nation’s economy – while mostly stagnant for the past few
years – are showing signs of improvement. Slightly more than a quarter
(28%) rate economic conditions as excellent or good, a 9 percentage
point increase from last April.
Virtually
all the change since then has come among Democrats and
Democratic-leaning independents. Currently, 44% of Democrats have
positive views of the economy – the highest share of Joe Biden’s
presidency.
The new survey by Pew Research Center, conducted
Jan. 16-21 among 5,140 adults, finds that Biden’s own job rating remains
highly negative: Just 33% of Americans approve of his job performance,
unchanged from last month. The economy, past and future; top concerns
Despite
the improvement in economic attitudes, the public is far less upbeat
today than it was from 2018 through early 2020, during Donald Trump’s
presidency and prior to the outbreak of the coronavirus pandemic.
Economic
ratings remain far less positive than before the pandemic. In January
2020, 57% of Americans rated economic conditions as excellent or good; positive ratings fell to 23% in April of that year,
as the coronavirus outbreak spread across the country. Views of the
economy improved early during Biden’s first few months in office but
declined subsequently.
The public’s future economic outlook
turns less negative. The share of Americans saying economic conditions
will be worse a year from now has fallen from 46% last April to 33%
today.
However, more continue to say that conditions will be
worse than better (26%) next year; 41% expect the economy will be about
the same as it is today.
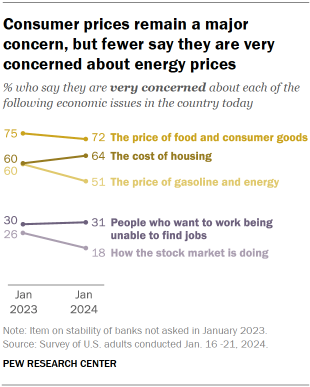
There’s less concern about energy
prices and the stock market. A sizable majority of Americans (72%) say
they are very concerned about prices for food and consumer goods, little
changed from last year. The cost of housing also is a major issue, with
64% very concerned.
However, the shares expressing a great deal
of concern about prices of gasoline and energy and how the stock market
is doing have declined 9 points and 8 points, respectively, since last
January. In their own words: Americans on the economy
When
the majority of Americans who rate economic conditions poor or only
fair are asked why they feel this way, most point to inflation or high
prices. Nearly half (45%) specifically mention high inflation (28%) or
the high cost of living (21%); 11% specifically point to the high cost
of food and groceries or the cost of housing.
People who view
the economy positively – those who rate conditions as excellent or good –
most often say low unemployment is a major reason why they feel the way
they do (43% say this). Other factors cited are that inflation has come
down (18%), wage growth (10%), or the strong performance of the stock
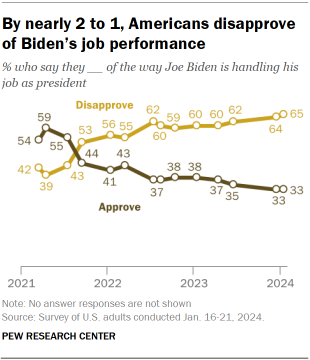
market (9%). Biden’s job performance, personal traits
Currently,
33% of Americans approve of Joe Biden’s job performance, while 65%
disapprove. Biden’s job rating has not been above 40% since April 2022.
Young
adults are negative about Biden’s job performance. Biden’s job rating
is low across all age groups, including young adults. Just 27% of adults
ages 18 to 29 approve of the way Biden is handling his job as
president, while 71% disapprove.
Black adults are divided over
Biden. About as many Black adults disapprove (49%) as approve (48%) of
Biden’s job performance. Biden’s job rating is lower among Asian (39%),
Hispanic (32%) and White (30%) adults.
Views of Biden’s personal
traits have grown less positive. Biden gets his most positive ratings
for being even-tempered (62% say this phrase describes him very or
fairly well) and standing up for what he believes in (50%).
Far
fewer Americans describe him as mentally sharp (29%), inspiring (26%) or
energetic (24%). For the most part, perceptions of Biden’s personal
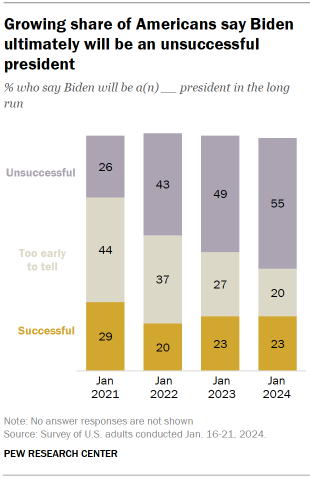
traits have followed the same downward trajectory as his job ratings. Judgments on Biden’s legacy
The
share of Americans saying that Biden will be an unsuccessful president
in the long run has increased steadily over the course of his
administration.
Currently, 55% say he will be an unsuccessful
president while just 23% say he will be successful; 20% say it is too
early to tell. These opinions, like other views of Biden, are deeply
partisan: Republicans overwhelmingly say Biden will be unsuccessful
(87%).
Among Democrats, 45% say he will be successful, 26% say unsuccessful, and 28% say it is too early to tell. Other findings on partisan compromise and the House GOP impeachment inquiry
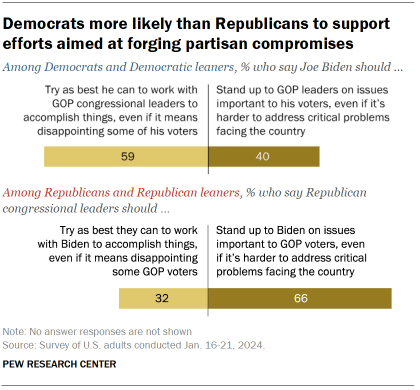
A
majority of Democrats (59%) say Biden should try his best to work with
GOP leaders to accomplish things, even if that disappoints some of his
voters; only 32% of Republicans say the same of GOP leaders trying to
reach compromises with Biden. These opinions have changed little over
the course of Biden’s presidency.
During the Trump administration,
Democrats were less likely to say their party’s leaders should seek
compromise with Trump than Republicans were to say their party should
try to seek political compromise with Democratic leaders.
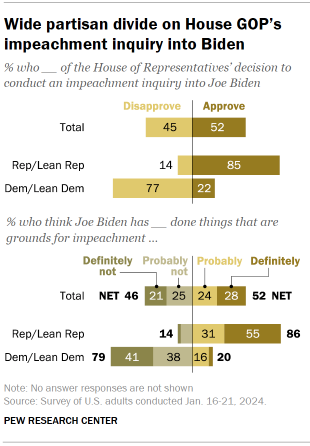
About
half of Americans (52%) approve of House Republicans’ decision to
conduct an impeachment inquiry into Joe Biden, while 45% disapprove.
These opinions – and views about whether Biden has done anything that is
grounds for his impeachment – are deeply divided along partisan lines:
85% of Republicans approve of the inquiry, while 77% of Democrats
disapprove.
Relatively few Americans (16%) say they are
following news about the impeachment inquiry launched by House
Republicans into Biden’s conduct and possible connections to his son
Hunter’s business dealings extremely or very closely.
Views of the nation’s economy
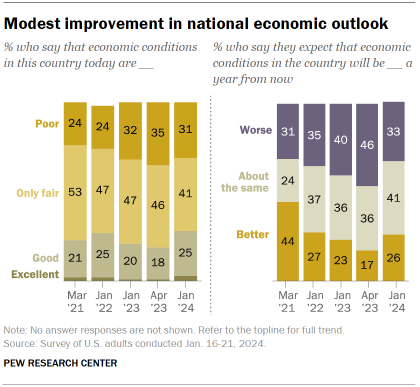
About
three-in-ten Americans (28%) currently rate national economic
conditions as excellent or good, while a similar share (31%) say they
are poor and about four-in-ten (41%) view them as “only fair.”
While ratings remain substantially lower than they were prior to the start of the COVID-19 pandemic, they are more positive than they were last spring – when just 19% viewed the economy in positive terms.
Expectations
for future economic conditions are also more positive than they were
last spring: Today, roughly a quarter say that they expect economic
conditions will be better a year from now (26%) – up from 17% in April
2023.
At the same time, the share who says conditions will be
worse has declined by 13 percentage points. About four-in-ten say they
expect conditions will be about the same.
As has long been the case,
partisans who share the party of the president have more positive views
of economic conditions than those who support the opposing party.
Today, 44% of Democrats and Democratic leaners say the nation’s economy
is excellent or good. This compares with 13% of Republicans and GOP
leaners.
Similarly, Democrats are more likely than Republicans
to say they expect economic conditions a year from now will be better
than they are today: 34% of Democrats say this, compared with 20% of
Republicans.
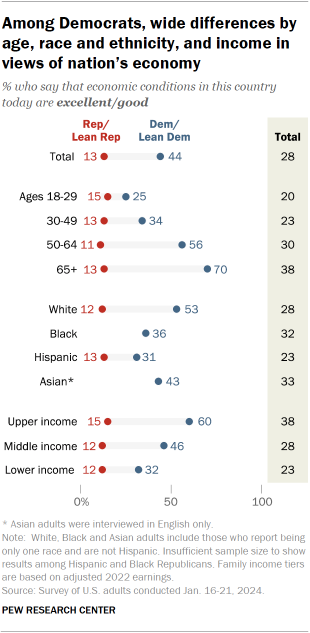
There are substantial differences among Democrats in views of the nation’s economy – particularly by age and income.
Younger
Democrats are much less likely than older Democrats to view current
economic conditions in positive terms. Among Democrats under 30, a
quarter view the economy positively. This share rises to 34% among those
ages 30 to 49, 56% among those 50 to 64, and 70% among those 65 and
older.
There are also significant differences by race and
ethnicity. White Democrats are more likely than Black, Hispanic and
Asian Democrats to say the economy is excellent or good.
Democrats
in different income groups also diverge in their evaluations of the
nation’s economy. Democrats with higher household incomes are more
positive about economic conditions than Democrats with lower incomes. A
clear majority of upper-income Democrats (60%) say the economy is doing
excellent or good. By comparison, 32% of those with lower incomes view
the economy positively, while a majority say it is only fair (40%) or
poor (28%).
Across Republican groups, economic assessments vary
less drastically. Republicans overwhelmingly rate the economy
negatively: Just 15% or less across demographic groups say national
economic conditions are good or excellent.
However, there are
some differences in how negative GOP assessments are. For instance,
upper-income Republicans are more likely to say the economy is doing
only fair (48%) rather than poorly (36%), while lower-income Republicans
are more likely to say poor (49%) rather than only fair (38%). Why do Americans rate the nation’s economy as they do?
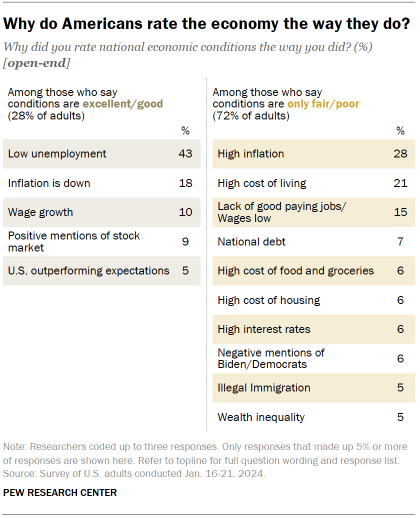
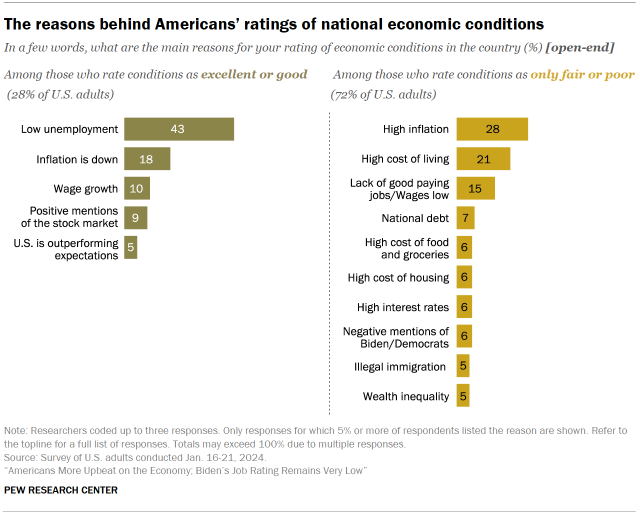
In
an open-ended question which asked Americans to explain the reasons for
their overall evaluation of the nation’s economy (as excellent, good,
only fair, or poor), people provide wide-ranging answers.
Among
the 28% of Americans who say the nation’s economy is doing excellent or
good, many offer overwhelmingly positive reasons for why they rate the
economy this way. A large share (43%) note the country’s low
unemployment, while 18% say that inflation is coming down or is lower
than it has been in recent months. Roughly one-in-ten mention wage
growth, while a similar share (9%) say strong stock market performance
contributes to their rating. And 5% say the reason for their rating is
that the U.S. is outperforming expectations or otherwise doing better
than other countries in terms of economic growth.
Among the 72%
of adults who say the economy is doing only fair or poor, most offer
negative reasons for why they rate the economy the way they do. Those
who say the economy is only fair are slightly more likely to offer a mix
of positive and negative responses than those who say the economy is
poor. However, respondents in both groups offer similar reasons for
their ratings.
Among those who say the nation’s economy is only
fair or poor, high inflation or high costs of various goods are
frequently mentioned: 28% say high inflation is a main reason they
evaluate the economy as only fair or poor, while roughly two-in-ten cite
the high cost of living. Along this same theme, 6% point to the high
cost of food and groceries while identical shares say the high cost of
housing and high interest rates are a main reason they view the economy
as doing only fair or poor.
Other issues are also mentioned: 15%
say the lack of good paying jobs or low wages is a major reason for
their rating while 7% point to the national debt and government
spending. Another 5% give a negative response about Biden’s or
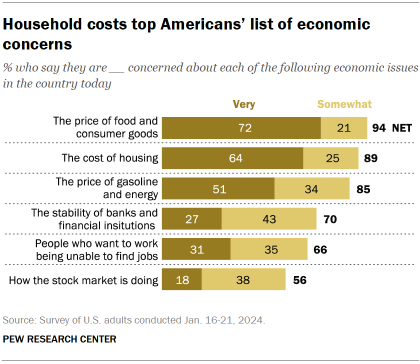
Democrats’ economic policies more broadly. Cost of goods, housing remain top economic concerns
Majorities of Americans continue to express a high level of concern about the price of food and consumer goods
(72% say they are very concerned about this) and the cost of housing
(64%). About half (51%) say they are very concerned about the price of
gasoline and energy. More than eight-in-ten say they are at least
somewhat concerned about each of these economic issues.
Other
economic issues rank lower on the public’s list of concerns. Smaller
shares of Americans say they are very concerned about the stability of
banks and financial institutions (27%), people who want to work being
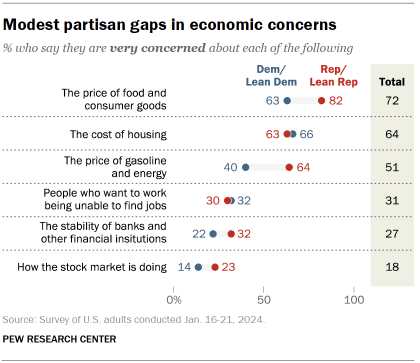
unable to find jobs (31%) or the performance of the stock market (18%). Majorities in both parties are very concerned about the cost of goods and housing
Republicans
and Democrats are fairly aligned in their economic concerns. Majorities
in both groups say they are very concerned about the cost of food,
consumer goods and housing. And substantially smaller shares express
concern about the stability of banks or the performance of the stock
market.
However, Republican concern about the price of food and
consumer goods is more widespread than Democratic concern (82% vs. 63%).
And the partisan gap on concerns about the price of gasoline and energy
is even wider: A 64% majority of Republicans say they are very
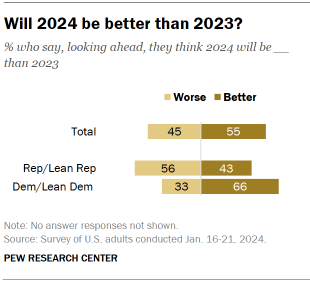
concerned about the cost of gas, compared with 40% of Democrats. Partisans’ expectations for the year ahead
As has been the case for the last three years,
Democrats are more likely than Republicans to say the upcoming year
will be better than the last. Two-thirds of Democrats say 2024 will be
better than 2023, while 43% of Republicans say the same.
This
dynamic in feelings about the new year – with Democrats expressing more
optimism than Republicans – has held true since 2021. Then, 83% of
Democrats said 2021 would be better than 2020 while 48% of Republicans
agreed.
In 2020, the pattern was the reverse. Republicans were
more likely to say 2020 would be better than 2019 compared with
Democrats (78% vs. 36%, respectively).
In Pew Research Center
surveys dating back to 2006 (when the question was first asked),
Americans who identify with or lean toward the president’s party have
tended to be more optimistic about the coming year than those who
associate with the opposing party.
Explore the patterns and trends of U.S. teens’ experiences on different online platforms below.
Which online platforms are most common among teens
YouTube tops the list among teens, with roughly nine-in-ten saying
they use the platform. TikTok, Snapchat and Instagram also remain
popular – more than half of teens report using each of these sites.
% of U.S. teens ages 13 to 17 who say they ever use the following apps or sites
Note: Figures from 2015 depicted above were collected from 2014 to 2015. Those who did not give an answer are not shown
Source: Surveys of U.S. teens conducted 2014-2023.
% of U.S. teens ages 13 to 17 who say they ever use the following apps or sites
Note: Figures from 2015 depicted above were collected from 2014 to 2015. Those who did not give an answer are not shown
Source: Surveys of U.S. teens conducted 2014-2023.
How use of online platforms by teens differs across demographic groups
Usage of the major online platforms can vary among teens by factors such as age, gender, and race and ethnicity.1
% of U.S. teens ages 13 to 17 who say they ever use the following apps or sites
Note: White and Black teens include those who report being only one race
and are not Hispanic. Hispanic teens are of any race. Those who did not
give an answer are not shown. Source: Survey of U.S. teens conducted Sept. 26-Oct. 23, 2023.
Note: White and Black teens include those who report being only one race
and are not Hispanic. Hispanic teens are of any race. Those who did not
give an answer are not shown. Source: Survey of U.S. teens conducted Sept. 26-Oct. 23, 2023.
Note: White and Black teens include those who report being only one race
and are not Hispanic. Hispanic teens are of any race. Those who did not
give an answer are not shown. Source: Survey of U.S. teens conducted Sept. 26-Oct. 23, 2023.
Note: White and Black teens include those who report being only one race
and are not Hispanic. Hispanic teens are of any race. Those who did not
give an answer are not shown. Source: Survey of U.S. teens conducted Sept. 26-Oct. 23, 2023.
How often teens visit online platforms
Many teens are on social media daily – if not constantly – but daily
use varies by platform. About seven-in-ten U.S. teens say they visit
YouTube every day – including 16% who do so almost constantly. TikTok
follows with 58% who say they visit it daily, while far fewer report
daily use of Facebook.
% of U.S. teens ages 13 to 17 who say they visit or use the following apps or sites …
Figures may not add up to NET values due to rounding. Those who did not give an answer are not shown.
Source: Survey of U.S. teens conducted Sept. 26-Oct. 23, 2023.
Which teens constantly visit online platforms
Differences emerge among teens, including by gender and race and
ethnicity, on whether they say they are on these platforms almost
constantly.
% of U.S. teens ages 13 to 17 who say they visit or use the following apps or sites almost constantly


 Note: Figures from 2015 depicted above were collected from 2014 to 2015. Those who did not give an answer are not shown

 Note: White and Black teens include those who report being only one race
and are not Hispanic. Hispanic teens are of any race. Those who did not
give an answer are not shown.
Note: White and Black teens include those who report being only one race
and are not Hispanic. Hispanic teens are of any race. Those who did not
give an answer are not shown.