Rubén Weinsteiner

President Joe Biden has shifted from promising the U.S. would back
Ukraine for “as long as it takes,” to saying the U.S. will provide
support “as long as we can” and contending that Ukraine has won “an
enormous victory already. | Evan Vucci/AP
With U.S. and European aid to Ukraine now in serious jeopardy, the Biden administration and European officials are quietly shifting their focus from supporting Ukraine’s goal of total victory over Russia to improving its position in an eventual negotiation to end the war, according to a Biden administration official and a European diplomat based in Washington. Such a negotiation would likely mean giving up parts of Ukraine to Russia.
The White House and Pentagon publicly insist there is no official change in administration policy — that they still support Ukraine’s aim of forcing Russia’s military completely out of the country. But along with the Ukrainians themselves, U.S. and European officials are now discussing the redeployment of Kyiv’s forces away from Ukrainian President Volodymyr Zelenskyy’s mostly failed counteroffensive into a stronger defensive position against Russian forces in the east, according to the administration official and the European diplomat, and confirmed by a senior administration official. This effort has also involved bolstering air defense systems and building fortifications, razor wire obstructions and anti-tank obstacles and ditches along Ukraine’s northern border with Belarus, these officials say. In addition, the Biden administration is focused on rapidly resurrecting Ukraine’s own defense industry to supply the desperately needed weaponry the U.S. Congress is balking at replacing.
The administration official told POLITICO Magazine this week that much of this strategic shift to defense is aimed at shoring up Ukraine’s position in any future negotiation. “That’s been our theory of the case throughout — the only way this war ends ultimately is through negotiation,” said the official, a White House spokesperson who was given anonymity because they are not authorized to speak on the record. “We want Ukraine to have the strongest hand possible when that comes.” The spokesperson emphasized, however, that no talks are planned yet, and that Ukrainian forces are still on the offensive in places and continue to kill and wound thousands of Russian troops. “We want them to be in a stronger position to hold their territory. It’s not that we’re discouraging them from launching any new offensive,” the spokesperson added.
For Biden, navigating the nearly two-year-old war in the middle of a tough election campaign — with former President Donald Trump and other Republican candidates openly mocking his efforts — will prove tricky at best. As it helps Ukraine shift to a more defensive posture, the Biden administration can’t appear to be handing the advantage to Putin after insisting since the war began in February 2022 that it stands fully behind Zelenskyy’s pledge of victory over Moscow.
“Those discussions [about peace talks] are starting, but [the administration] can’t back down publicly because of the political risk” to Biden, said a congressional official who is familiar with the administration’s thinking and who was granted anonymity to speak freely.
In an interview on Dec. 21, John Kirby, head of strategic communications at the National Security Council, said that with Washington “nearing the end of our ability” to provide military assistance to the Ukrainians because Republicans have blocked Biden’s request for roughly $60 billion more in aid, the Biden administration is “very much focused on helping them on offense and defense.”
“We are having literally daily conversations with the Ukrainians about the battlefield, about what their needs are and their intentions,” Kirby said. But he added: “I’m not going to telegraph to the Russians what the Ukrainian strategy is in the coming months.”
At his year-end news conference in early December, Zelenskyy said Ukraine was preparing new proposals to end the war but he added that he would not alter his insistence that Russia withdraw all forces. Kirby reaffirmed the administration line that “we are not dictating terms to President Zelenskyy.” Instead, he said, the White House is helping Zelenskyy to “operationalize” his own peace proposal “with interlocutors around the world.”
Over the past year — with U.S. military support flagging fast on Capitol Hill and Zelenskyy’s once-vaunted counteroffensive failing since it was launched in June — Biden has shifted from promising the U.S. would back Ukraine for “as long as it takes,” to saying the U.S. will provide support “as long as we can” and contending that Ukraine has won “an enormous victory already. Putin has failed.”
Some analysts believe that is code for: Get ready to declare a partial victory and find a way to at least a truce or ceasefire with Moscow, one that would leave Ukraine partially divided.
“Biden’s victory comment has the virtue of being true,” said George Beebe, a former chief of Russia analysis for the CIA who is now head of strategy for the Quincy Institute for Responsible Statecraft. But “time has become a stark disadvantage when it comes to Ukraine’s manpower and industrial capacity, and that’s true even if the West continues its support. The longer this goes on the more we’re going to have to concede up front just to get the Russians to the negotiating table.”
A shift to defense could buy Ukraine the time it needs to eventually force Putin into an acceptable compromise. “It’s very likely that going to a defensive posture would allow the Ukrainians to conserve resources while making future Russian progress look unlikely,” said Anthony Pfaff, an intelligence expert at the U.S. Army War College who co-authored a study that anticipated Putin’s Ukraine invasion years before it happened.
The European diplomat based in Washington said that the European Union is also raising the threat of expediting Ukraine’s membership in NATO to “put the Ukrainians in the best situation possible to negotiate” with Moscow.
That is a flashpoint for Putin, who is believed to be mainly interested in a strategic deal with Washington under which Ukraine will not enter NATO. The Biden administration continues to maintain publicly that NATO membership is not being negotiated. “President Biden has been very clear that NATO will be in Ukraine’s future,” said Kirby.
The two militaries remain largely stalemated but Putin may now be signaling that he’s willing to compromise if he’s allowed to keep the approximately 20 percent of Ukrainian territory that he partially controls in the east, The New York Times reported last week. Asked to respond to that report, the administration spokesperson said: “I’m not aware of any serious discussions at this point.”
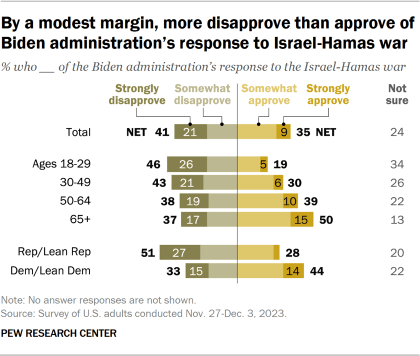
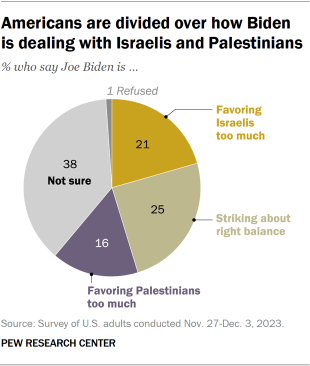
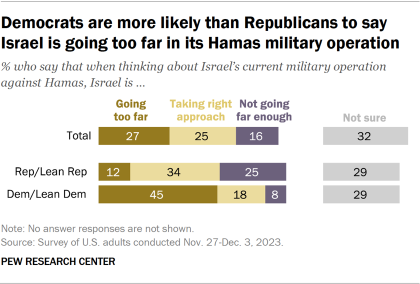
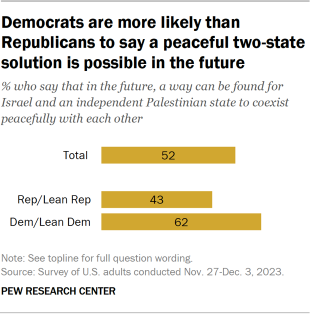
This is not the only major front on which Biden is trying to end a war — and avoid bad headlines in an election year. In the Mideast, the administration is engaged in a frenzied series of diplomatic visits to Israel — most recently last week by Defense Secretary Lloyd Austin and Joint Chiefs Chair Gen. C.Q. Brown — to prevent the Israelis from causing a greater humanitarian disaster in Gaza and escalating into a wider war against Hezbollah, which is becoming a real possibility and could inflame the entire region. Polls show that Biden’s earlier pledge of unlimited support for Israel’s retaliation is costing him support, especially among his progressive Democratic base.
“We don’t want to see a second front” against Hezbollah, said Kirby.
Foreign policy wasn’t expected to play a major role in the 2024 campaign — especially as inflation surged in the first two years of Biden’s term and economists last year predicted a recession. The U.S. economy will still likely be the main issue, polls show, and a new memo says the central theme of Biden’s campaign will be “protecting American democracy.” But with inflation fast retreating — dropping from more than 9.1 percent a year ago to close to the Federal Reserve’s target of 2 percent now — and the economy closer to achieving a highly unusual “soft landing,” the calculus of what could affect voting in 2024 may be changing, says Bruce Jentleson, a scholar of the presidency at Duke University. Biden is still suffering low approval ratings that Gallup has called “the worst of any modern-day president heading into a tough reelection campaign” — and his handling of foreign affairs in general and Israel and Ukraine in particular have recently become factors in that assessment.
As a result, multiplying crises abroad could imperil the president in the voting booth, says Jentleson, a former adviser to Vice President Al Gore. “What often happens is you get a bank shot where voters look at how you do foreign policy. They don’t care about the issues per se but they want to see leadership.”
Trump, the leading Republican contender, is already exploiting the perception that events overseas are spinning out of control. In his uniquely brazen way, the former president quoted the increasingly autocratic Hungarian Prime Minister Viktor Orban (Trump called him “highly respected”), a Putin sympathizer, as saying that Trump “is the man who can save the Western world.”
Trump touted Orban’s praise at the University of New Hampshire two weeks ago, telling the crowd, “[Orban] said it would have been very different, and there was no way that Russia … would have invaded Ukraine. It would not be possible for Russians to do that if President Trump were president, it wouldn’t have happened. … And you know what else wouldn’t have happened? The attack on Israel wouldn’t have happened.”
Asked to respond to that statement and others recently made by Trump — including one in which he favorably quoted Putin — Democratic National Committee Chair Jaime Harrison said in a statement to POLITICO Magazine: “Voters will face a clear choice in this election between President Biden’s strong leadership on the world stage, including his work to unite our allies and defend democracy at home and abroad, and Donald Trump’s record of praising dictators and terrorists. Americans want a president they can trust, not an erratic extremist — and that’s why they’ll reject Donald Trump once again next November.”
Still, Biden faces political peril if the war goes badly for the Ukrainians. Even if Republicans on the Hill are mainly responsible for holding up military aid, that won’t help Biden much politically if Putin starts to regain the battlefield advantage next year, after the nearly $100 billion Biden’s already put into stopping Russia. For most of the conflict GOP critics have accused Biden of moving too slowly to arm the Ukrainians with the most sophisticated weaponry, such as M1A1 Abrams battle tanks, long-range precision artillery and F-16 fighter jets. In an interview in July Zelenskyy himself said the delays “provided Russia with time to mine all our lands and build several lines of defense.” The ongoing Ukraine crisis also resurrects Trump’s old critique of NATO and the underspending Europeans. According to a NATO report from earlier this year, Europe’s largest economies all fell short of a common goal of spending 2 percent of economic output on defense.
Putin could be helped further in Europe by recent election victories for more of his far-right sympathizers, including Robert Fico in Slovakia and Geert Wilders in the Netherlands, both of whom might join Orban in blocking a proposed 50 billion euro ($54.9 billion) aid package.
The Ukrainians themselves are engaged in what is becoming a very public debate about how long they can hold out against Putin. With Ukraine running low on troops as well as weapons, Zelenskyy’s refusal to consider any fresh negotiations with Moscow is looking more and more politically untenable at home. The Ukrainian president, seeking to draft another half million troops, is facing rising domestic opposition from his military commander in chief, Gen. Valeriy Zaluzhnyi, and the mayor of Kyiv, Vitali Klitschko.
The senior Biden administration official told POLITICO Magazine that all these factors — the resistance in Congress and Ukraine’s internal politics — were playing into the new discussions with Kyiv about redeploying toward a defensive posture. “The other wild card is how much the weather is going to be a factor. As they decide how they’re going to posture themselves in the next two to three months, it’s going to become physically harder to operate and go on the offensive.”
One problem, of course, is that Putin understands these stakes all too well — especially given the surging poll numbers for Trump, who has suggested both that he’d swiftly cut a deal with Russia over Ukraine and order the U.S. to depart from, or at least downgrade, NATO. Militarily, the biggest concern may be that Putin could go on the offensive in the spring with major air support that he’s avoided until now but could deploy as Ukraine runs low on defensive missiles. Politically, the worry is that Putin won’t go near a negotiation until he sees who the next U.S. president is.
In late September Sergei Shoigu, Russia’s defense minister, said the Russians had an “activity plan until 2025,” and the next month Putin declared that Ukraine would have a “week to live” if arms supplies from Western countries were to end.
In the end, said Kirby, it is Putin who must make the first move — and the Russian president hasn’t done anything like that yet. “While we all would like to see this war end immediately,” Kirby said, Putin “has shown no indication of entering into good faith negotiations.”
With U.S. and European aid to Ukraine now in serious jeopardy, the Biden administration and European officials are quietly shifting their focus from supporting Ukraine’s goal of total victory over Russia to improving its position in an eventual negotiation to end the war, according to a Biden administration official and a European diplomat based in Washington. Such a negotiation would likely mean giving up parts of Ukraine to Russia.
The White House and Pentagon publicly insist there is no official change in administration policy — that they still support Ukraine’s aim of forcing Russia’s military completely out of the country. But along with the Ukrainians themselves, U.S. and European officials are now discussing the redeployment of Kyiv’s forces away from Ukrainian President Volodymyr Zelenskyy’s mostly failed counteroffensive into a stronger defensive position against Russian forces in the east, according to the administration official and the European diplomat, and confirmed by a senior administration official. This effort has also involved bolstering air defense systems and building fortifications, razor wire obstructions and anti-tank obstacles and ditches along Ukraine’s northern border with Belarus, these officials say. In addition, the Biden administration is focused on rapidly resurrecting Ukraine’s own defense industry to supply the desperately needed weaponry the U.S. Congress is balking at replacing.
The administration official told POLITICO Magazine this week that much of this strategic shift to defense is aimed at shoring up Ukraine’s position in any future negotiation. “That’s been our theory of the case throughout — the only way this war ends ultimately is through negotiation,” said the official, a White House spokesperson who was given anonymity because they are not authorized to speak on the record. “We want Ukraine to have the strongest hand possible when that comes.” The spokesperson emphasized, however, that no talks are planned yet, and that Ukrainian forces are still on the offensive in places and continue to kill and wound thousands of Russian troops. “We want them to be in a stronger position to hold their territory. It’s not that we’re discouraging them from launching any new offensive,” the spokesperson added.
For Biden, navigating the nearly two-year-old war in the middle of a tough election campaign — with former President Donald Trump and other Republican candidates openly mocking his efforts — will prove tricky at best. As it helps Ukraine shift to a more defensive posture, the Biden administration can’t appear to be handing the advantage to Putin after insisting since the war began in February 2022 that it stands fully behind Zelenskyy’s pledge of victory over Moscow.
“Those discussions [about peace talks] are starting, but [the administration] can’t back down publicly because of the political risk” to Biden, said a congressional official who is familiar with the administration’s thinking and who was granted anonymity to speak freely.
In an interview on Dec. 21, John Kirby, head of strategic communications at the National Security Council, said that with Washington “nearing the end of our ability” to provide military assistance to the Ukrainians because Republicans have blocked Biden’s request for roughly $60 billion more in aid, the Biden administration is “very much focused on helping them on offense and defense.”
“We are having literally daily conversations with the Ukrainians about the battlefield, about what their needs are and their intentions,” Kirby said. But he added: “I’m not going to telegraph to the Russians what the Ukrainian strategy is in the coming months.”
At his year-end news conference in early December, Zelenskyy said Ukraine was preparing new proposals to end the war but he added that he would not alter his insistence that Russia withdraw all forces. Kirby reaffirmed the administration line that “we are not dictating terms to President Zelenskyy.” Instead, he said, the White House is helping Zelenskyy to “operationalize” his own peace proposal “with interlocutors around the world.”
Over the past year — with U.S. military support flagging fast on Capitol Hill and Zelenskyy’s once-vaunted counteroffensive failing since it was launched in June — Biden has shifted from promising the U.S. would back Ukraine for “as long as it takes,” to saying the U.S. will provide support “as long as we can” and contending that Ukraine has won “an enormous victory already. Putin has failed.”
Some analysts believe that is code for: Get ready to declare a partial victory and find a way to at least a truce or ceasefire with Moscow, one that would leave Ukraine partially divided.
“Biden’s victory comment has the virtue of being true,” said George Beebe, a former chief of Russia analysis for the CIA who is now head of strategy for the Quincy Institute for Responsible Statecraft. But “time has become a stark disadvantage when it comes to Ukraine’s manpower and industrial capacity, and that’s true even if the West continues its support. The longer this goes on the more we’re going to have to concede up front just to get the Russians to the negotiating table.”
A shift to defense could buy Ukraine the time it needs to eventually force Putin into an acceptable compromise. “It’s very likely that going to a defensive posture would allow the Ukrainians to conserve resources while making future Russian progress look unlikely,” said Anthony Pfaff, an intelligence expert at the U.S. Army War College who co-authored a study that anticipated Putin’s Ukraine invasion years before it happened.
The European diplomat based in Washington said that the European Union is also raising the threat of expediting Ukraine’s membership in NATO to “put the Ukrainians in the best situation possible to negotiate” with Moscow.
That is a flashpoint for Putin, who is believed to be mainly interested in a strategic deal with Washington under which Ukraine will not enter NATO. The Biden administration continues to maintain publicly that NATO membership is not being negotiated. “President Biden has been very clear that NATO will be in Ukraine’s future,” said Kirby.
The two militaries remain largely stalemated but Putin may now be signaling that he’s willing to compromise if he’s allowed to keep the approximately 20 percent of Ukrainian territory that he partially controls in the east, The New York Times reported last week. Asked to respond to that report, the administration spokesperson said: “I’m not aware of any serious discussions at this point.”
This is not the only major front on which Biden is trying to end a war — and avoid bad headlines in an election year. In the Mideast, the administration is engaged in a frenzied series of diplomatic visits to Israel — most recently last week by Defense Secretary Lloyd Austin and Joint Chiefs Chair Gen. C.Q. Brown — to prevent the Israelis from causing a greater humanitarian disaster in Gaza and escalating into a wider war against Hezbollah, which is becoming a real possibility and could inflame the entire region. Polls show that Biden’s earlier pledge of unlimited support for Israel’s retaliation is costing him support, especially among his progressive Democratic base.
“We don’t want to see a second front” against Hezbollah, said Kirby.
Foreign policy wasn’t expected to play a major role in the 2024 campaign — especially as inflation surged in the first two years of Biden’s term and economists last year predicted a recession. The U.S. economy will still likely be the main issue, polls show, and a new memo says the central theme of Biden’s campaign will be “protecting American democracy.” But with inflation fast retreating — dropping from more than 9.1 percent a year ago to close to the Federal Reserve’s target of 2 percent now — and the economy closer to achieving a highly unusual “soft landing,” the calculus of what could affect voting in 2024 may be changing, says Bruce Jentleson, a scholar of the presidency at Duke University. Biden is still suffering low approval ratings that Gallup has called “the worst of any modern-day president heading into a tough reelection campaign” — and his handling of foreign affairs in general and Israel and Ukraine in particular have recently become factors in that assessment.
As a result, multiplying crises abroad could imperil the president in the voting booth, says Jentleson, a former adviser to Vice President Al Gore. “What often happens is you get a bank shot where voters look at how you do foreign policy. They don’t care about the issues per se but they want to see leadership.”
Trump, the leading Republican contender, is already exploiting the perception that events overseas are spinning out of control. In his uniquely brazen way, the former president quoted the increasingly autocratic Hungarian Prime Minister Viktor Orban (Trump called him “highly respected”), a Putin sympathizer, as saying that Trump “is the man who can save the Western world.”
Trump touted Orban’s praise at the University of New Hampshire two weeks ago, telling the crowd, “[Orban] said it would have been very different, and there was no way that Russia … would have invaded Ukraine. It would not be possible for Russians to do that if President Trump were president, it wouldn’t have happened. … And you know what else wouldn’t have happened? The attack on Israel wouldn’t have happened.”
Asked to respond to that statement and others recently made by Trump — including one in which he favorably quoted Putin — Democratic National Committee Chair Jaime Harrison said in a statement to POLITICO Magazine: “Voters will face a clear choice in this election between President Biden’s strong leadership on the world stage, including his work to unite our allies and defend democracy at home and abroad, and Donald Trump’s record of praising dictators and terrorists. Americans want a president they can trust, not an erratic extremist — and that’s why they’ll reject Donald Trump once again next November.”
Still, Biden faces political peril if the war goes badly for the Ukrainians. Even if Republicans on the Hill are mainly responsible for holding up military aid, that won’t help Biden much politically if Putin starts to regain the battlefield advantage next year, after the nearly $100 billion Biden’s already put into stopping Russia. For most of the conflict GOP critics have accused Biden of moving too slowly to arm the Ukrainians with the most sophisticated weaponry, such as M1A1 Abrams battle tanks, long-range precision artillery and F-16 fighter jets. In an interview in July Zelenskyy himself said the delays “provided Russia with time to mine all our lands and build several lines of defense.” The ongoing Ukraine crisis also resurrects Trump’s old critique of NATO and the underspending Europeans. According to a NATO report from earlier this year, Europe’s largest economies all fell short of a common goal of spending 2 percent of economic output on defense.
Putin could be helped further in Europe by recent election victories for more of his far-right sympathizers, including Robert Fico in Slovakia and Geert Wilders in the Netherlands, both of whom might join Orban in blocking a proposed 50 billion euro ($54.9 billion) aid package.
The Ukrainians themselves are engaged in what is becoming a very public debate about how long they can hold out against Putin. With Ukraine running low on troops as well as weapons, Zelenskyy’s refusal to consider any fresh negotiations with Moscow is looking more and more politically untenable at home. The Ukrainian president, seeking to draft another half million troops, is facing rising domestic opposition from his military commander in chief, Gen. Valeriy Zaluzhnyi, and the mayor of Kyiv, Vitali Klitschko.
The senior Biden administration official told POLITICO Magazine that all these factors — the resistance in Congress and Ukraine’s internal politics — were playing into the new discussions with Kyiv about redeploying toward a defensive posture. “The other wild card is how much the weather is going to be a factor. As they decide how they’re going to posture themselves in the next two to three months, it’s going to become physically harder to operate and go on the offensive.”
One problem, of course, is that Putin understands these stakes all too well — especially given the surging poll numbers for Trump, who has suggested both that he’d swiftly cut a deal with Russia over Ukraine and order the U.S. to depart from, or at least downgrade, NATO. Militarily, the biggest concern may be that Putin could go on the offensive in the spring with major air support that he’s avoided until now but could deploy as Ukraine runs low on defensive missiles. Politically, the worry is that Putin won’t go near a negotiation until he sees who the next U.S. president is.
In late September Sergei Shoigu, Russia’s defense minister, said the Russians had an “activity plan until 2025,” and the next month Putin declared that Ukraine would have a “week to live” if arms supplies from Western countries were to end.
In the end, said Kirby, it is Putin who must make the first move — and the Russian president hasn’t done anything like that yet. “While we all would like to see this war end immediately,” Kirby said, Putin “has shown no indication of entering into good faith negotiations.”
Rubén Weinsteiner
%2011.30.41.png)
%2022.27.50.png)
%2011.30.41.png)
%2011.30.41.png)
%2011.30.41.png)