
Ruben Weinsteiner
Roughly one-in-five workers say they are very or somewhat likely to
look for a new job in the next six months, but only about a third of
these workers think it would be easy to find one
The
Great Resignation of 2021 has continued into 2022, with quit rates reaching levels
last seen in the 1970s.
Although not all workers who leave a job are working in another job the
next month, the majority of those switching employers are seeing it pay
off in higher earnings, according to a new Pew Research Center analysis
of U.S. government data.
From April 2021 to March 2022, a period in which quit rates
reached post-pandemic highs,
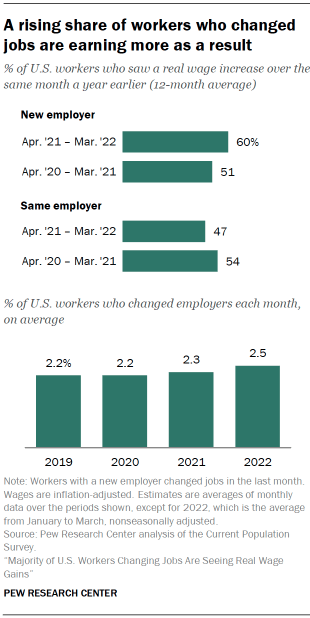
the majority of workers switching jobs (60%) saw an increase in their
real earnings over the same month the previous year. This happened
despite a
surge in the rate of inflation that
has eroded real earnings
for many others. Among workers who remained with the same employer,
fewer than half (47%) experienced an increase in real earnings.
Overall,
2.5% of workers – about 4 million – switched jobs on average each month
from January to March 2022. This share translates into an annual
turnover of 30% of workers – nearly 50 million – if it is assumed that
no workers change jobs more than once a year. It is higher than in 2021,
when 2.3% of workers switched employers each month, on average. About a
third (34%) of workers who left a job from January to March 2022 –
either voluntarily or involuntarily – were with a new employer the
following month.
When it comes to the earnings of job switchers,
the share finding higher pay has increased since the year following the
start of the pandemic. From April 2020 to March 2021, some 51% of job
switchers saw an increase in real earnings over the same months the
previous year. On the other hand, among workers who did not change
employers, the share reporting an increase in real earnings decreased
from 54% over the 2020-21 period to 47% over the 2021-22 period. Put
another way, the median worker who changed employers saw real gains in
earnings in both periods, while the median worker who stayed in place
saw a loss during the April 2021 to March 2022 period.
1 Perhaps not coincidentally, Americans cited low pay as one of the top reasons why they quit their job last year in a
Pew Research Center survey conducted in February 2022.
A
new Pew Research Center survey finds that about one-in-five workers
(22%) say they are very or somewhat likely to look for a new job in the
next six months. And despite
reports of widespread job openings,
37% of workers say they think finding a new job would be very or
somewhat difficult. Workers who feel they have little or no job security
in their current position are among the most likely to say they may
look for new employment: 45% say this, compared with only 14% of those
who say they have a great deal of security in their job. Similarly,
those who describe their personal financial situation as only fair or
poor are about twice as likely as those who say their finances are
excellent or good to say they’d consider making a job change (29% vs.
15%).
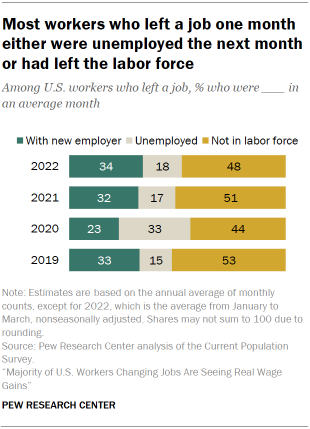
Among
workers leaving a job between 2019 and the first quarter of 2022, the
majority were either unemployed the next month or had left the labor
force and were, at least temporarily, not actively seeking work. Except
for in 2020, between 15% and 18% of workers who left a job one month
were unemployed the next month and 48% to 53% had left the labor force.
In 2020, the year
the coronavirus pandemic
began, a third (33%) of workers who left a job were still unemployed
the next month, reflecting the impact of the COVID-19 recession.
Looking
across key demographic groups, Black and Hispanic workers, workers
without a high school diploma and young adults are more likely to change
jobs in any given month. About half of job switchers also change their
industry or occupation in a typical month, but this share has not
changed since 2019. Women who leave a job are more likely than men who
leave a job to take a break from the labor force, and men with children
at home are least likely to do the same.
These findings emerge in part from the Pew Research Center’s analysis of monthly
Current Population Survey (CPS) data from January 2019 to March 2022. The CPS is the U.S. government’s official source for
monthly estimates of unemployment.
In principle, about three-quarters of the people interviewed in one
month of the CPS are also interviewed in the next month. Similarly,
about half of the people interviewed in one year are scheduled for
interviews in the next year. Much of the analysis exploits these
features to study the monthly transitions of workers from, for example,
employment to unemployment, and to examine the changes in their earnings
from one year to the next.
The report also draws on findings
from a nationally representative survey of 6,174 U.S. adults, including
3,784 employed adults. The survey was conducted June 27 to July 4, 2022,
using the Center’s
American Trends Panel. See the
methodology for more details.
The U.S. government’s job quits rate
The “quits rate,”
reported by the U.S. Bureau of Labor Statistics
(BLS) each month, is a measure of voluntary departures from employment.
Workers who retired or transferred to another location are excluded
from the quits rate but are included among “other separations” from
employment. In addition, workers are classified as having been
discharged or laid off, separating from their jobs involuntarily.
The quits rate stood at 2.8%
in May 2022,
up from a recent low of 1.6% in April 2020, seasonally adjusted. The
increase since 2019 – when the quits rate averaged 2.3% for the year –
is less sizable. The overall job separations rate stood at 3.9% in May
2022, about the same as a pre-pandemic average of 3.8% in 2019.
Not all workers who quit a job voluntarily one month are employed the next month. Based on its
survey of business establishments,
the BLS estimates roughly 4 million workers had quit their jobs each month in 2022. Separately, based on the
Current Population Survey (CPS), a survey of households,
the BLS reports
that roughly 800,000 workers who were unemployed in an average month in
2022 were job leavers. Although these two estimates are based on
different universes, they suggest that a substantial share of workers
who voluntarily quit their jobs are unemployed, at least temporarily.
Yet others
may be taking a break from work.
The measures used in this report
This
report focuses on three groups of workers who have seen a change in
their employment status since the previous month. One group consists of
workers who changed employers. They had jobs in both time periods but
made a switch, whether voluntarily or involuntarily. It is possible that
some of these workers were unemployed for up to four weeks in the
transition from one job to the next. This group differs from the
universe for the quits rate for two reasons: It includes involuntary
departures, but it excludes those who were either unemployed or not
seeking work the next month.
The second group of workers in the
report consists of those who separated from employment but were still
unemployed the next month. The third group is comprised of workers who
were not seeking work in the month following a job separation. They are
not necessarily retired and may return to work later.
The
estimates in this report are derived from the CPS, whereas the official
quits and separation rates are based on a survey of establishments.
There are
several differences
between these two surveys, including the fact that only the CPS
encompasses the unincorporated self-employed, unpaid family workers,
agricultural workers and private household workers.
Black and
Hispanic workers, workers with no college education and younger workers
are more likely to change jobs in any given month
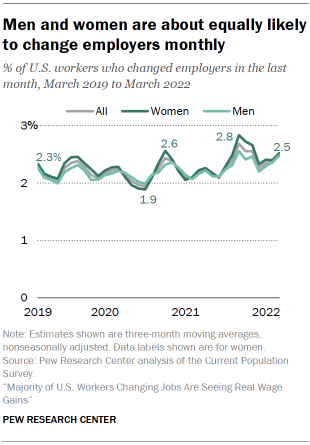
The
rate at which workers switch jobs on average each month has seen its
ups and downs since 2019. The turnover rate in the first quarter of 2022
(2.5%) was higher than in mid-2020, when the monthly rate had dropped
to 1.9% during the COVID-19 downturn. However, it is similar to the rate
that prevailed in the first quarter of 2019 (2.3%).
2 Men
and women changed employers monthly over the 2019-2022 period at a
roughly comparable rate. Starting at 2.3% in the first quarter of 2019
for each, the monthly turnover across employers for men and women hit a
low near 1.9% in mid-2020. Subsequently, the rate neared a peak for both
women (2.8%) and men (2.6%) in the third quarter of 2021. In the first
quarter of 2022, the shares of men and women who had changed employers
in the last month both stood at 2.5%.
The presence of children
at home is also not related to the shares of men and women changing
employers. In the first quarter of 2019, the monthly rates for men and
women with children at home stood at 2.1% and 2.2%, respectively. In the
first quarter of 2022, the rates for these two groups of parents stood
at 2.3% each.
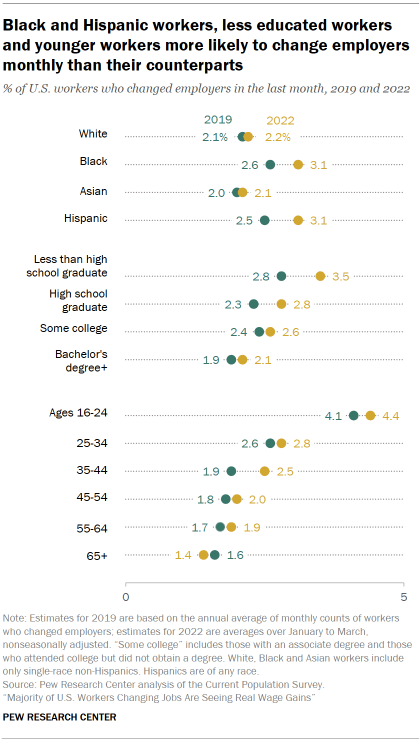
Among
the major racial and ethnic groups, Hispanic and Black workers are more
likely to switch employers than White and Asian workers. In 2019, 2.6%
of Black workers and 2.5% of Hispanic workers moved from one employer to
another on average each month, compared with 2.1% of White workers and
2.0% of Asian workers. Moreover, while the likelihood of changing
employers increased among Hispanic workers from 2019 to 2022 – to 3.1% –
it remained about the same among White and Asian workers.
There
is also a clear pattern across workers of different levels of
education. Less educated workers are more transient, with workers
without a high school diploma moving across employers at a monthly rate
of 3.5% in 2022, up from 2.8% in 2019. Workers with a bachelor’s degree
or higher level of education switched at a rate of 2.1%, about the same
as in 2019.
Similarly, young adults (ages 16 to 24) are more
likely than older workers to change employers in an average month. Young
adults moved across employers at a monthly rate of 4.1% in 2019 and
4.4% in 2022. Workers nearing retirement (ages 55 to 64) moved at a rate
of 1.9% in 2022.
Workers who move from one employer to another
in the space of a month may experience unemployment in the interim,
especially those whose departure was involuntary. Thus, one possible
factor behind the patterns observed among demographic groups is how the
unemployment rate varies across groups.
Historically, there is little difference in the unemployment rate
between men and women. However, compared with their counterparts, Black
and Hispanic workers, less educated workers, and younger workers tend to
experience higher rates of unemployment through all stages of the
business cycle, whether through voluntary or involuntary separations
from their previous jobs. As a result, relatively higher shares of these
workers are on the lookout for new job opportunities at any point in
time or have switched jobs from one month to the next.
Workers who changed jobs saw higher wage growth than other workers following the COVID-19 downturn
After
increasing by only 1.4% from December 2019 to December 2020, U.S.
consumer prices surged by 7.0% from December 2020 to December 2021. The
pace has only
picked up since then.
As a result, the share of workers overall experiencing an increase in
real earnings – over and above inflation – fell from 54% over the April
2020-March 2021 period to 47% over the April 2021-March 2022 period.
Considered
another way, half of U.S. workers sampled in the April 2020-March 2021
period saw a real wage gain of 2.3% or higher, compared with the same
month the year before. The other half either experienced a gain of less
than 2.3% or saw their earnings decrease. But the script flipped a year
later, with half of the workers experiencing a real wage loss of 1.6% or
more over the April 2021- March 2022 period. Thus, the median worker in
the U.S. has not fared well financially in the current inflationary
environment.
However, most workers who switched employers continued to experience an increase in real earnings, and
amid a surge in demand for new hires, their advantage over other workers in this respect appears to be widening.
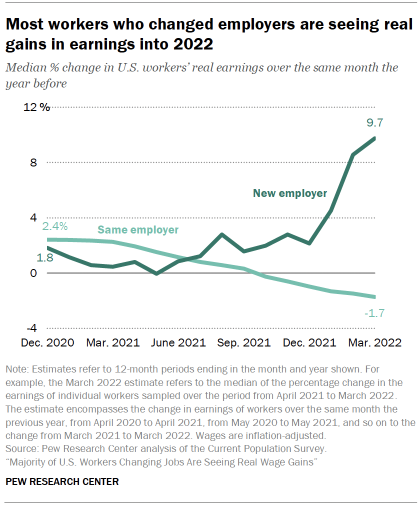
From
January to December 2020, half of the workers who changed employers in
some month that year experienced a wage increase of 1.8% or more, and
half of the workers who stayed put saw an increase of 2.4% or more,
compared with their wages in January to December 2019. The next year,
from January to December 2021, the median worker among those who changed
employers saw a wage increase of 2.1%, and the median worker who did
not switch employers saw a loss of 1.0%. From April 2021 to March 2022,
half of the workers who changed jobs experienced a real increase of 9.7%
or more over their pay a year earlier. Meanwhile, the median worker who
remained in the same job experienced a loss of 1.7%.
Workers often change industry or occupation as they move from one employer to another
Wages
are not all that change for workers moving across employers; many often
change the industry or occupation in which they are working as they
move from one employer to the next. From 2019 to 2021, about 48% of
workers who changed employers also found themselves in a new industry,
on average each month – a pattern undisturbed by the pandemic. Because
large firms may
operate in more than one industry,
workers who did not change employers are not entirely lacking in this
opportunity. But only about 3% of these workers moved from one industry
to another in a typical month.
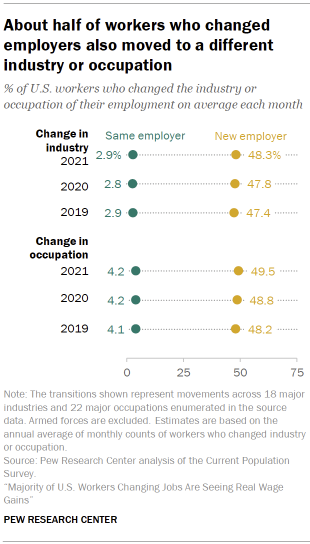
A
similar pattern played out with respect to changes in occupation.
Roughly half (49.5%) of workers who changed employers also changed
occupations in an average month from 2019 to 2021. Some 4% of workers
not changing employers experienced a change in occupation, an
opportunity that may present itself through training or career
progression within the same establishment or firm.
Overall,
about 4% of all workers changed industries in an average month from 2019
to 2021. In 2021, the average rate at which workers left an industry
for another in a single month varied from 2.2% in Educational Services
to 5.8% in Social Services. The rates of departure from Hospitals and
Other Health Services and Public Administration (about 3% or less) were
also relatively low, and exits from Repair and Maintenance Services,
Personal and Laundry Services/Private Household Services, and Arts and
Entertainment (about 5% or higher) were relatively elevated. This
general pattern was also present in 2019 and 2020.
About 5% of
workers overall switched occupations in 2021. The share of workers
leaving an occupation in a typical month in 2021 tended to be lower in
professional occupations, such as Education, Instruction and Library
Occupations and Legal Occupations (about 3% each), and relatively higher
in more blue-collar jobs, such as Transportation and Material Moving,
Production, and Farming, Fishing and Forestry Occupations (about 6% or
higher). A similar pattern prevailed in 2019 and 2020.
Among workers who quit or lose a job one month, women are more likely than men to leave the labor force by the next month
In
addition to workers who successfully transition from one employer to
another within a month there are workers who are left unemployed and
others who opt to leave the labor force. The latter two groups combined
outnumber those moving from job to job.
From January to March
2022, about 9 million workers separated from their place of employment
each month, on average. This included 3.1 million workers (34%) who were
on the job with a different employer the next month. An additional 1.6
million workers (18%) were unemployed and looking for a new job, and 4.3
million (48%) had left the labor force, at least temporarily.
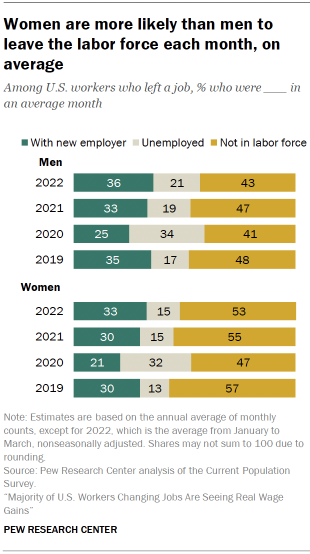
A
similar pattern had existed in 2019 and 2021, when only about a third
of workers who left employment one month were at work the next month, on
average. In 2020, the year the pandemic struck and forced widespread
business closures, only 23% of workers who left employment one month
were at a new job within a month. About a third (33%) were still looking
for a job, roughly double the shares in 2019, 2021 and 2022.
Among
workers separating from employment in any given month, women are more
likely than men to leave the labor force by the next month. For example,
in 2021, 2.5 million women and 2.1 million men left the labor force on
average each month. This represented 55% of women and 47% of men who
separated from their previous place of employment.
The departure
of workers from the labor force is balanced by the return or the new
entry of workers into the labor force. From January to March 2022, some
2.9 million women and 2.5 million men entered the labor force each
month, on average.
Overall, a greater number of women than men
tend to enter or exit the labor force in an average month. To some
extent, this is likely driven by the demands of childbirth. But women
also generally devote
more time than men to familial duties, whether caring for children or on household activities, and are more likely to
adapt their careers to care for family.
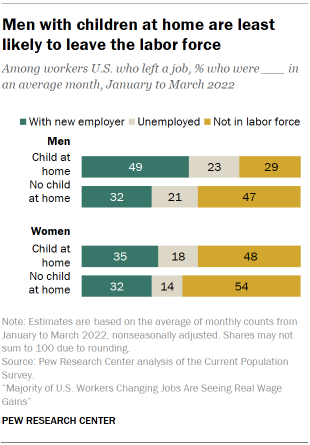
Among
workers with children at home who leave employment in any month, there
is a significant gap between men and women in the shares that opt to
leave the labor force. About half (48%) of women with children at home
did so on average from January to March 2022, compared with 29% of men
with children at home. Men with no children at home are also more likely
than men with children at home to exit the labor force monthly. That
is, in part, due to the fact that adults with no children at home are
older on average, encompassing many of the workers nearing retirement
age.
Among racial and ethnic groups, Asian workers leaving
employment one month are less likely than other workers to still be
unemployed the next month. On average from January to March 2022, only
7% of Asian workers were unemployed the month following a job separation
compared with 24% of Black workers, 21% of Hispanic workers and 16% of
White workers.
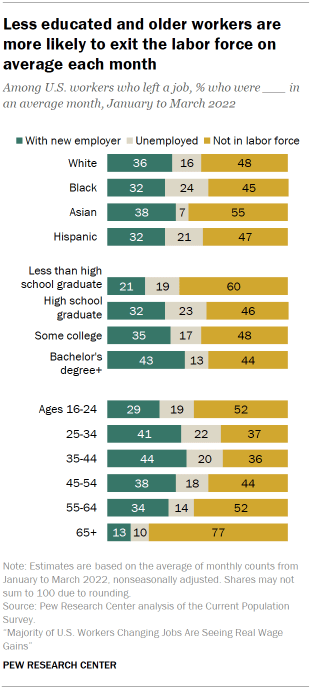
Workers
with at a least a high school diploma are less likely to exit the labor
force and more likely to be with a new employer a month after leaving a
job compared with their counterparts. Among workers who did not receive
a high school diploma, 60% of those who left employment one month had
left the labor force by the next month and only 21% were reemployed. On
the other hand, among workers with a bachelor’s degree or higher level
of education, 43% were reemployed the next month, about the same as the
share (44%) that left the labor force.
Not surprisingly, a large
share (77%) of workers ages 65 and older – the traditional retirement
age bracket – exit the labor force monthly. About half of young adult
workers (ages 16 to 24) and those nearing retirement (ages 55 to 64)
also exit the labor force monthly upon separation from employment. Among
adults in the prime of their working years (ages 25 to 54), 38% to 44%
are reemployed within a month, about the same as the share that step
away from the labor force.
Roughly one-in five workers say they’re likely to look for a new job in the next six months
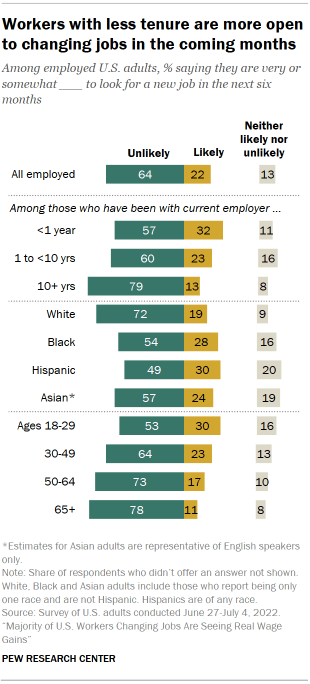
While
most workers have no near-term plans to leave their jobs, 22% say they
are very or somewhat likely to look for a new job in the next six
months. Most (64%) say they are very or somewhat unlikely to look for a
new job in the coming months.
Workers who have been with their
employer for less than a year are significantly more likely than those
who’ve been in their current job longer to say they’re likely to look
for a new job in the next six months. About a third (32%) of those
who’ve been in their job for less than a year say this, including 20%
who say they are very likely to seek a new job. Among those who’ve been
with their current employer between one and 10 years, 23% say they’re
very or somewhat likely to look for a new job; 13% who’ve been in their
job longer say the same.
The likelihood of changing jobs in the
near future also differs across key demographic groups. Higher shares of
Black (28%) and Hispanic (30%) workers, compared with White workers
(19%), say they are very or somewhat likely to look for a new job in the
next six months. About a quarter of Asian workers (24%) say the same.
And younger workers are more likely than middle-aged and older workers
to say this: 30% of workers ages 18 to 29 say they are likely to look
for a new job in the next six months, compared with 23% of workers ages
30 to 49, 17% of those ages 50 to 64 and 11% of those 65 and older. This
is related to the fact that younger workers are by far the most likely
to have been with their current employer for less than a year.
The
share who say they are likely to look for a new job in the coming
months does not differ significantly by educational attainment.
Workers
who are more downbeat about their own financial situation are more
likely to say they may make a job change. Among those who describe their
current financial situation as only fair or poor, 29% say they are
likely to look for a new job in the next six months. Only 15% of those
who rate their financial situation as excellent or good say the same.
Roughly four-in-ten workers say it would be easy to find a new job if they looked today
Workers
are split over how easy or difficult it would be for them to get the
kind of job they’d want if they were to look for a new job today. About
four-in-ten (39%) say it would be very or somewhat easy, while a similar
share (37%) say it would be very or somewhat difficult. About a quarter
(23%) say it would be neither easy nor difficult for them to get the
kind of job they want if they were looking right now.
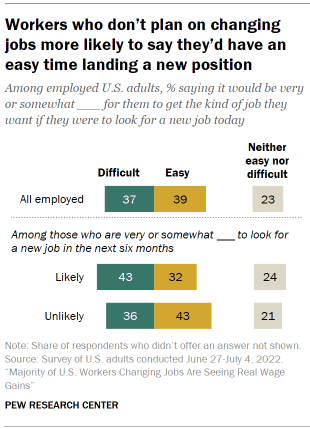
Workers
who aren’t actually intending to look for a new job soon are more
likely than those who are to say it would be easy for them to find one.
Among those who say it’s unlikely they will look for a job in the next
six months, 43% say it would be easy for them to get the kind of job
they want if they were looking today. Among those who say they are
likely to look for another job soon, 32% say the same.
Upper-income
workers are significantly more likely than middle- and lower-income
workers to say they’d have an easy time finding a job if they were
looking today. Fully half of upper-income workers say it would be easy
for them to find the kind of job they wanted, compared with 38% of
middle-income workers and 34% of those with lower incomes.
3 Perceived job security is linked with likelihood of looking for a new job
Most
workers feel they have at least a fair amount of job security in their
current position. About a third (35%) say they have a great deal of job
security, and a similar share (34%) say they have a fair amount. Smaller
shares say they have some (16%) or a little (9%) job security, and 6%
say they have none at all.
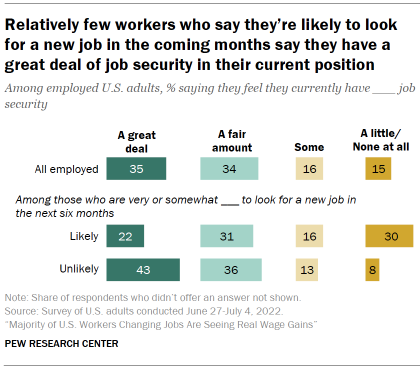
Job
security is more tenuous for those workers who say they’re likely to
look for a new job in the next six months. Only 22% of these workers say
they have a great deal of job security in their current position. By
contrast, among those who say it’s unlikely they’d look for a job in the
coming months, 43% say they have a great deal of security in their
current job.
Workers who’ve been with their current employer for
10 years or longer are among the most likely to say they have a great
deal of job security: 46% say this, compared with about a third (32%) of
those who’ve been with their employer between one and 10 years and 26%
who’ve been with their employer less than a year. There are wide
differences by income as well: 51% of upper-income workers say they have
a great deal of job security, compared with 35% of middle-income
workers and 25% of those with lower incomes.



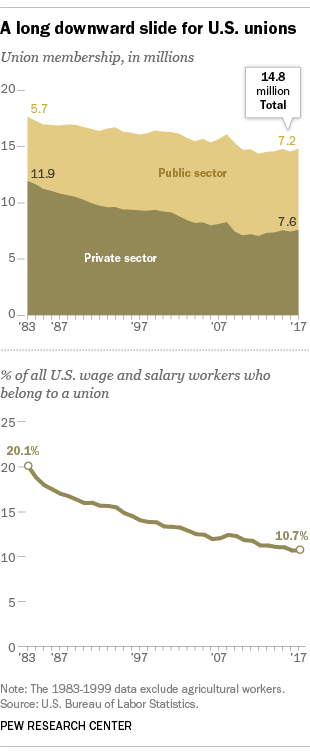 Despite
those fairly benign views, unionization rates in the United States have
dwindled in recent decades (even though, in the past few years, the
absolute number of union members has grown slightly). As of 2017, just
10.7% of all wage and salary workers were union members, matching the
 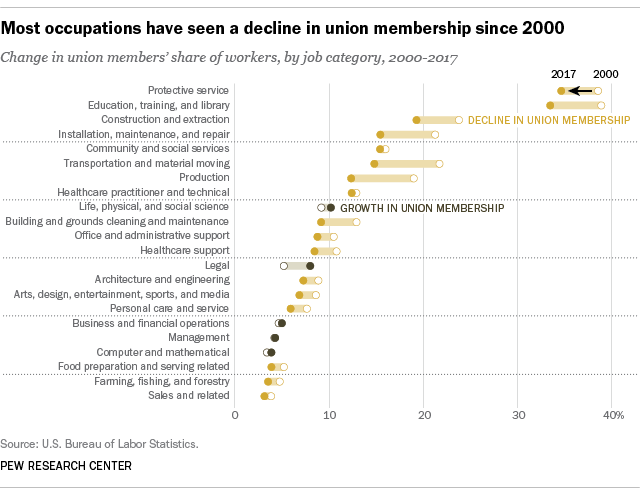 Manufacturing-type jobs, both union and non-union,
 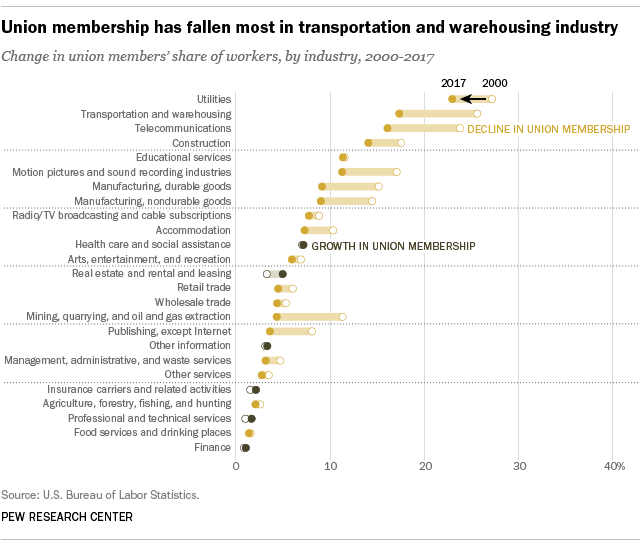 Not
all the news is bleak for labor unions. The total number of unionized
workers has grown modestly in recent years: up about 451,000 between
2012 and 2017, to just over 14.8 million. Most of that increase has
occurred in two occupational categories: construction and extraction
workers and healthcare practitioners and technicians. The construction
industry, which was hammered (so to speak) by the housing collapse a
decade ago, has recovered most of the 2.2 million jobs it shed between
2006 and 2010. The health care and social assistance industry was barely
affected by the Great Recession, and has added more than 1.7 million
jobs in the past six years alone.


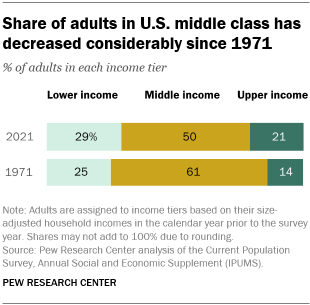




 Half of young Americans believe the GOP cares more about “the
interests of the elite” than for people like them (21%); a plurality
(39%) say the same about Democrats; 3-in-5 see the other party as a
threat to democracy
  Young Americans, across demographic and partisan divides, are
overwhelmingly comfortable with a close friend coming out as LGBTQ;
steady support charted for more than a decade
  Despite growing acceptance of LGBTQ-identifying youth, nearly half
(45%) of LGBTQ youth feel under attack “a lot” because of their sexual
orientation and are nearly three times as likely as straight youth
(LGBTQ: 28%, Straight: 11%) to be uncomfortable expressing their
identity and true self with family.

 85% of young Americans favor some form of government action on student loan debt, but only 38% favor total debt cancellation
