יום שבת, 26 בינואר 2019

Latin America, Caribbean no longer world’s fastest growing source of international migrants

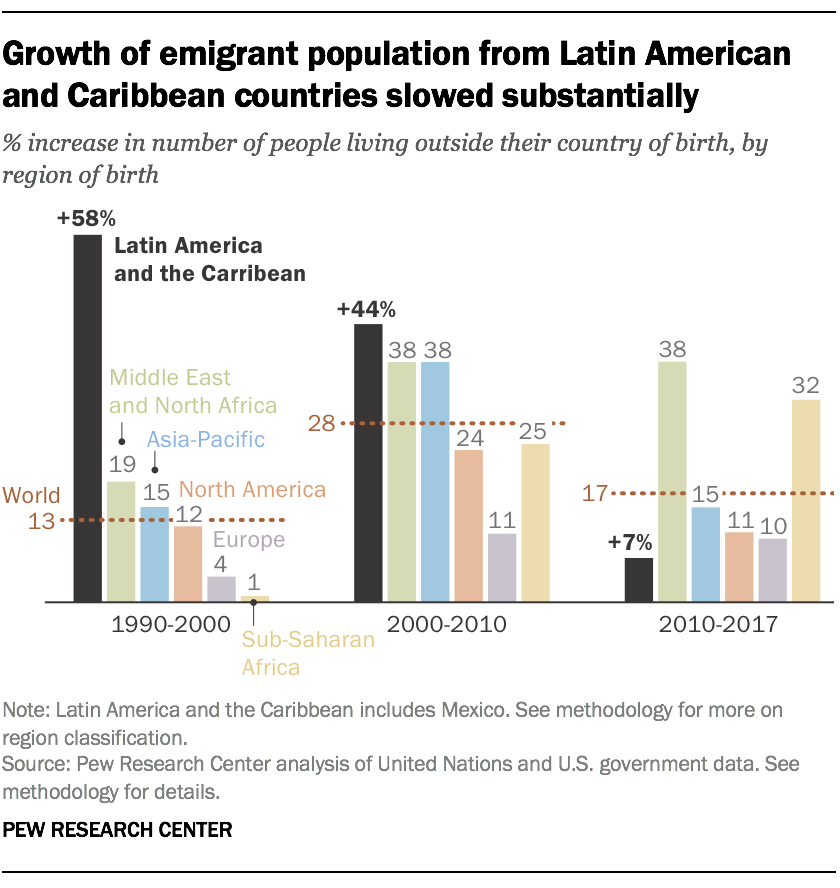
The Latin America and Caribbean region was the world’s fastest-growing source of international migrants from 1990 through 2010. However, growth in the number of emigrants from this region has slowed dramatically in recent years – due in large part to a slowdown of people leaving Mexico, according to a Pew Research Center analysis of government data.


The global population of emigrants (people living outside their country of birth) from Latin American-Caribbean nations grew by 7% between 2010 and 2017, according to the analysis, which uses data from the United Nations and the U.S. Census Bureau. This is slower than the overall worldwide growth rate of 17% during the same period. Other regions, meanwhile, saw faster growth than Latin America during the period, including the Middle East and North Africa (38% increase) and sub-Saharan Africa (32%).

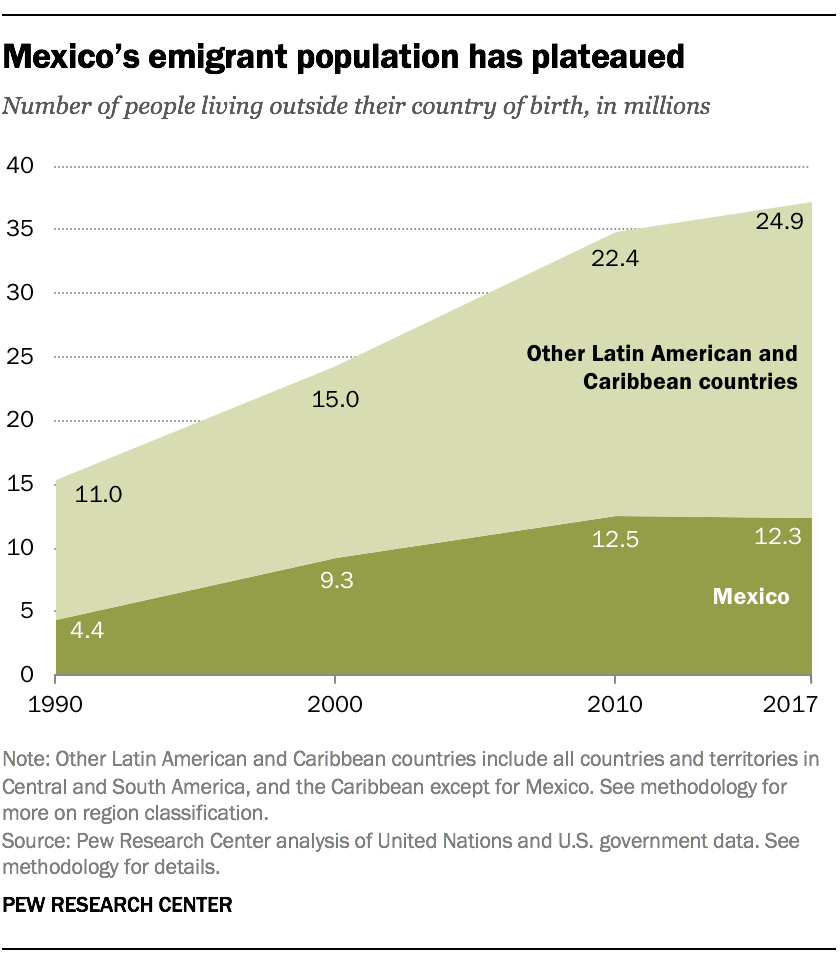
Even though the percentage growth of the emigrant population from Latin American-Caribbean nations has slowed, the region is still a large source of emigrants. About 37 million people from the region lived outside their country of birth in 2017, up from 35 million in 2010 and accounting for nearly 15% of the world’s more than 250 million international migrants in 2017. The Asia-Pacific region is the source of the world’s largest emigrant population (85 million), as well as the largest share of the global total (33%).


Methodology

The Latin America and Caribbean region’s recent slowdown stands in contrast to previous decades, when it was the world’s fastest-growing region as a source of emigrants. From 1990 to 2000, and from 2000 to 2010, its emigrant population grew by 58% and 44%, respectively.

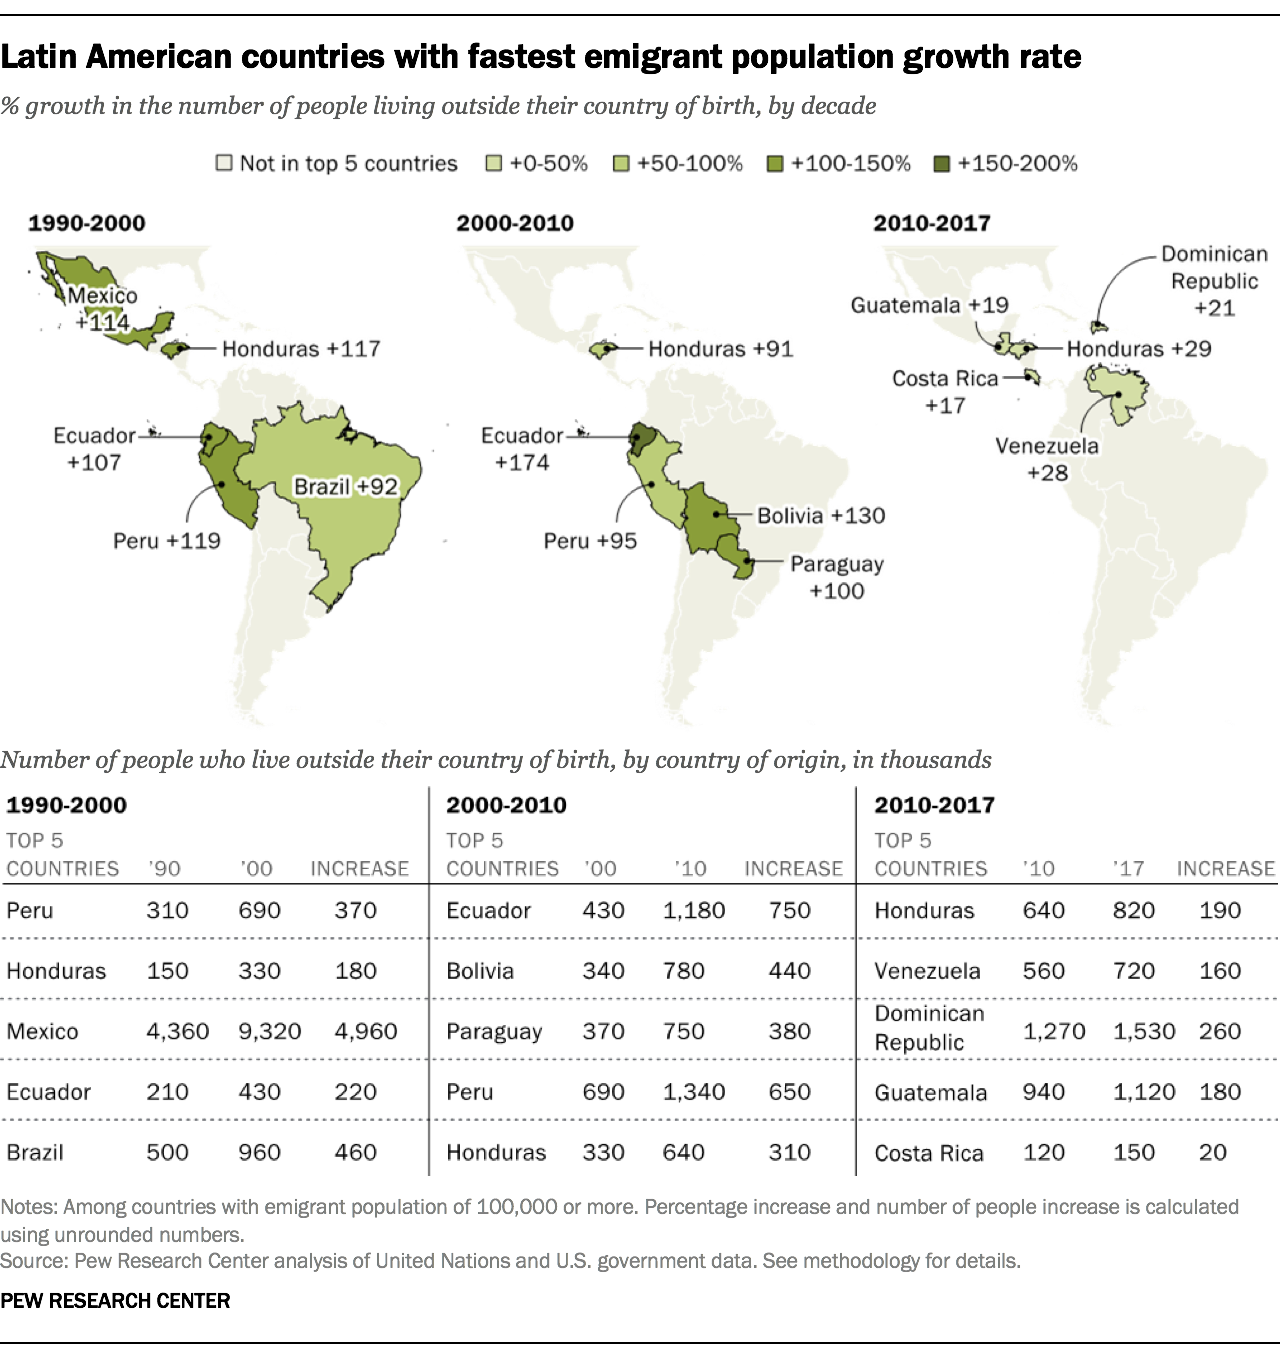
Mexico played a key role in much of this growth. Between 1990 and 2000, the number of Mexicans living outside their birth country increased by 114%, or about 5.0 million. Growth continued in the 2000s, though it slowed to 34%.

In the current decade through 2017, Mexico’s emigrant population has leveled off, Pew Research Center estimates show. The number of people born in Mexico and living abroad was 12.3 million in 2017, compared with 12.5 million in 2010. As a result, Mexico’s share of all emigrants from Latin America and the Caribbean went from 36% in 2010 to 33% in 2017, though Mexico remains the single largest emigrant population from the region.

Ecuador, which was the source of 1.1 million emigrants as of 2017, has seen one of the region’s largest declines so far this decade – a 6% drop since 2010 (among those with emigrant populations of 100,000 or more). This is a sharp reversal from the 2000-2010 period, when Ecuador’s emigrant population grew by 174%, the highest in the region.

Since 2010, Honduras (29%), Venezuela (28%), the Dominican Republic (21%), Guatemala (19%) and Costa Rica (17%) have had the fastest-growing emigrant populations among Latin American and Caribbean nations (with emigrant populations of 100,000 or more). Some reasons for these increases include political and economic instability, conflict and violence, and climate-related events. For example, in the case of Venezuela, hyperinflation has made certain basic goods and services unaffordable. That has contributed to a large outmigration that began in 2015 and continued through 2018. (Early estimates from last year show a dramatic increase in emigrants from Venezuela not captured in the latest UN emigrant stock data.)

Many of these factors have also contributed to a growing number of migrants from the region seeking asylum, mostly in the United States and Europe. About 350,000 asylum applications worldwide were submitted by people from Latin American and Caribbean countries in 2017, up from fewer than 70,000 in 2010. El Salvador, Guatemala, Honduras and Venezuela accounted for about 70% of the region’s asylum applications in 2017, up from 14% in 2010.

U.S. remains top destination for Latin American migrants

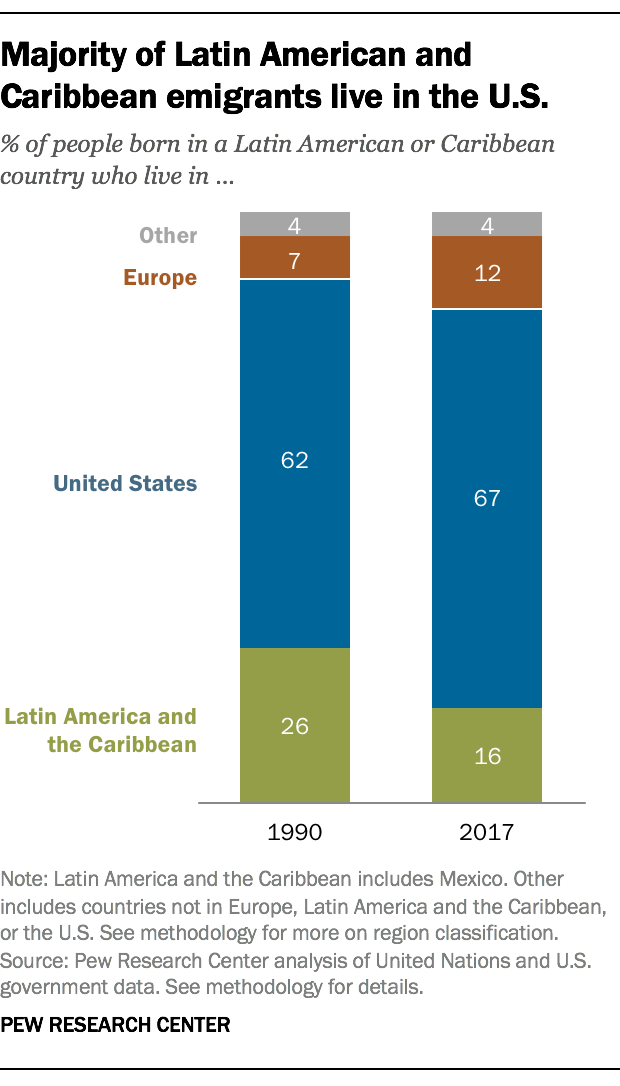
The destinations of emigrants from Latin American and Caribbean countries have changed somewhat since 1990, though the United States remains the overwhelming destination of choice. The U.S. was home to 67% of the region’s emigrants in 2017, almost unchanged from 62% in 1990.

In 2017, 16% of emigrants lived in other Latin American-Caribbean countries, down from 26% in 1990. Argentina was the top destination country for this group of emigrants, with 1.8 million people from other Latin American countries living there in 2017, up from 830,000 in 1990.

Meanwhile, the share of Latin American and Caribbean emigrants living in Europe reached 12% in 2017, up from 7% in 1990.

Within Europe, Spain was the top destination country, home to 2.2 million people born in Latin America and the Caribbean in 2017, an increase of about 2 million since 1990. Meanwhile, the number of Latin American and Caribbean emigrants living in Italy grew by more than 500,000 between 1990 and 2017, though the population (630,000 in 2017) remains much smaller than in Spain. (Spain alone has about half of Europe’s emigrants from Latin America-Caribbean countries.)

יום רביעי, 23 בינואר 2019

Nearly three-quarters of Republicans say the news media don’t understand people like them

A majority of Americans believe the news media do not understand people like them, and this feeling is especially common among Republicans, according to a new Pew Research Center analysis.

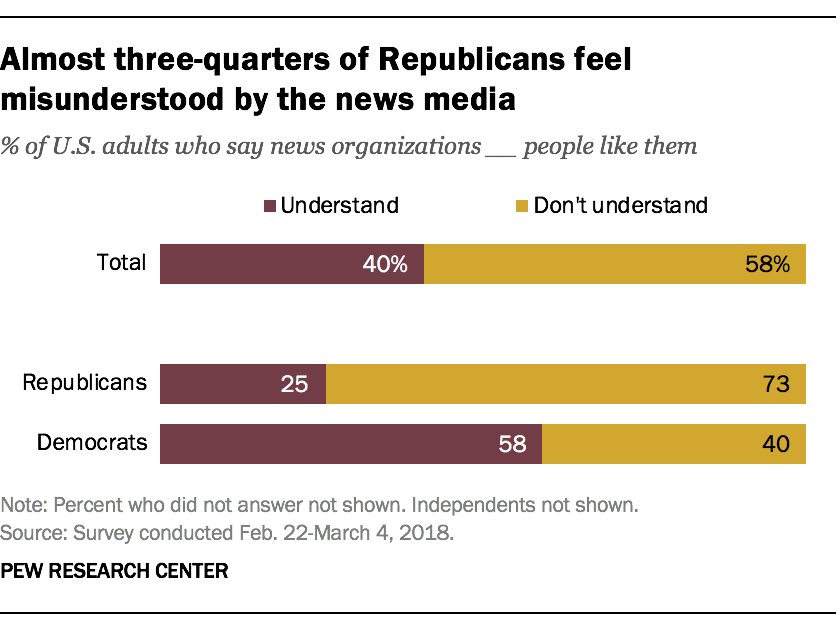
Overall, 58% of U.S. adults feel the news media do not understand people like them, while 40% feel they are understood, as reported in a recent Pew Research Center study.

Republicans, however, are nearly three times as likely to feel that news organizations don’t understand them (73%) as they are to say they feel understood (25%). By comparison, most Democrats (58%) say they feel understood by the news media, while four-in-ten say they do not.


Not only are Republicans far more likely to feel misunderstood by the news media, they feel this way regardless of their media habits and demographic characteristics, according to the analysis of data collected Feb. 22 to March 4, 2018, among 5,035 U.S. adults.

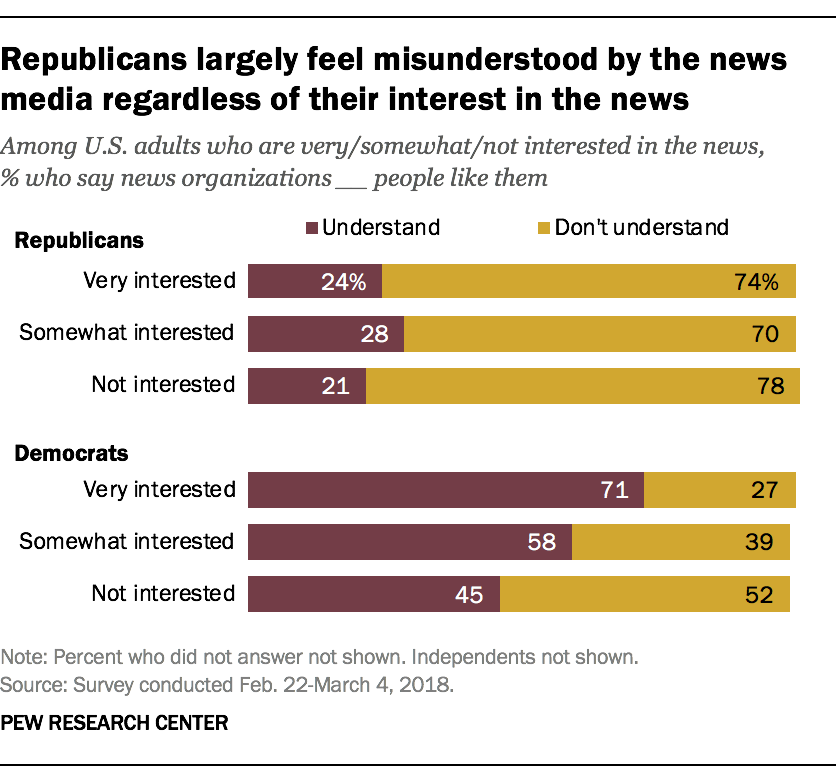
About three-quarters of Republicans who are very interested in the news (74%) say news organizations do not understand people like them – about the same share as among those who are somewhat interested (70%) and not interested in the news (78%).

Among Democrats, however, news interest plays a large role in whether they feel misunderstood. About a quarter of Democrats who are very interested in the news feel misunderstood (27%), compared with about four-in-ten of the somewhat interested (39%) and roughly half of those not interested (52%). Still, Democrats at all levels of news interest are much less likely than Republicans to feel misunderstood by the news media. (For more on the measure of news interest, see this report.)

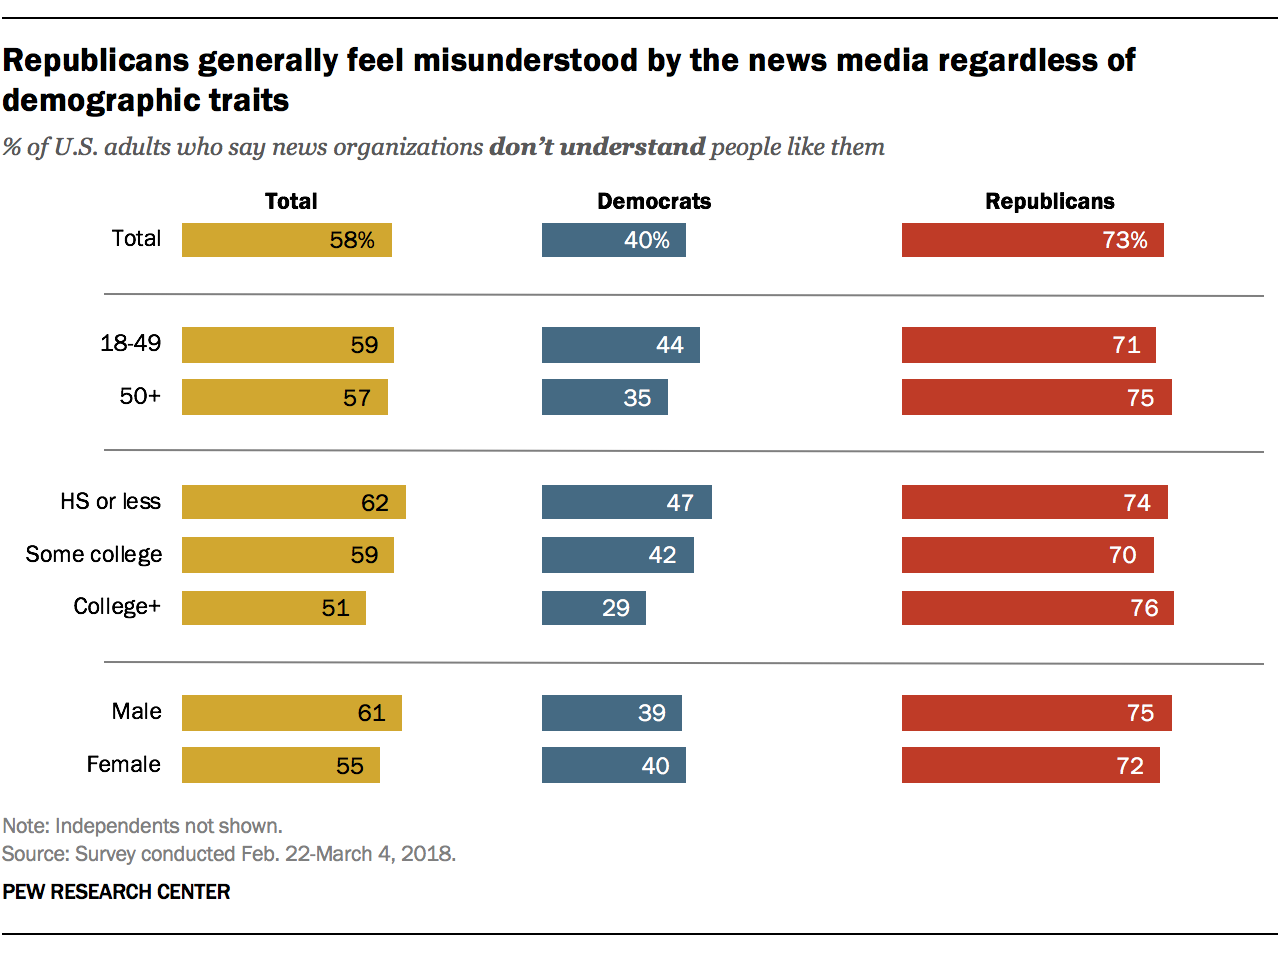
Republicans differ little across various demographic groups in saying people like them are misunderstood by the media. For example, Republicans have high levels of feeling misunderstood across sex, age and education groups (between 70% and 76% in each group say they feel misunderstood).

Among Democrats, however, there are differences across demographic traits, especially when it comes to education and age. About three-in-ten Democrats with at least a college degree (29%) feel misunderstood by the news media, compared with 42% of those with some college education and 47% of those with a high school diploma or less. Democrats ages 50 and older are also less likely to feel misunderstood than those under age 50 (35% vs. 44%).

Overall, independents fall somewhere between Republicans and Democrats in feeling misunderstood by the news media (63% say this), though whether they lean to the Republican or Democratic Party has a strong influence. Independents who lean to the Republican Party are far more likely to feel misunderstood than those who lean Democratic (80% vs. 51%, respectively, say they feel misunderstood by the news media).

The deep divides between Republicans and Democrats in feeling misunderstood by news organizations is largely in line with partisan divides in trust in national media and perceived fairness in news coverage. As seen in previous findings, Republicans are far less likely than Democrats to say they have a lot of trust in the information they get from national news organizations and are more likely to think the news media tend to favor one side.

יום ראשון, 20 בינואר 2019

Facebook Algorithms and Personal Data


About half of Facebook users say they are not comfortable when they see how the platform categorizes them, and 27% maintain the site's classifications do not accurately represent them


Most commercial sites, from social media platforms to news outlets to online retailers, collect a wide variety of data about their users’ behaviors. Platforms use this data to deliver content and recommendations based on users’ interests and traits, and to allow advertisers to target ads to relatively precise segments of the public. But how well do Americans understand these algorithm-driven classification systems, and how much do they think their lives line up with what gets reported about them? As a window into this hard-to-study phenomenon, a new Pew Research Center survey asked a representative sample of users of the nation’s most popular social media platform, Facebook, to reflect on the data that had been collected about them. (See more about why we study Facebook in the box below.)

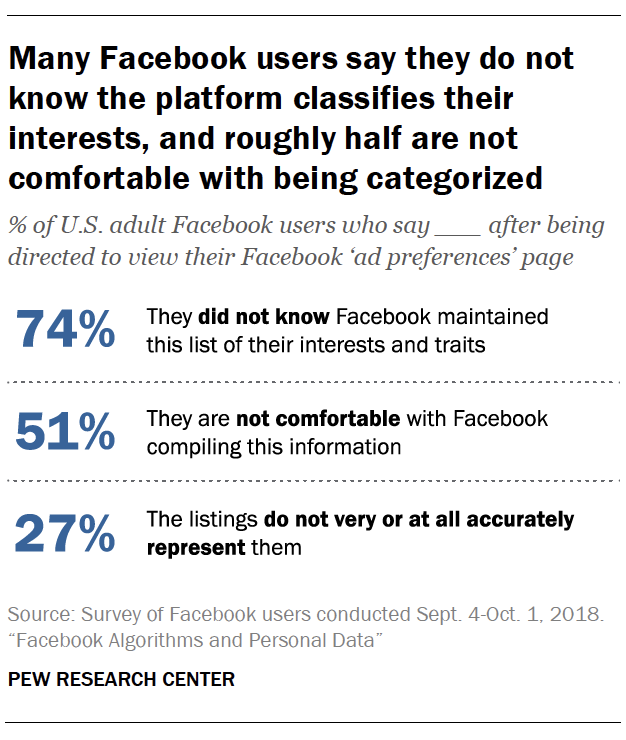
Facebook makes it relatively easy for users to find out how the site’s algorithm has categorized their interests via a “Your ad preferences” page.1 Overall, however, 74% of Facebook users say they did not know that this list of their traits and interests existed until they were directed to their page as part of this study.

When directed to the “ad preferences” page, the large majority of Facebook users (88%) found that the site had generated some material for them. A majority of users (59%) say these categories reflect their real-life interests, while 27% say they are not very or not at all accurate in describing them. And once shown how the platform classifies their interests, roughly half of Facebook users (51%) say they are not comfortable that the company created such a list.

The survey also asked targeted questions about two of the specific listings that are part of Facebook’s classification system: users’ political leanings, and their racial and ethnic “affinities.”

In both cases, more Facebook users say the site’s categorization of them is accurate than say it is inaccurate. At the same time, the findings show that portions of users think Facebook’s listings for them are not on the mark.

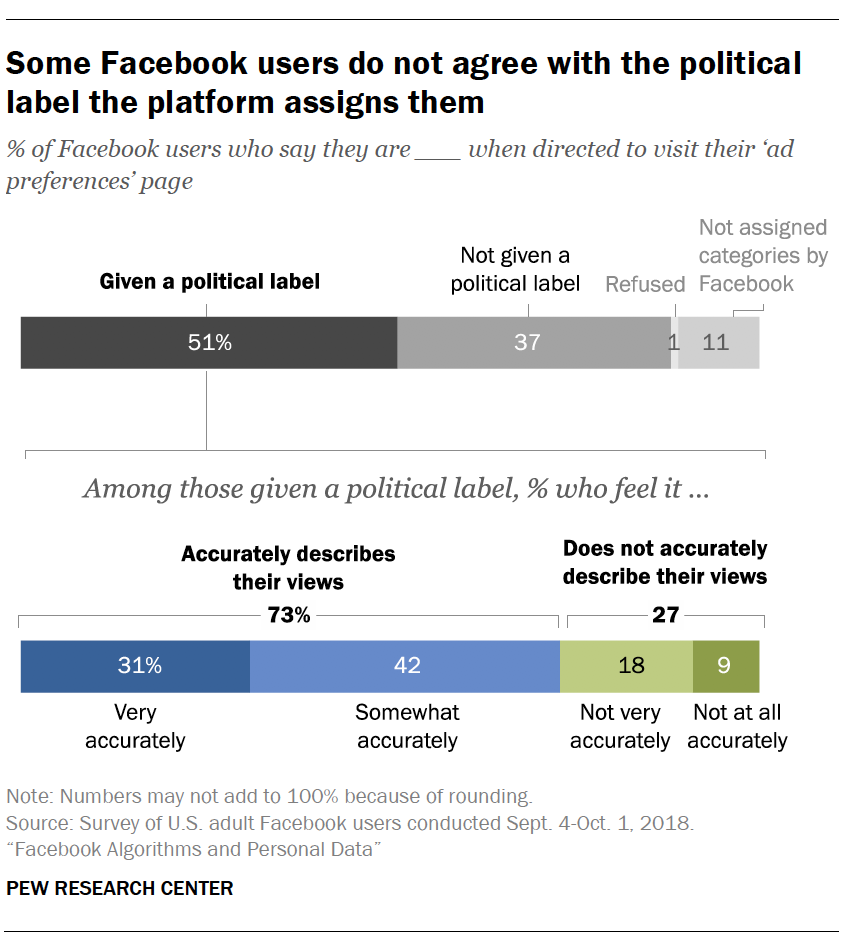
When it comes to politics, about half of Facebook users (51%) are assigned a political “affinity” by the site. Among those who are assigned a political category by the site, 73% say the platform’s categorization of their politics is very or somewhat accurate, while 27% say it describes them not very or not at all accurately. Put differently, 37% of Facebook users are both assigned a political affinity and say that affinity describes them well, while 14% are both assigned a category and say it does not represent them accurately.

For some users, Facebook also lists a category called “multicultural affinity.” According to third-party online courses about how to target ads on Facebook, this listing is meant to designate a user’s “affinity” with various racial and ethnic groups, rather than assign them to groups reflecting their actual race or ethnic background. Only about a fifth of Facebook users (21%) say they are listed as having a “multicultural affinity.” Overall, 60% of users who are assigned a multicultural affinity category say they do in fact have a very or somewhat strong affinity for the group to which they are assigned, while 37% say their affinity for that group is not particularly strong. Some 57% of those who are assigned to this category say they do in fact consider themselves to be a member of the racial or ethnic group to which Facebook assigned them.

These are among the findings from a survey of a nationally representative sample of 963 U.S. Facebook users ages 18 and older conducted Sept. 4 to Oct. 1, 2018, on GfK’s KnowledgePanel.

A second survey of a representative sample of all U.S. adults who use social media – including Facebook and other platforms like Twitter and Instagram – using Pew Research Center’s American Trends Panel gives broader context to the insights from the Facebook-specific study.

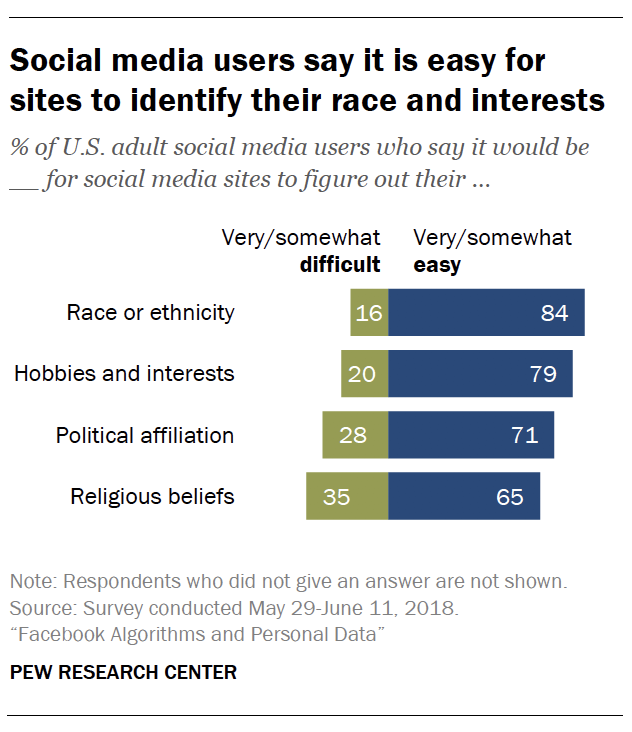
This second survey, conducted May 29 to June 11, 2018, reveals that social media users generally believe it would be relatively easy for the platforms they use to determine key traits about them based on the data they have amassed about their behaviors. Majorities of social media users say it would be very or somewhat easy for these platforms to determine their race or ethnicity (84%), their hobbies and interests (79%), their political affiliation (71%) or their religious beliefs (65%). Some 28% of social media users believe it would be difficult for these platforms to figure out their political views, nearly matching the share of Facebook users who are assigned a political listing but believe that listing is not very or not at all accurately.

Why we study Facebook

Pew Research Center chose to study Facebook for this research on public attitudes about digital tracking systems and algorithms for a number of reasons. For one, the platform is used by a considerably bigger number of Americans than other popular social media platforms like Twitter and Instagram. Indeed, its global user base is bigger than the population of many countries. Facebook is the third most trafficked website in the world and fourth most in the United States. Along with Google, Facebook dominates the digital advertising market, and the firm itself elaborately documents how advertisers can micro-target audience segments. In addition, the Center’s studies have shown that Facebook holds a special and meaningful place in the social and civic universe of its users.

The company allows users to view at least a partial compilation of how it classifies them on the page called “Your ad preferences.” It is relatively simple to find this page, which allows researchers to direct Facebook users to their preferences page and ask them about what they see.

Users can find their own preferences page by following the directions in the Methodology section of this report. They can opt out of being categorized this way for ad targeting, but they will still get other kinds of less-targeted ads on Facebook.
Most Facebook users say they are assigned categories on their ad preferences page

A substantial share of websites and apps track how people use digital services, and they use that data to deliver services, content or advertising targeted to those with specific interests or traits. Typically, the precise workings of the proprietary algorithms that perform these analyses are unknowable outside the companies who use them. At the same time, it is clear the process of algorithmically assessing users and their interests involves a lot of informed guesswork about the meaning of a user’s activities and how those activities add up to elements of a user’s identity.

Facebook, the most prominent social network in the world, analyzes scores of different dimensions of its users’ lives that advertisers are then invited to target. The company allows users to view at least a partial compilation of how it classifies them on the page called “Your ad preferences.” The page, which is different for each user, displays several types of personal information about the individual user, including “your categories” – a list of a user’s purported interests crafted by Facebook’s algorithm. The categorization system takes into account data provided by users to the site and their engagement with content on the site, such as the material they have posted, liked, commented on and shared.

These categories might also include insights Facebook has gathered from a user’s online behavior outside of the Facebook platform. Millions of companies and organizations around the world have activated the Facebook pixel on their websites. The Facebook pixel records the activity of Facebook users on these websites and passes this data back to Facebook. This information then allows the companies and organizations who have activated the pixel to better target advertising to their website users who also use the Facebook platform. Beyond that, Facebook has a tool allowing advertisers to link offline conversions and purchases to users – that is, track the offline activity of users after they saw or clicked on a Facebook ad – and find audiences similar to people who have converted offline. (Users can opt out of having their information used by this targeting feature.)

Overall, the array of information can cover users’ demographics, social networks and relationships, political leanings, life events, food preferences, hobbies, entertainment interests and the digital devices they use. Advertisers can select from these categories to target groups of users for their messages. The existence of this material on the Facebook profile for each user allows researchers to work with Facebook users to explore their own digital portrait as constructed by Facebook.

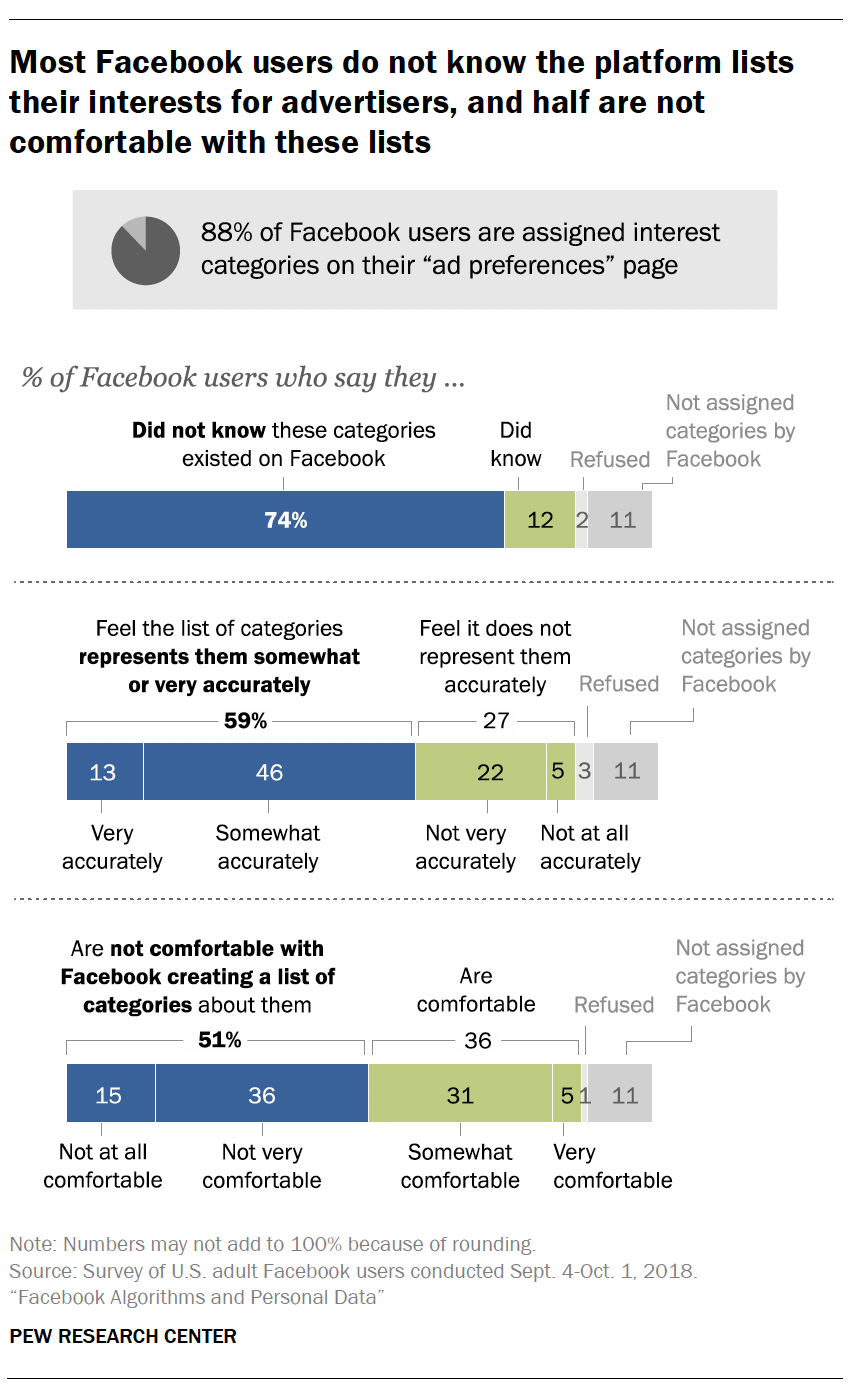
The Center’s representative sample of American Facebook users finds that 88% say they are assigned categories in this system, while 11% say that after they are directed to their ad preferences page they get a message saying, “You have no behaviors.”

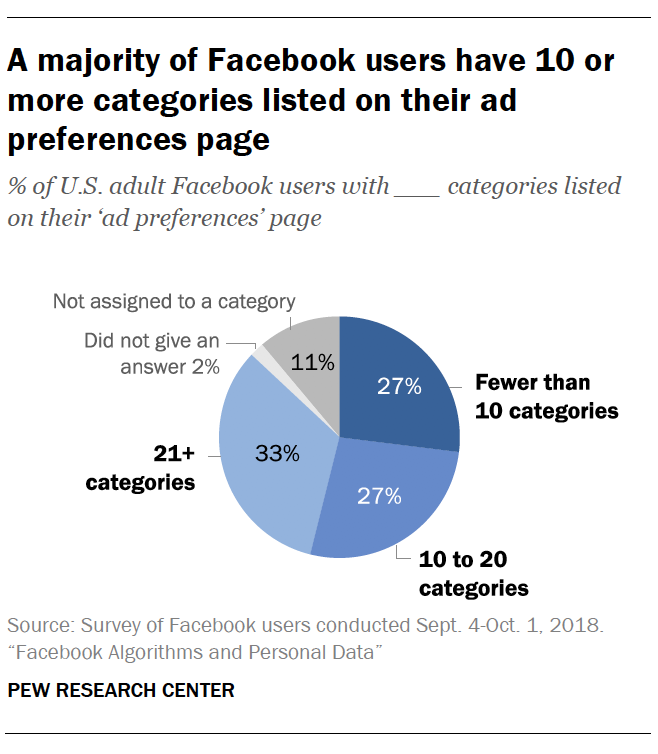
Some six-in-ten Facebook users report their preferences page lists either 10 to 20 (27%) or 21 or more (33%) categories for them, while 27% note their list contains fewer than 10 categories.

Those who are heavier users of Facebook and those who have used the site the longest are more likely to be listed in a larger number of personal interest categories. Some 40% of those who use the platform multiple times a day are listed in 21 or more categories, compared with 16% of those who are less-than-daily users. Similarly, those who have been using Facebook for 10 years or longer are more than twice as likely as those with less than five years of experience to be listed in 21 or more categories (48% vs. 22%).
74% of Facebook users say they did not know about the platform’s list of their interests

About three-quarters of Facebook users (74%) say they did not know this list of categories existed on Facebook before being directed to the page in the Center’s survey, while 12% say they were aware of it.2 Put differently, 84% of those who reported that Facebook had categorized their interests did not know about it until they were directed to their ad preferences page.

When asked how accurately they feel the list represents them and their interests, 59% of Facebook users say the list very (13%) or somewhat (46%) accurately reflects their interests. Meanwhile, 27% of Facebook users say the list not very (22%) or not at all accurately (5%) represents them.

Yet even with a majority of users noting that Facebook at least somewhat accurately assesses their interests, about half of users (51%) say they are not very or not at all comfortable with Facebook creating this list about their interests and traits. This means that 58% of those whom Facebook categorizes are not generally comfortable with that process. Conversely, 5% of Facebook users say they are very comfortable with the company creating this list and another 31% declare they are somewhat comfortable.

There is clear interplay between users’ comfort with the Facebook traits-assignment process and the accuracy they attribute to the process. About three-quarters of those who feel the listings for them are not very or not at all accurate (78%) say they are uncomfortable with lists being created about them, compared with 48% of those who feel their listing is accurate.
Facebook’s political and ‘racial affinity’ labels do not always match users’ views

It is relatively common for Facebook to assign political labels to its users. Roughly half (51%) of those in this survey are given such a label. Those assigned a political label are roughly equally divided between those classified as liberal or very liberal (34%), conservative or very conservative (35%) and moderate (29%).

Among those who are assigned a label on their political views, close to three-quarters (73%) say the listing very accurately or somewhat accurately describes their views. Meanwhile, 27% of those given political classifications by Facebook say that label is not very or not at all accurate.

There is some variance between what users say about their political ideology and what Facebook attributes to them.3 Specifically, self-described moderate Facebook users are more likely than others to say they are not classified accurately. Among those assigned a political category, some 20% of self-described liberals and 25% of those who describe themselves as conservative say they are not described well by the labels Facebook assigns to them. But that share rises to 36% among self-described moderates.

In addition to categorizing users’ political views, Facebook’s algorithm assigns some users to groups by “multicultural affinity,” which the firm says it assigns to people whose Facebook activity “aligns with” certain cultures. About one-in-five Facebook users (21%) say they are assigned such an affinity.

The use of multicultural affinity as a tool for advertisers to exclude certain groups has created controversies. Following pressure from Congress and investigations by ProPublica, Facebook signed an agreement in July 2018 with the Washington State Attorney General saying it would no longer let advertisers unlawfully exclude users by race, religion, sexual orientation and other protected classes.

In this survey, 43% of those given an affinity designation are said by Facebook’s algorithm to have an interest in African American culture, and the same share (43%) is assigned an affinity with Hispanic culture. One-in-ten are assigned an affinity with Asian American culture. Facebook’s detailed targeting tool for ads does not offer affinity classifications for any other cultures in the U.S., including Caucasian or white culture.

Of those assigned a multicultural affinity, 60% say they have a “very” or “somewhat” strong affinity for the group they were assigned, compared with 37% who say they do not have a strong affinity or interest.4 And 57% of those assigned a group say they consider themselves to be a member of that group, while 39% say they are not members of that group.

Rubén Weinsteiner

יום חמישי, 17 בינואר 2019

Generation Z Looks a Lot Like Millennials on Key Social and Political Issues


Ruben Weinsteiner

Rubén Weinsteiner

Among Republicans, Gen Z stands out in views on race, climate and the role of government


No longer the new kids on the block, Millennials have moved firmly into their 20s and 30s, and a new generation is coming into focus. Generation Z – diverse and on track to be the most well-educated generation yet – is moving toward adulthood with a liberal set of attitudes and an openness to emerging social trends.

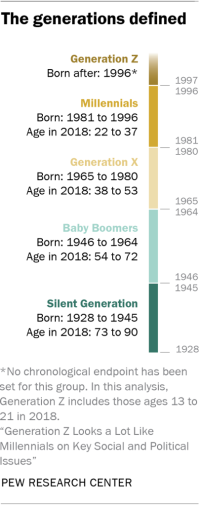
On a range of issues, from Donald Trump’s presidency to the role of government to racial equality and climate change, the views of Gen Z – those ages 13 to 21 in 2018 – mirror those of Millennials.1 In each of these realms, the two younger generations hold views that differ significantly from those of their older counterparts. In most cases, members of the Silent Generation are at the opposite end, and Baby Boomers and Gen Xers fall in between.2

It’s too early to say with certainty how the views of this new generation will evolve. Most have yet to reach voting age, and their outlook could be altered considerably by changing national conditions, world events or technological innovations. Even so, two new Pew Research Center surveys, one of U.S. teens ages 13 to 17 and one of adults ages 18 and older, provide some compelling clues about where they may be headed and how their views could impact the nation’s political landscape.
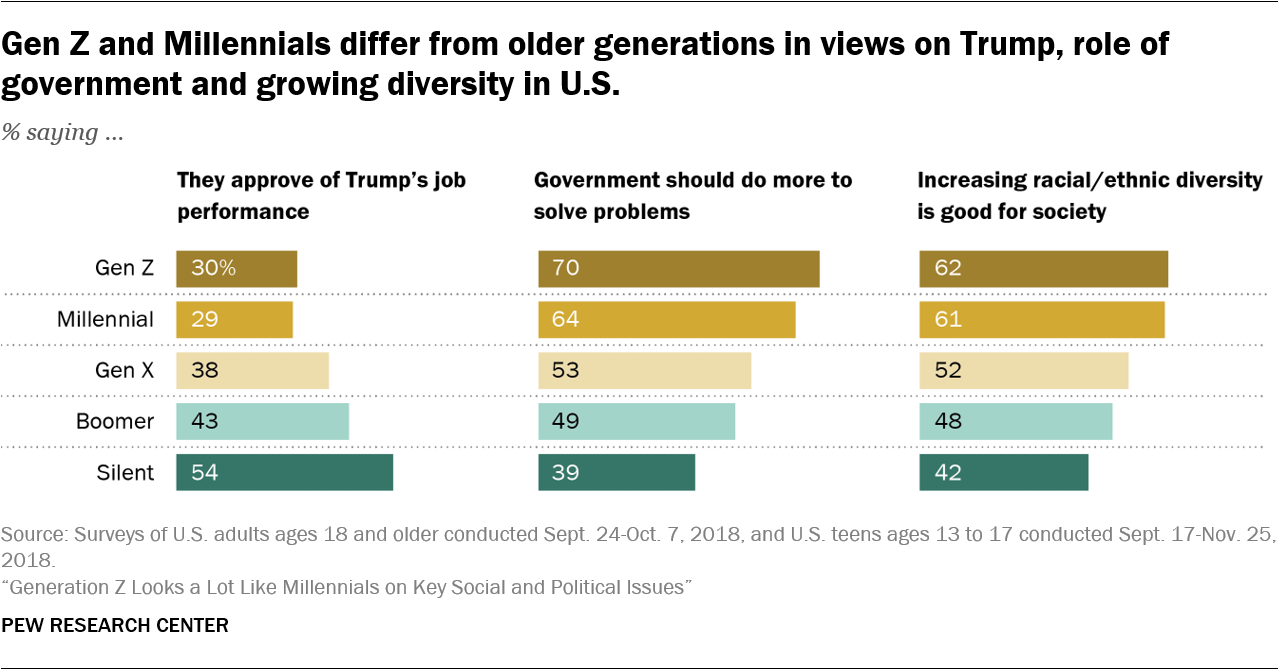
Only about three-in-ten Gen Zers and Millennials (30% and 29%, respectively) approve of the way Donald Trump is handling his job as president. This compares with 38% of Gen Xers, 43% of Boomers and 54% of Silents. Similarly, while majorities in Gen Z and the Millennial generation say government should do more to solve problems, rather than that government is doing too many things better left to businesses and individuals, Gen Xers and Boomers are more evenly divided on this issue. For their part, most Silents would like to see a less activist government.

When it comes to views on race, the two younger generations are more likely than older generations to say that blacks are treated less fairly than whites in the United States today. And they are much more likely than their elders to approve of NFL players kneeling during the national anthem as a sign of protest.

The younger generations are also more accepting of some of the ways in which American society is changing. Majorities among Gen Z and the Millennial generation say increasing racial and ethnic diversity in the U.S. is a good thing for society, while older generations are less convinced of this. And they’re more likely to have a positive view of interracial and same-sex marriage than their older counterparts.

As a recent Pew Research Center report highlighted, Gen Z is the most racially and ethnically diverse generation we have seen, but this isn’t all that’s driving the attitudes of this generation when it comes to issues surrounding race and diversity. There are significant, if more modest, generational differences on these issues even among non-Hispanic whites.
Roughly a third of Gen Zers know someone who uses gender-neutral pronouns
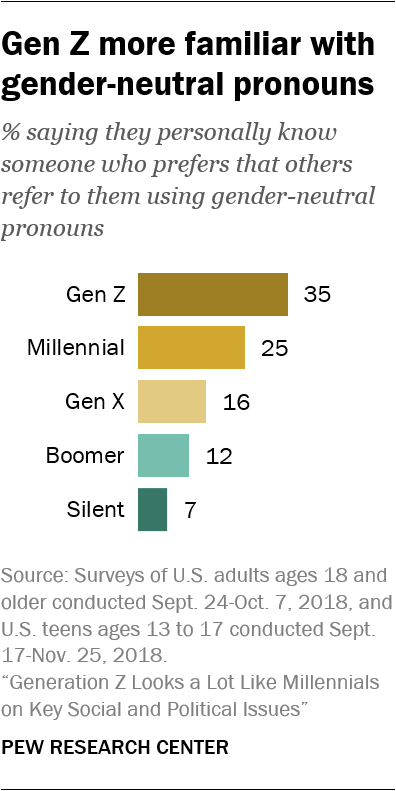
While Generation Z’s views resemble those of Millennials in many areas, Gen Zers are distinct from Millennials and older generations in at least two ways, both of which reflect the cultural context in which they are coming of age. Gen Zers are more likely than Millennials to say they know someone who prefers that others use gender-neutral pronouns to refer to them: 35% say this is the case, compared with a quarter of Millennials. Among each older generation, the share saying this drops: 16% of Gen Xers, 12% of Boomers and just 7% of Silents say this.

The youngest generation is also the most likely to say forms or online profiles that ask about a person’s gender should include options other than “man” or “woman.” Roughly six-in-ten Gen Zers (59%) hold this view, compared with half of Millennials and four-in-ten or fewer Gen Xers, Boomers and Silents.

These findings seem to speak more to exposure than to viewpoint, as roughly equal shares of Gen Zers and Millennials say society should be more accepting of people who don’t identify as either a man or a woman.

Members of Gen Z also stand out somewhat in their views on the role social media plays in modern news consumption. These teens and young adults are much less likely than older generations to say the fact that more people are getting their news from social media is a bad thing for society – 39% of Gen Zers hold this view, compared with about half among each of the older generations.
Among Republicans, Gen Z stands out on some key issues

While they are young and their political views may not be fully formed, there are signs that those in Generation Z who identify as Republican or lean to the Republican Party diverge somewhat from older Republicans – even Millennials – in their views on several key issues. These same generational divides are not as apparent among Democrats.
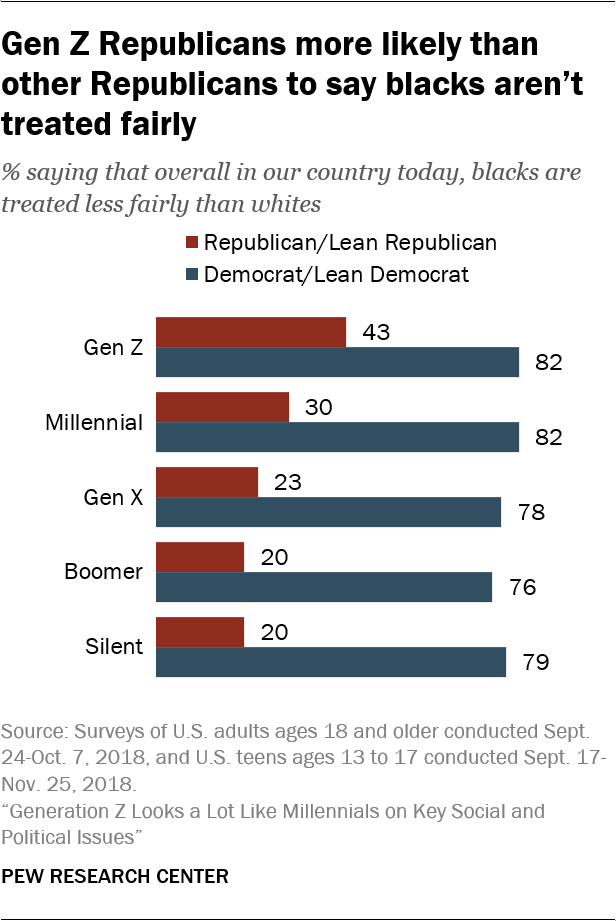
On views about race relations, Gen Z Republicans are more likely than older generations of Republicans to say that blacks are treated less fairly than whites. Among Republicans, 43% of Gen Zers say this, compared with 30% of Millennials and roughly 20% of Gen Xers, Boomers and Silents. Gen Z Republicans are also much more likely than their GOP counterparts in older generations to say increasing racial and ethnic diversity in the U.S. is a good thing for society. On each of these measures, Democrats’ views are nearly uniform across generations.

In addition, the youngest Republicans stand apart in their views on the role of government and the causes of climate change. Gen Z Republicans are much more likely than Republicans in older generations to say government should do more to solve problems. And they are less likely than their older counterparts to attribute the earth’s warming temperatures to natural patterns, as opposed to human activity.

While younger and older Americans differ in many of their views, there are some areas where generation is not as clearly linked with attitudes. When it comes to the merits of having more women running for political office, majorities across generations say this is a good thing for the country. Majorities in each generation also say that, on balance, legal immigrants have had a positive impact on the U.S.

This analysis is based on a survey of 920 U.S. teens ages 13 to 17 conducted online Sept. 17-Nov. 25, 2018, combined with a nationally representative survey of 10,682 adults ages 18 and older conducted online Sept. 24-Oct. 7, 2018, using Pew Research Center’s American Trends Panel.3 Findings based on Generation Z combine data from the teens survey with data from the 18- to 21-year-old respondents in the adult survey.
Gen Zers and Millennials share views on politics and policy; large generational gaps among Republicans

When it comes to views on political issues and the current political climate, younger generations have consistently held more liberal views than older generations in recent years. Today, members of Generation Z hold many similar views to Millennials, and both tend to be more liberal than older generations.
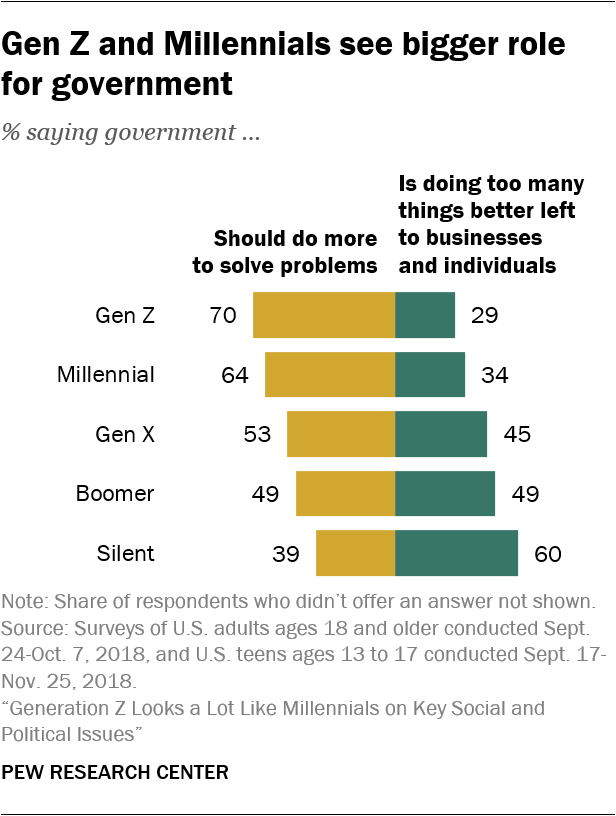
Seven-in-ten Gen Zers say the government should do more to solve problems in this country, while just 29% say the government is doing too many things that are better left to individuals and businesses. Gen Zers are slightly more likely to favor government activism than Millennials, and significantly more likely than older generations: 53% of Gen Xers, 49% of Baby Boomers and 39% of Silents favor government involvement over businesses and individuals.

Among Republicans and those who lean to the Republican Party, the generational divides are even starker. Roughly half (52%) of Gen Z Republicans say they think the government should be doing more to solve problems, compared with 38% of Millennial Republicans and 29% of Gen Xers. About a quarter of Republican Baby Boomers (23%) and fewer GOP Silents (12%) believe the government should be doing more.

Among Democrats, however, these generational divides largely disappear. Roughly eight-in-ten Gen Z (81%) and Millennial Democrats (79%) say the government should do more to solve problems, as do about seven-in-ten Democratic Gen Xers, Boomers and Silents.
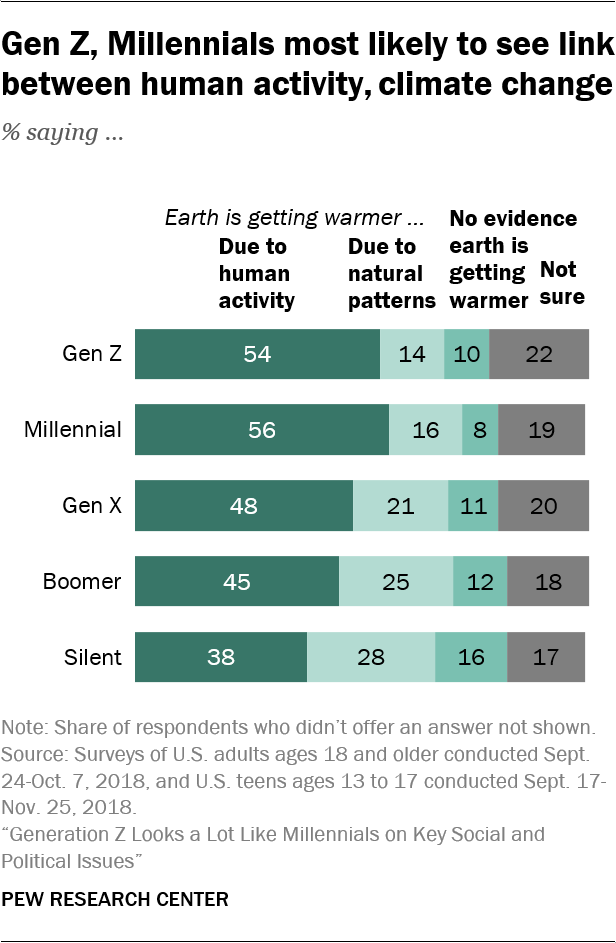
Gen Zers’ views about climate change are virtually identical to those of Millennials and not markedly different from Gen Xers. About half in all three generations say the earth is getting warmer due to human activity. Boomers are somewhat more skeptical of this than Gen Zers or Millennials. Members of the Silent Generation are least likely to say this (38%) and are more likely to say the earth is warming mainly due to natural patterns (28%) than are Gen Zers, Millennials and Gen Xers.

Among Republicans, Gen Z stands out from older generations as the least likely to say the earth is warming because of natural patterns – 18% say this. By comparison, 30% of Millennial, 36% of Gen X and roughly four-in-ten Boomer (42%) and Silent Generation Republicans (41%) say the same. Almost no generation gap exists among Democrats in views on this issue.

When it comes to views of Donald Trump, there are sizable generational divides, particularly among Republicans. Nine-in-ten Republicans in the Silent Generation approve of the job the president is doing, as do 85% of Baby Boomer Republicans and 76% of Gen X Republicans; smaller majorities of GOP Millennials (65%) and Gen Zers (59%) think he’s doing a good job.
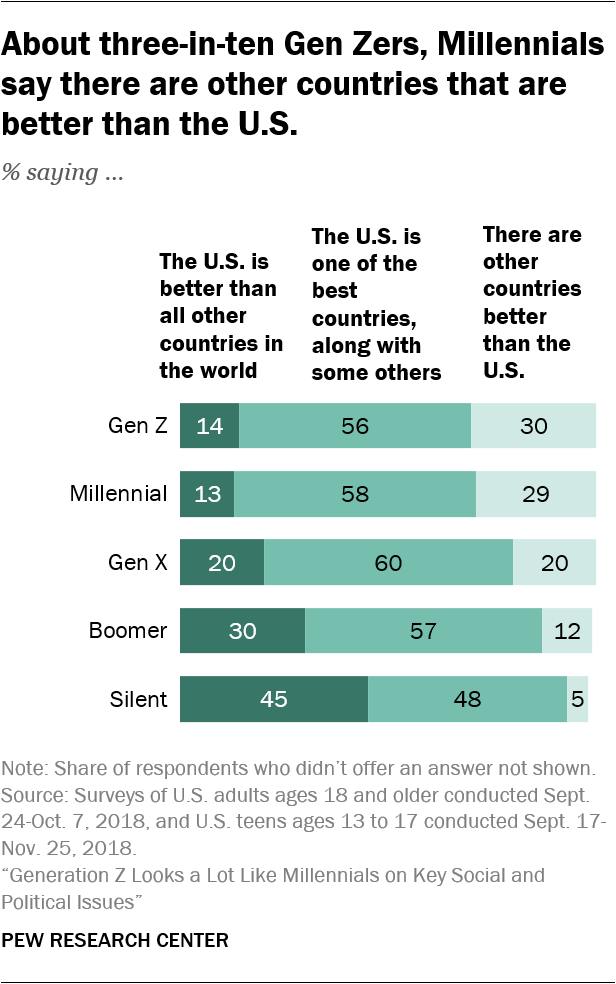
Younger generations also have a different view of the U.S. relative to other countries in the world. While pluralities of nearly all generations (with the exception of the Silent Generation) say the U.S. is one of the best countries in the world along with some others, Gen Zers and Millennials are the least likely to say the U.S. is better than all other countries. Only 14% and 13%, respectively, hold this view, compared with one-in-five Gen Xers, 30% of Boomers and 45% of Silents.

Roughly three-in-ten Gen Zers and Millennials say there are other countries that are better than the U.S.

In their views about the general direction of the country, Gen Zers are mostly downbeat, but they’re not alone in that assessment. Among Gen Zers, Millennials and Gen Xers, two-thirds or more say things in this country are generally going in the wrong direction. About six-in-ten Boomers (61%) say the same. Members of the Silent Generation have a less negative view (53% say things are going in the wrong direction).

Today’s 13- to 21-year-olds are only slightly more likely than Millennials to say ordinary citizens can do a lot to influence the government in Washington (53% of Gen Zers say this vs. 46% of Millennials). And their views on this issue don’t differ much from those of Gen Xers, Boomers or Silents (50%, 58% and 58%, respectively, say citizens can have a lot of influence on the government).
Stark generational gaps in views on race

Younger generations have a different perspective than their older counterparts on the treatment of blacks in the United States. Two-thirds of Gen Z (66%) and 62% of Millennials say blacks are treated less fairly than whites in the U.S. Fewer Gen Xers (53%), Boomers (49%) and Silents (44%) say this. Roughly half of Silents (44%) say both races are treated about equally, compared with just 28% among Gen Z.

The patterns are similar after controlling for race: Younger generations of white Americans are far more likely than whites in older generations to say blacks are not receiving fair treatment.
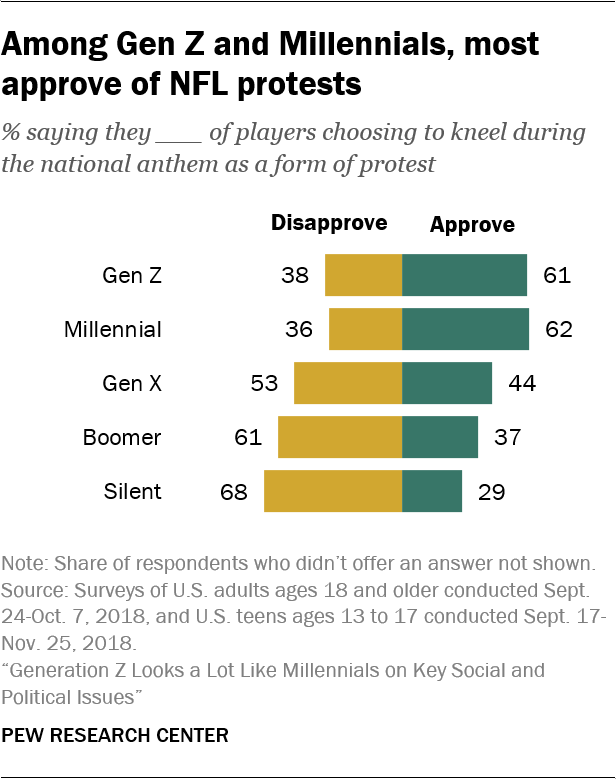
Younger generations also have a different viewpoint on the issue of NFL players kneeling during the national anthem as a protest. Majorities among Gen Z (61%) and the Millennial generation (62%) approve of the protests. Smaller shares of Gen Xers (44%) and Baby Boomers (37%) favor these actions. Members of the Silent Generation disapprove of the protests by a more than two-to-one margin (68% disapprove, 29% approve).
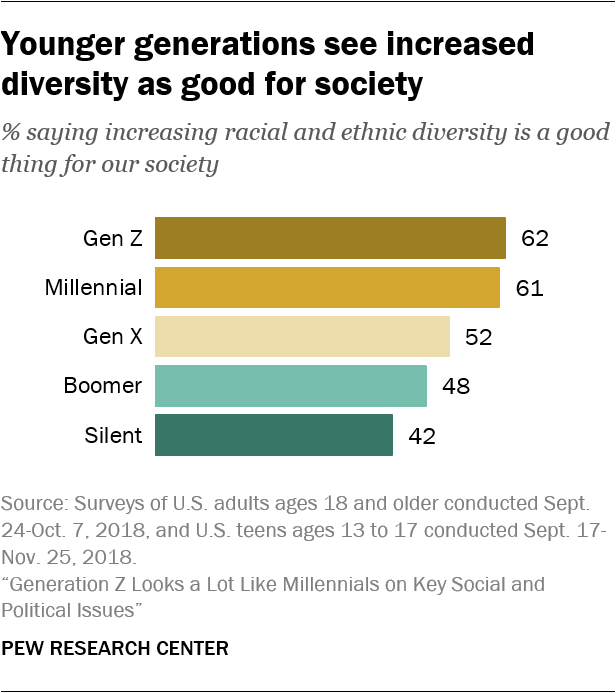
Gen Zers and Millennials share similar views about racial and ethnic change in the country. Roughly six-in-ten from each generation say increased racial and ethnic diversity is a good thing for our society. Gen Xers are somewhat less likely to agree (52% say this is a good thing), and older generations are even less likely to view this positively.

Younger Republicans again stand out in this regard. Half of Gen Z Republicans (51%) say increased racial and ethnic diversity is a good thing for the country. This compares with 38% of Millennial, 34% of Gen X, 30% of Boomer and 28% of Silent Generation Republicans. Among Democrats, there is widespread agreement across generations.

Though they differ in their views over the changing racial and ethnic makeup of the country, across generations most Americans agree about the impact that legal immigrants have on society. On balance, all generations see legal immigration as more positive than negative. Across most generations, Democrats are more likely than Republicans to say legal immigrants are having a positive impact. However, within Gen Z there is no partisan gap on this issue.

When it comes to views about how careful people should be in using potentially offensive language, members of Gen Z are divided over whether people need to be more careful or if concerns about political correctness have gone too far. Some 46% of Gen Zers say people need to be more careful about the language they use to avoid offending people with different backgrounds, while 53% say too many people are easily offended these days over the language that others use.

Gen Zers’ views are only modestly different from those of Millennials and Gen Xers on this topic: 39% and 38%, respectively, say people need to be more careful about the language they use, while about six-in-ten say people are too easily offended these days. Interestingly, members of the Silent Generation are closer to members of Gen Z in their views on this topic than they are to Boomers, Gen Xers or Millennials.
Gen Z and Millennials have similar views on gender and family
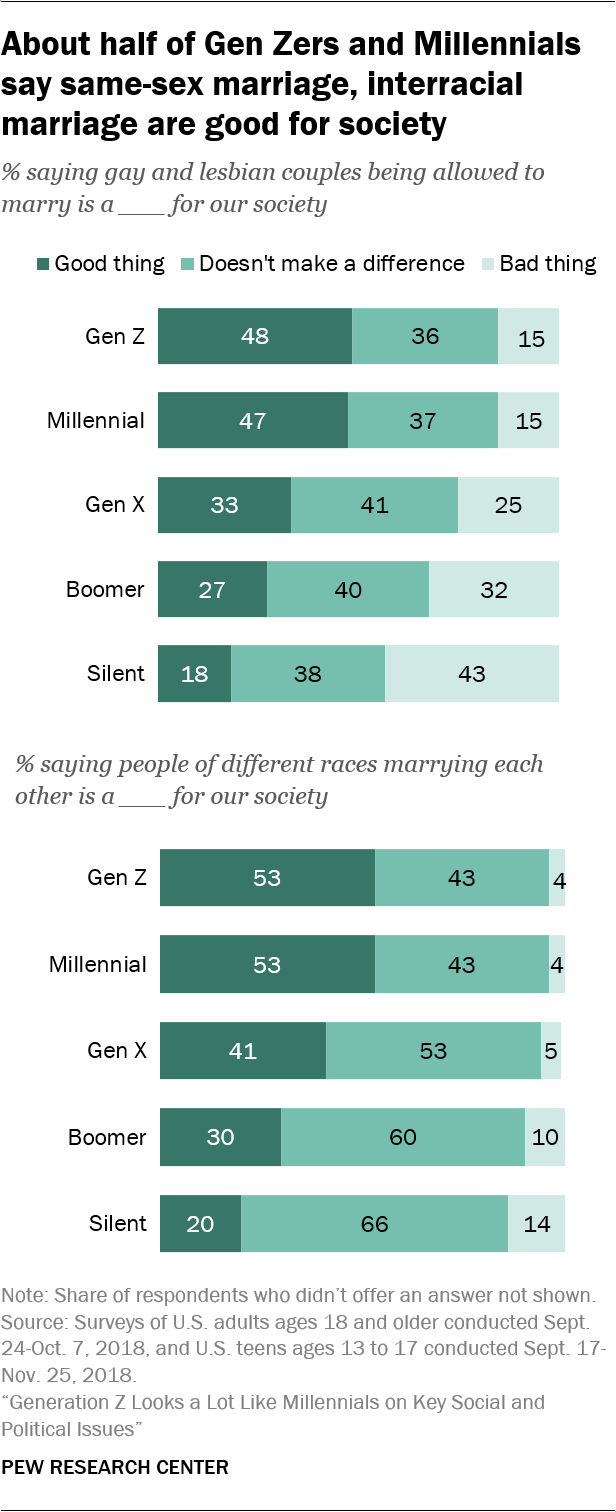
Since they first entered adulthood, Millennials have been at the leading edge of changing views on same-sex marriage. In 2014, when a narrow majority of all adults (52%) said they favored allowing gays and lesbians to marry legally, 67% of Millennials held that view. Today, members of Generation Z are just as likely as Millennials to say allowing gay and lesbian couples to marry has been a good thing for the country (48% of Gen Zers and 47% of Millennials hold this view). One-third of Gen Xers say this is a good thing for the country, as do 27% of Baby Boomers. Members of the Silent Generation are the least enthusiastic (18% say this is a good thing).

Relatively few Gen Zers or Millennials (15%) say same-sex marriage is a bad thing for society. Boomers and Silents are much more likely to view this change negatively (32% and 43%, respectively, say this is a bad thing). Across generations, about four-in-ten say allowing gays and lesbians to marry hasn’t made much of a difference for the U.S.

In other ways, too, Gen Zers and Millennials are similar in their openness to changes that are affecting the institutions of marriage and family. Roughly half (53%) from each generation say interracial marriage is a good thing for our society. Gen Xers are somewhat less likely to agree (41% say this is a good thing), and older generations are much less likely to view interracial marriage positively. Relatively few across generations say this trend is bad for society; majorities of Silents (66%) and Boomers (60%) say it doesn’t make much difference, as do 53% of Xers.

When it comes to couples living together without being married, roughly two-thirds of each generation (with the exception of Silents) say this doesn’t make much of a difference for society. About one-in-five Gen Zers and Millennials say cohabitation is a good thing for society – higher than the shares for older generations. Fully 41% of Silents say this is bad thing for the country, as do about a quarter of Boomers.

Compared with their views on cohabitation, the youngest generations have a more negative assessment of the impact of single women raising children: 35% among Gen Z and 36% of Millennials say this is a bad thing for society; roughly four-in-ten Gen Xers and Boomers and 48% of Silents say the same. About half of Gen Zers and Millennials say this doesn’t make much difference for society, while relatively few (15%) view it as a good thing.
Across generations, majorities say financial and child care responsibilities should be shared

In their views about gender roles within couples, members of Generation Z are virtually identical to Millennials and Gen Xers and quite similar to Baby Boomers. Large majorities in all four groups say that, in households with a mother and a father, the responsibility for providing for the family financially should be shared equally. About one-in-five Gen Zers, Millennials and Gen Xers – and a quarter of Boomers – say this responsibility should fall primarily on the fathers. Very few say mothers should be mostly responsible for this. Silents are the outliers on this issue: 40% say fathers should be mostly responsible for providing for their families financially, while 58% say this responsibility should be shared between mothers and fathers.

For the most part, there are no notable gender gaps in views on this issue; the Silent Generation is the exception. Among Gen Zers, Millennials, Gen Xers and Boomers, male and female respondents are largely in agreement that mothers and fathers should share family financial responsibility. Among members of the Silent Generation, roughly half of men (49%) but 33% of women say fathers should be mostly responsible for providing for the family financially.

Large majorities (84% or more) across generations say that responsibility for taking care of children should be shared by mothers and fathers in households with two parents. Some 13% among Gen Z say this responsibility should fall mainly to mothers; similar shares of each of the other generations say the same. Very few say raising children should fall mostly to dads. Male and female respondents across generations have similar views on this issue.
Widespread enthusiasm across generations for more women entering politics
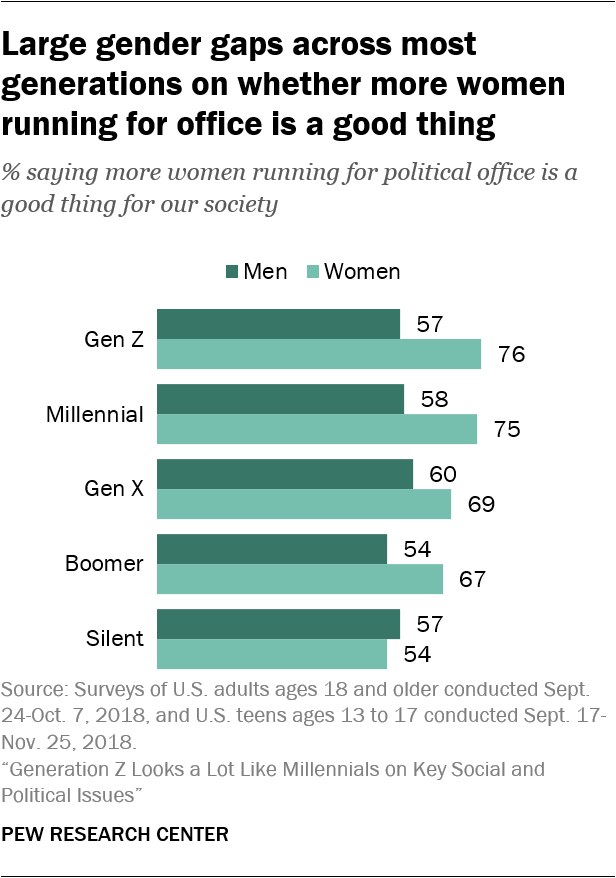
A majority of Americans, regardless of generation, view the increasing number of women running for public office as a positive change for our society. Roughly two-thirds of Gen Zers, Millennials and Gen Xers say this is a good thing, as do 61% of Boomers and 55% of Silents. About four-in-ten in the Silent Generation (39%) say this trend doesn’t make much difference for society, somewhat higher than the share among the three youngest generations (roughly three-in-ten).

There are significant gender gaps on this question, with female respondents expressing much more enthusiasm about the growing number of women running for office in each generation except the Silents. Among Gen Zers, 76% of young women, versus 57% of young men, say the fact that more women are running for office is a good thing for society. The pattern is similar for Millennials, Gen Xers and Boomers. However, among Silents, roughly equal shares of men (57%) and women (54%) say this is a good thing.
Gen Zers most likely to say forms or online profiles should offer gender options beyond ‘man’ and ‘woman’

The recognition of people who don’t identify as a man or a woman has garnered increased attention amid changing laws concerning gender options on official documents and growing usage of gender-neutral pronouns.

There are stark generational differences in views on these issues. Generation Z is the most likely of the five generations to say that when a form or online profile asks about a person’s gender it should include options other than “man” and “woman”; a 59% majority of Gen Zers say this. Half of Millennials say forms or online profiles should include additional gender options, as do about four-in-ten Gen Xers (40%) and Boomers (37%) and roughly a third of those in the Silent Generation (32%).

These views vary widely along partisan lines, with generational differences evident within each party coalition, but sharpest among Republicans and Republican-leaning independents. About four-in-ten Republican Gen Zers (41%) think forms should include other gender options, compared with 27% of Republican Millennials, 17% of GOP Gen Xers and Boomers and 16% of Republican Silents. Among Democrats and Democratic leaners, half or more in all generations say this, including 71% of Gen Zers and 55% of Silents.
Gen Zers and Millennials have similar views on treatment of people who don’t identify as a man or woman

When it comes to how accepting society in general is of people who don’t identify as either a man or a woman, the views of Gen Zers and Millennials differ from those of older generations. Roughly half of Gen Zers (50%) and Millennials (47%) think that society is not accepting enough. Smaller shares of Gen Xers (39%), Boomers (36%) and those in the Silent Generation (32%) say the same.

A plurality of the Silent Generation (41%) say society is too accepting of people who don’t identify as a man or woman. Across all generations, roughly a quarter say society’s acceptance level is about right.

Again, there are large partisan gaps on this question, and Gen Z Republicans stand apart to some extent from other generations of Republicans in their views. Among Republicans, about three-in-ten Gen Zers (28%) say that society is not accepting enough of people who don’t identify as a man or woman, compared with 20% of Millennials, 15% of Gen Xers, 13% of Boomers and 11% of Silents. Democrats vary little by generation in shares holding this view.
Generations differ in their familiarity and comfort with using gender-neutral pronouns
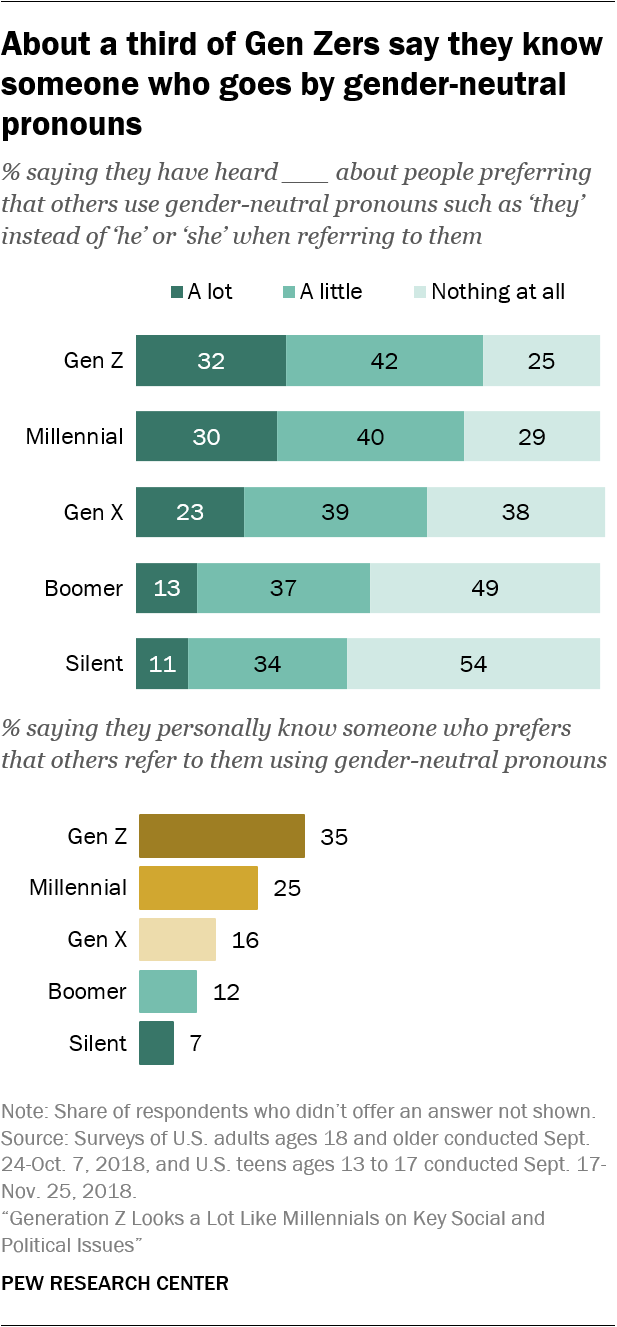
Gen Zers and Millennials are much more familiar than their elders with the idea that some people may prefer gender-neutral pronouns: 74% of Gen Zers and 69% of Millennials say they have heard “a lot” or “a little” about people preferring that others use gender-neutral pronouns such as “they” instead of “he” or “she” when referring to them, with about three-in-ten saying they have heard a lot about this. Most Gen Xers (62%) also have heard a lot or a little about people preferring gender-neutral pronouns.

There is less awareness of this among older generations. Still, half of Boomers and 45% of Silents say they have heard at least a little about gender-neutral pronouns.

Gen Zers are also the most likely among the five generations to say they personally know someone who goes by gender-neutral pronouns, with 35% saying so, compared with 25% of Millennials. Each of these younger generations is more likely than Gen Xers (16%), Boomers (12%) and Silents (7%) to say they personally know someone who prefers that others use gender-neutral pronouns when referring to them. This generational pattern is evident among both Democrats and Republicans.
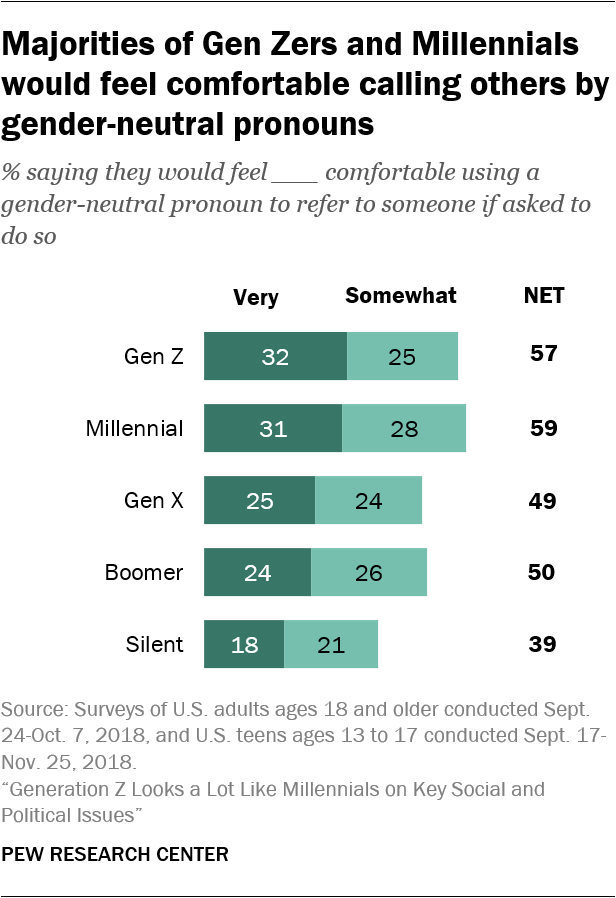
In addition to their greater familiarity with gender-neutral pronouns, Gen Zers and Millennials express somewhat higher levels of comfort with using gender-neutral pronouns, though generational differences on this question are more modest. Majorities of Gen Zers (57%) and Millennials (59%) say they would feel “very” or “somewhat” comfortable using a gender-neutral pronoun to refer to someone if asked to do so, including about three-in-ten (32% of Gen Zers, 31% of Millennials) who say they would be very comfortable doing this. By comparison, Gen Xers and Boomers are evenly divided: About as many say they would feel at least somewhat comfortable (49% and 50%, respectively) as say they would be uncomfortable.

Silents are the only group in which more say they would feel uncomfortable (59%) than say they would feel comfortable (39%) using a gender-neutral pronoun to refer to someone.

There are wide party gaps on this measure across generations. Within each generation, Democrats come down on the side of feeling comfortable, rather than uncomfortable, using a gender-neutral pronoun to refer to someone if asked to do so. In contrast, for each generation of Republicans, majorities say they would feel uncomfortable doing this.

Across generations, knowing someone who goes by gender-neutral pronouns is linked to comfort levels in using these pronouns. Three-quarters of Millennials and about two-thirds of Gen Zers, Gen Xers and Boomers who personally know someone who goes by gender-neutral pronouns say they would feel very or somewhat comfortable referring to someone with a gender-neutral pronoun. Those who don’t know someone are roughly 20 percentage points less likely to say the same (51% of Gen Zers, 54% of Millennials, 46% of Gen Xers and 48% of Boomers who don’t know someone say this).
Ruben Weinsteiner

יום שני, 14 בינואר 2019

How Americans see illegal immigration, the border wall and political compromise

A Border Patrol officer makes his rounds near central El Paso, Texas, on Dec. 23, 2018. Parts of the federal government had shut down amid a debate in Washington over illegal immigration. (Paul Ratje/AFP/Getty Images)

A standoff between President Donald Trump and Democratic congressional leaders over how to address unauthorized immigration at the U.S.-Mexico border has led to a partial shutdown of the federal government – one that soon could become the longest on record.

The United States was home to 10.7 million unauthorized immigrants in 2016, a 13% decline from a peak of 12.2 million in 2007, according to the most recent Pew Research Center estimates. This decade-long decline was driven almost entirely by a decrease in unauthorized immigrants from Mexico, even as the numbers from El Salvador, Guatemala and Honduras increased. Meanwhile, a growing share of unauthorized immigrants were not people who had entered the country illegally, but had arrived legally and then overstayed their visas.

More recent data from the federal government show that 2018 saw an uptick in border apprehensions (which are often used as a proxy measure for unlawful entries). There were nearly 416,000 apprehensions at the Southwest border between January and November last year, the most in any January-November period since 2014. Still, the number of apprehensions in 2018 remained far below the more than 1 million apprehensions per year routinely recorded during the 1980s, 1990s and 2000s.

As Trump and Democrats press their cases about ways to end the government shutdown, here’s a look at how Americans see illegal immigration – as well as their views toward the border wall and how much political leaders should be open to compromise:

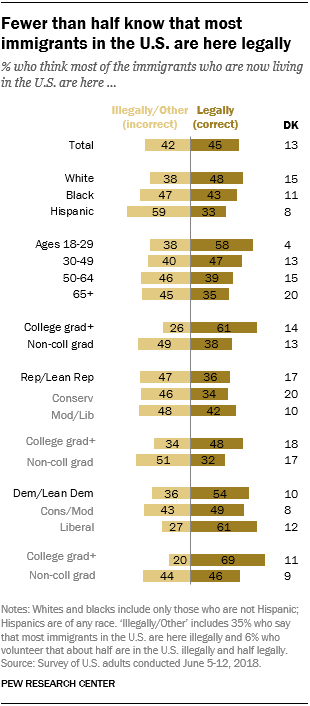
1The vast majority of immigrants in the U.S. are in the country legally – but fewer than half of Americans know that’s the case. Lawful immigrants accounted for about three-quarters (76%) of all immigrants in the U.S. in 2016. But in a survey conducted in June 2018, only 45% of Americans correctly said most immigrants are in the country legally. Around a third of U.S. adults (35%) incorrectly said that most immigrants are in the country illegally, while 6% said about half of all immigrants are here illegally and half legally. Another 13% did not provide a response.

2Republican and Democratic voters sharply disagree over whether illegal immigration is a major problem in the U.S. today. In a survey conducted ahead of last year’s midterm elections, three-quarters of registered voters who planned to support the GOP candidate in their congressional district said illegal immigration was a very big problem in the country, versus just 19% among voters who planned to support their Democratic candidate for Congress.


3A majority of Americans (56%) oppose substantially expanding the wall along the U.S.-Mexico border – as Trump has sought – while 40% support doing so, according to a June 2018 survey by the Center. Attitudes diverge sharply by party: Nearly three-quarters of Republicans and Republican-leaning independents (74%) support expanding the wall, while an even larger share of Democrats and Democratic leaners (83%) oppose it.

4Proximity to the Mexican border is a factor in Republicans’ views of a border wall. Republicans overwhelmingly favor building a wall along the entire border, but Republicans who live closer to the border are somewhat less likely to favor it, according to an analysis by the Center based on February 2017 survey data. The analysis found that 63% of Republicans who live within 350 miles of the border favor a wall along the entire border, compared with 74% of Republicans overall. Among Democrats, opposition to a wall is overwhelming regardless of their distance from the border.

5Disagreement between partisans extends to the effects of a wall. Around six-in-ten Republicans (58%) said in the February 2017 survey that a wall along the entire U.S. border with Mexico would lead to a major reduction in illegal immigration into the country. An even larger share of Democrats (65%) said it would not have much impact.

6Long before the shutdown began, most Democrats – and nearly half of Republicans – said the U.S. would ultimately pay for a wall. Nearly nine-in-ten Democrats (87%) said in February 2017that the U.S. would end up paying for a wall along the entire U.S. border with Mexico – a view shared by 46% of Republicans. Overall, seven-in-ten U.S. adults said the U.S. would ultimately pay for a wall, while just 16% said Mexico would pay for it.

7Most Americans favor granting permanent legal status to immigrants who came to the U.S. illegally as children. Nearly three-quarters of Americans (73%), including 89% of Democrats and 54% of Republicans, said in June 2018 that they favor such permanent legal status. Recent news reports have indicated that a discussion over legal status for such children may be part of broader negotiations over the federal government shutdown.

8Americans are more inclined to prefer politicians who stick to their positions than those who make compromises with people they disagree with (53% vs. 44%), according to a March 2018 survey. This marked a reversal from July 2017, when nearly six-in-ten Americans (58%) said they preferred politicians who compromised and 39% said they preferred politicians who stick to their positions. In the 2018 survey, there was no difference between Republicans and Democrats in views of compromise. That was a change from the sentiment found in six prior surveys since 2011, in which Democrats were more likely than Republicans to favor politicians who compromised.

9Whatever else they think of him,about two-thirds of Americans (68%) – including around half of Democrats – say Trump stands up for what he believes in, according to a September 2018 survey. Around nine-in-ten Republicans (91%) say Trump stands up for his beliefs, as do 52% of Democrats – a far higher share of Democrats than give the president positive marks on other personal qualities, such as being a strong leader, being well-informed and being trustworthy.

10Most Americans hoped for efforts at cooperation between Trump and Democratic leaders in the current Congress, according to a post-election survey conducted in November. More than eight-in-ten U.S. adults (84%) said Trump should cooperate either a great deal (39%) or a fair amount (45%) with Democratic leaders over the next two years. A smaller majority (65%), however, said Democratic leaders should cooperate with Trump a great deal (28%) or a fair amount (36%).

11% of Americans don’t use the internet. Who are they?

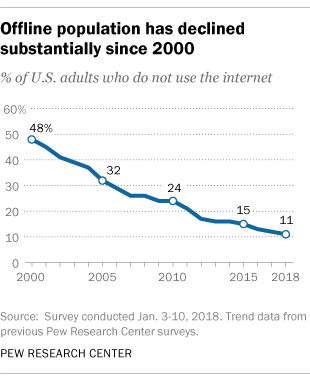
For many Americans, going online is an important way to connect with friends and family, shop, get news and search for information. Yet today, 11% of U.S. adults do not use the internet, according to a new Pew Research Center analysis of survey data.


The size of this group has changed little over the past three years, despite ongoing government and social service programs to encourage internet adoption in underserved areas. But that 11% figure is substantially lower than in 2000, when the Center first began to study the social impact of technology. That year, nearly half (48%) of American adults did not use the internet.

A 2013 Pew Research Center survey found some key reasons that some people do not use the internet. A third of non-internet users (34%) did not go online because they had no interest in doing so or did not think the internet was relevant to their lives. Another 32% of non-users said the internet was too difficult to use, including 8% of this group who said they were “too old to learn.” Cost was also a barrier for some adults who were offline – 19% cited the expense of internet service or owning a computer.

The Center’s latest analysis also shows that internet non-adoption is correlated to a number of demographic variables, including age, educational attainment, household income and community type.


Seniors are the age group most likely to say they never go online. Although the share of non-internet users ages 65 and older decreased by 7 percentage points since 2016, about a third today do not use the internet, compared with only 2% of 18- to 29-year-olds. Household income and education are also indicators of a person’s likelihood to be offline. Roughly one-in-three adults with less than a high school education (35%) do not use the internet, but that share falls as the level of educational attainment increases. Adults from households earning less than $30,000 a year are far more likely than the most affluent adults to not use the internet (19% vs. 2%).

Rural Americans are more than twice as likely as those who live in urban or suburban settings to never use the internet. And while there have been consistent racial and ethnic differences in internet use since the Center first began measuring the activity, today, whites, blacks and Hispanics are all equally likely to be offline. (There were not enough Asian respondents in the sample to be broken out into a separate analysis.)

Despite some groups having persistently lower rates of internet adoption, the vast majority of Americans are online. Over time, the offline population has been shrinking, and for some groups that change has been especially dramatic. For example, 86% of adults ages 65 and older did not go online in 2000; today that figure has been reduced to 34%. Among those without a high school diploma, the share not using the internet dropped from 81% to 35% in the same time period.