יום חמישי, 24 באוקטובר 2019

National Politics on Twitter: Small Share of U.S. Adults Produce Majority of Tweets


Those who strongly disapprove of Trump produce majority of tweets from U.S. adults that mention national politics


The social media platform Twitter plays a prominent role in how politicians, media outlets and advocacy organizations promote their agendas and engage with political issues. Although these entities represent a highly visible portion of the political Twitter ecosystem, less is known about the political tweeting habits of the 22% of the American public that uses Twitter. A new Pew Research Center analysis sheds light on this question by collecting and analyzing the tweets of a random sample of U.S. adults with public Twitter accounts1 over a period of one year surrounding the 2018 midterm elections (from June 10, 2018, through June 9, 2019).

The findings of this analysis paint a nuanced picture of just how prevalent political speech is among U.S. adults on Twitter. On one hand, 39% of users with public accounts tweeted at least once about national politics – which includes mentions of national politicians, institutions or groups, as well as civic behaviors such as voting – over the study 
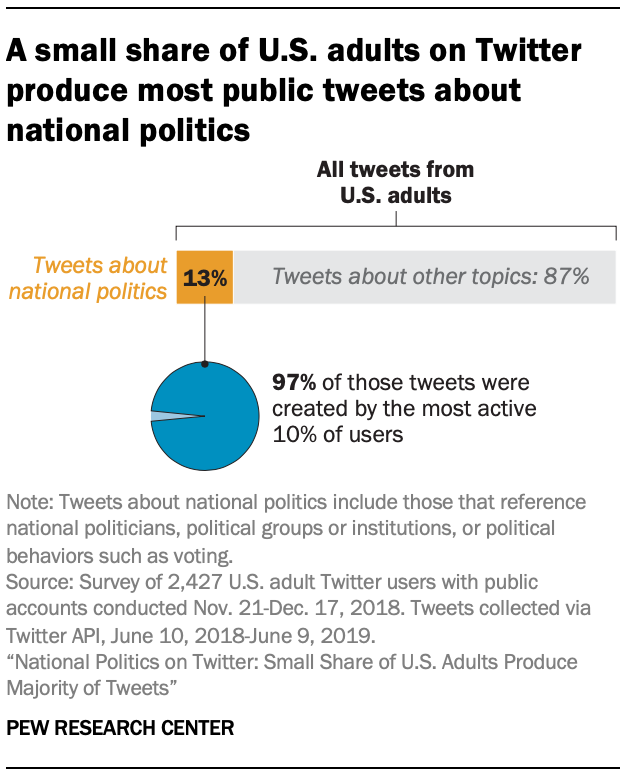
period. On the other hand, national politics is a relatively small element of the total Twitter conversation among U.S. adults. Content explicitly related to these issues made up just 13% of all tweets analyzed over the year studied.

And as our previous research found to be true of Twitter content more broadly, this analysis finds that a small share of users produce the vast majority of content related to national politics: 97% of tweets from U.S. adults that mentioned national politics over the study period came from just 10% of users.

A total of 2,427 respondents with public Twitter accounts participated in the survey; collectively, they produced more than 1.1 million tweets over the course of the study period (June 10, 2018-June 9, 2019). The Center used a guided machine learning model to classify each of these 1.1 million tweets as related to national politics or not (see sidebar and methodology for more details on this process and the types of content that are included in our definition of political tweets).

The study design helps to illustrate which types of users are most drawn to tweet about national politics in the first place. Most notably, those with intense views of President Donald Trump are among the most prolific political tweeters.

Tweets from users who strongly disapprove of Trump are especially prominent: This group generates 80% of all tweets from U.S. adults and 72% of tweets mentioning national politics. Those who strongly approve of Trump (who produce 11% of all tweets from U.S. adults) create 25% of tweets mentioning national politics. Taken together, strong disapprovers and strong approvers of Trump generate 97% of all tweets mentioning national politics from U.S. adults on Twitter. In interpreting these results, it is important to note that it was beyond the scope of this study to classify the share of tweets that explicitly mentioned the president, or that expressed particular views about his administration’s policies. And as noted above, the definition of political tweets used in this analysis includes a wide range of phrases and hashtags not related to Trump.

The prevalence of tweets mentioning national politics from U.S. adults who strongly disapprove of Trump is tied to two factors. First, this group makes up a larger share of Twitter users than of the general public. The share of U.S. adults on Twitter who strongly disapprove of Trump (55%) is 7 percentage points higher than the share of the general public that holds this view (48%). Second, this group is more likely to tweet about national politics than others on Twitter. Strong disapprovers of Trump make up 55% of all U.S. adults on Twitter, but their frequency of tweeting about national politics results in them generating 72% of all the tweets about this topic from U.S. adults.

By contrast, U.S. adults who strongly approve of Trump are underrepresented on Twitter relative to their presence in the population as a whole: 15% of Twitter users strongly approve of Trump, compared with 29% of the general public. However, those who strongly approve of Trump are similar to those who strongly disapprove of him in that they also are more likely than other groups to tweet about national politics. Twitter users who strongly approve of Trump generate 25% of the political tweets that come from U.S. adults – larger than the share of all Twitter users they represent (15%).
Those who tweet about politics differ from those who avoid the topic or tweet infrequently

Pairing a survey with an examination of the Twitter behaviors of U.S. adults also allows for a comparison of the attitudes and characteristics of political tweeters with those of other Twitter users. Political tweeters – defined as those who tweeted at least five times in total, and at least twice about national politics, over the year of the study period – are almost twice as likely as other Twitter users to say the people they follow on Twitter have political beliefs similar to their own (38% of political tweeters say this, compared with around one-in-five among nonpolitical tweeters). By contrast, nonpolitical tweeters are more likely to say they aren’t sure about the political beliefs of the people 
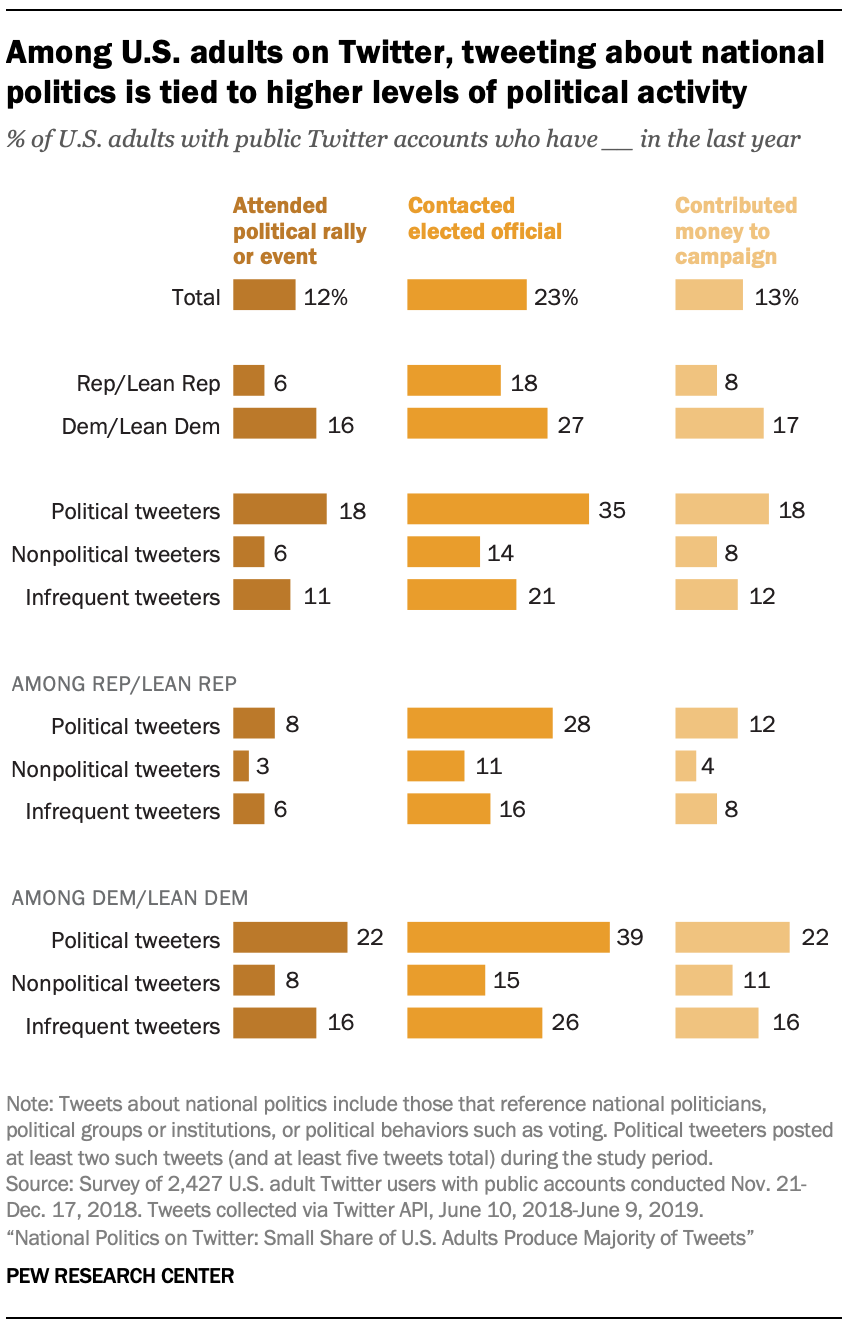
they follow or that they follow people with a mix of political views.

And greater engagement with national politics on Twitter is tied to political behaviors that extend beyond the social media platform. Those who tweet about politics are more likely than other users to report engaging in a variety of political activities, such as attending rallies and contacting elected officials.

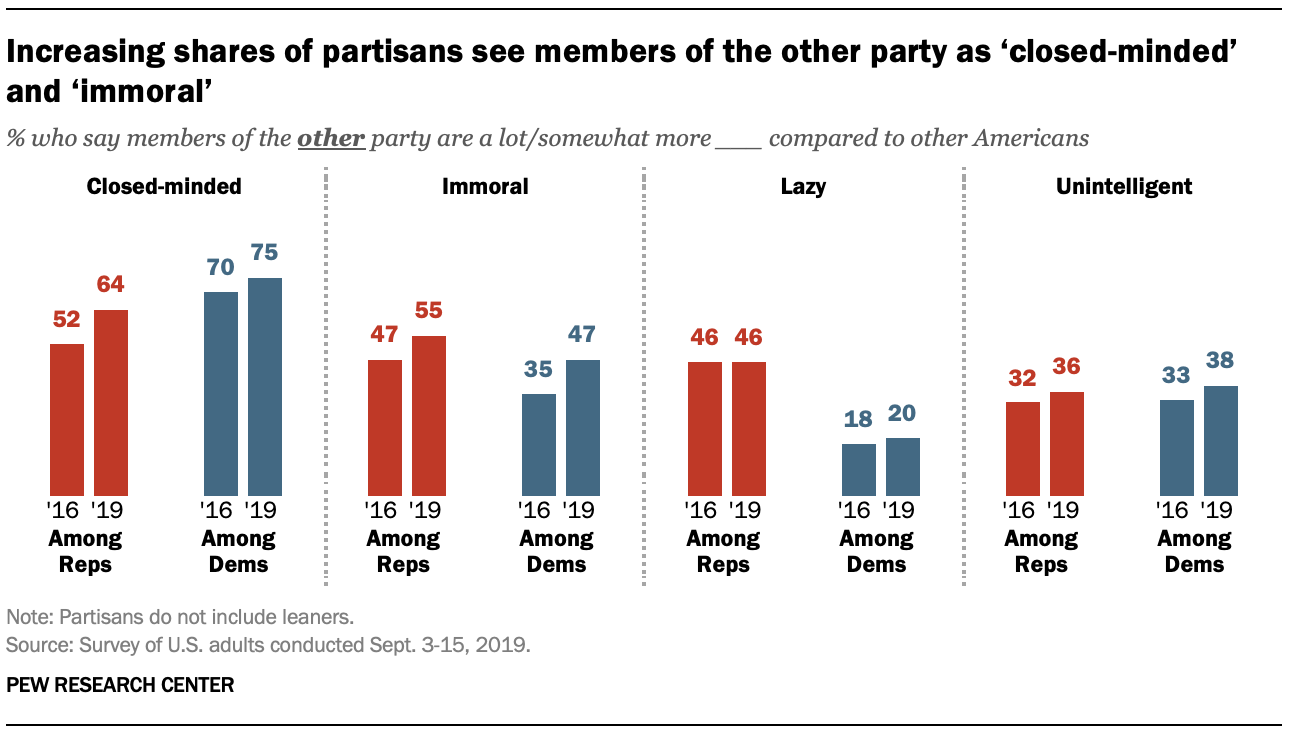
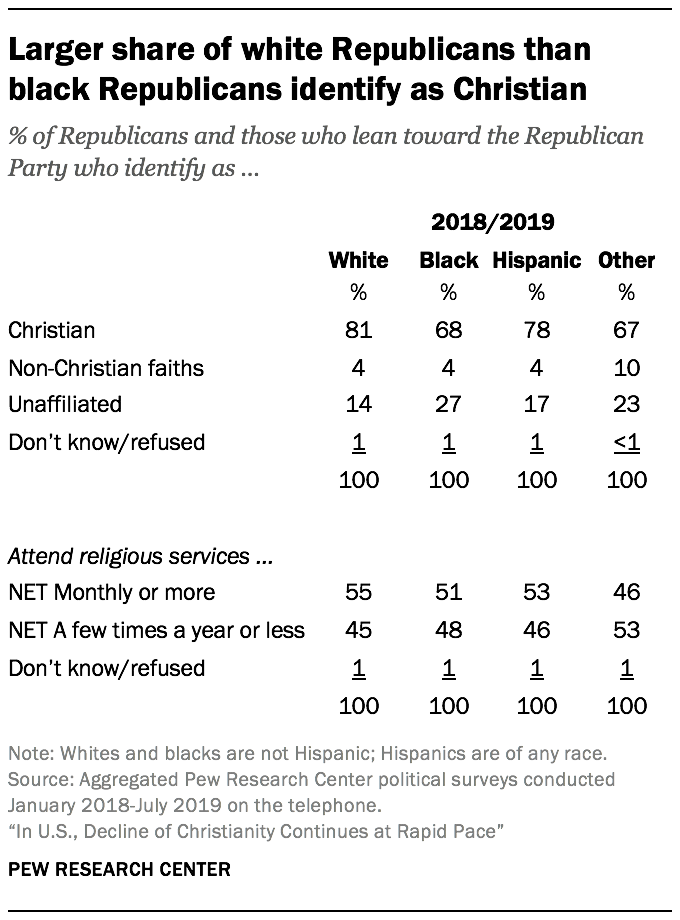
Prior research by the Center has found that politically engaged Republicans and Democrats in the general public are more likely than less-engaged partisans to hold a range of negative attitudes about the opposing party. And this new analysis indicates that partisans who tweet about national political issues tend to have colder views of the opposing political party relative to other users who are less politically active on the site. This difference is especially pronounced among Republicans: 51% of Republicans and those who lean toward the Republican Party who tweet about national politics give a very cold rating to Democrats, compared with about a third of Republicans on Twitter who don’t tweet about politics.

Measuring whether or not tweets talk about ‘national politics’

A central challenge of identifying and analyzing political content (on Twitter or elsewhere) is that many types of speech or online activity might be deemed “political” in some form or fashion. The general concept of politics might encompass numerous actors at the federal, state or local levels, as well as issue-specific concepts ranging from abortion to immigration to taxes. In an effort to create a broadly reasonable and functional definition of what tweets are considered “political” for the purposes of this analysis, we chose to focus on tweets that specifically mention or engage with national politics.

For the purposes of this analysis, a tweet is considered to discuss national politics if it mentions or expresses support or opposition toward national politicians or elected officials, political parties, ideological groups or political institutions, or specific political behaviors like voting. This definition of political content excludes tweets that are solely about state or local politics. It also does not include general discussions of issues (even if those issues may be of national interest) unless they also include a mention of a national politician, party, institution or organized political behavior.

Researchers identified tweets about national politics using a two-step process. First, they used a custom text classification model to classify political tweets based on the language used in the tweet. As an example, tweets encouraging Americans to vote in a national election or using common political hashtags would be classified as political during this step. Second, researchers searched for mentions of the Twitter usernames of members of Congress and other notable national politicians. All tweets mentioning these usernames were classified as political. As a result, tweets that engage with national politicians on Twitter are classified as political even if the content of the tweet is otherwise not obviously political. For instance, a brief reply to a member of Congress saying “happy birthday” would be classified as being related to national politics.

It is important to note that this method may fail to correctly classify tweets that use irony, sarcasm, memes or images to convey feelings or ideas about national politics. In other words, this analysis captures only the specific subset of the larger political conversation on Twitter that involves overt or explicit discussion of, or engagement with, U.S. national politics.

Despite the bounded nature of this definition, the estimates produced by this model largely align with the self-reported tweeting behavior of participants in the survey. For those who say they never tweet about politics or have, but not recently, the model estimates that just 2% of their tweets mention national politics. But among those who say they have tweeted about politics within the previous 30 days, an estimated 26% of their tweets mentioned national politics.
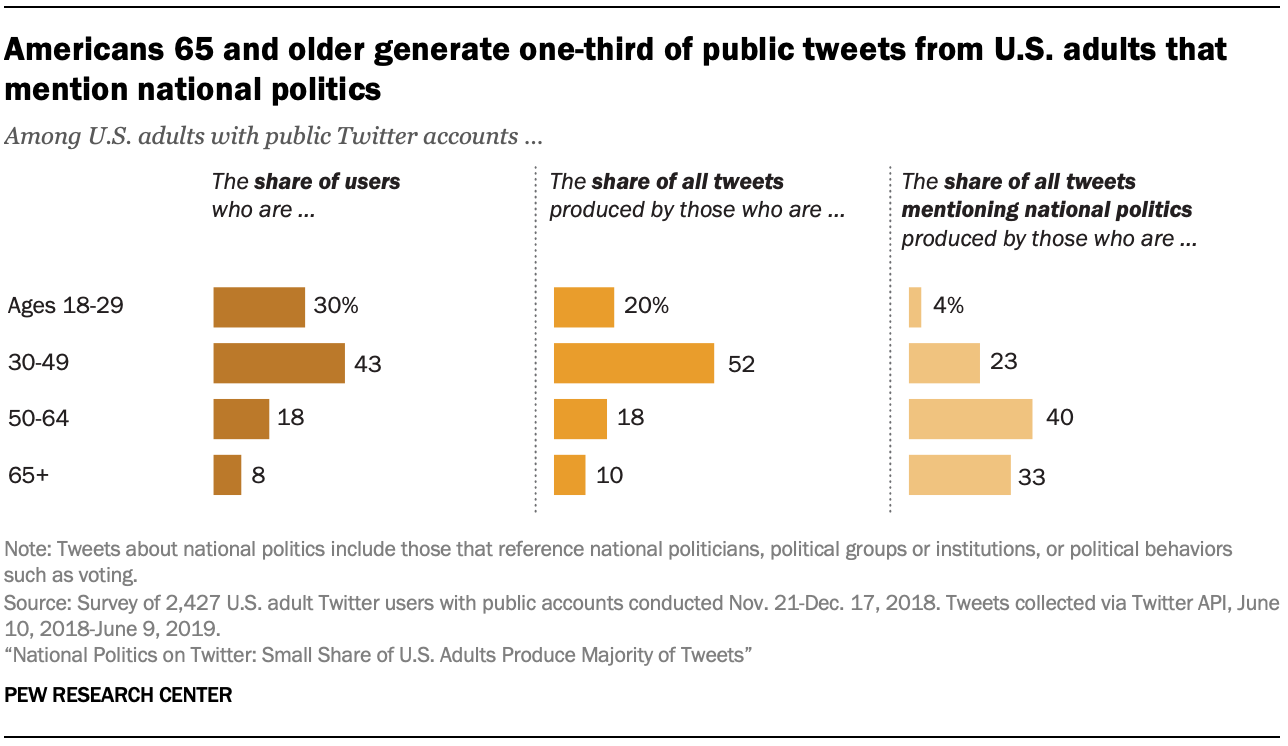
Older Americans produce sizable share of tweets by U.S. adults mentioning national politics

Reflecting the modest share of all Twitter users they represent, older adults on Twitter don’t produce a great deal of the total content. But this group is much more inclined to talk about national politics in their tweets than younger users. Those ages 65 and older produce just 10% of all tweets from U.S. adults, but these older Twitter users contribute 33% of tweets related to national politics. More broadly, those 50 and older produce 29% of all tweets but contribute 73% of tweets mentioning national politics. By contrast, 18- to 29-year-olds produce 20% of all public tweets from U.S. adults, but just 4% of political tweets.

In addition to these age-related differences, Republicans who describe themselves as conservative and Democrats who indicate that they are liberal are more likely to tweet about national politics than others in their parties. Researchers used an 11-point scale ranging from 0 (“very conservative”) to 10 (“very liberal”) to measure how individuals self-identified ideologically. Among Republicans and Republican leaners who identify as conservative (0-4) on the scale, 25% of tweets mention national politics. But just 9% of tweets from Republicans at the midpoint or liberal end of the scale (5-10) do the same.

Among Democrats and Democratic leaners, there is a similar pattern: 17% of tweets from Democrats who identify as liberal (6-10) on the scale mention national politics, compared with 5% among those who do not identify in this way (0-5).

The different types of Twitter users examined in this report

To compare the attitudes and behaviors of different types of Twitter users, researchers classified respondents to the survey into one of three categories based on how often they tweet in general, as well as whether they tweet about national politics.

Political tweeters are defined as those who tweeted at least five times over the study period, with a minimum of two of those tweets discussing national politics. About three-in-ten (31%) U.S. adults are in this group. Political tweeters are particularly likely to be Democrats: 67% of political tweeters identify as Democrats or lean toward the Democratic Party; 28% identify as Republicans or lean toward the GOP. The model used in this report estimates that 13% of all tweets produced by this group are political. Among those who say in the accompanying survey that they have tweeted about politics in the last 30 days, 78% meet our definition of a political tweeter based on their Twitter behavior. This group also contains some of the most active tweeters in the sample in terms of overall tweet volume.

Nonpolitical tweeters are defined as those who tweeted at least five times over the study period, but had no more than one tweet in that time that mentioned national politics. This group makes up 26% of U.S. adults on Twitter. Overall, 63% of nonpolitical tweeters identify as Democrats or lean toward the Democratic Party; 33% identify as Republicans or lean toward the GOP. Less than 1% of all tweets from this group are political in nature.

Infrequent tweeters are defined as those who tweeted fewer than five times in total over the year and includes those who did not tweet at all. Infrequent tweeters make up 43% of all U.S. adults on Twitter. Overall, 54% of infrequent tweeters identify as Democrats or lean toward the Democratic Party; 42% identify as Republicans or lean toward the GOP. This group accounts for fewer than 1% of all tweets produced by U.S. adults; 6% of their tweets are classified as political.

Political tweeters report visiting the site with great regularity: 73% of this group says they use the site at least once a day. The other two groups contain a smaller share of regular visitors to the site: 48% of nonpolitical tweeters and 33% of infrequent tweeters say that they use the site on a daily basis.
Political tweeters are more likely to follow other people who share their political views
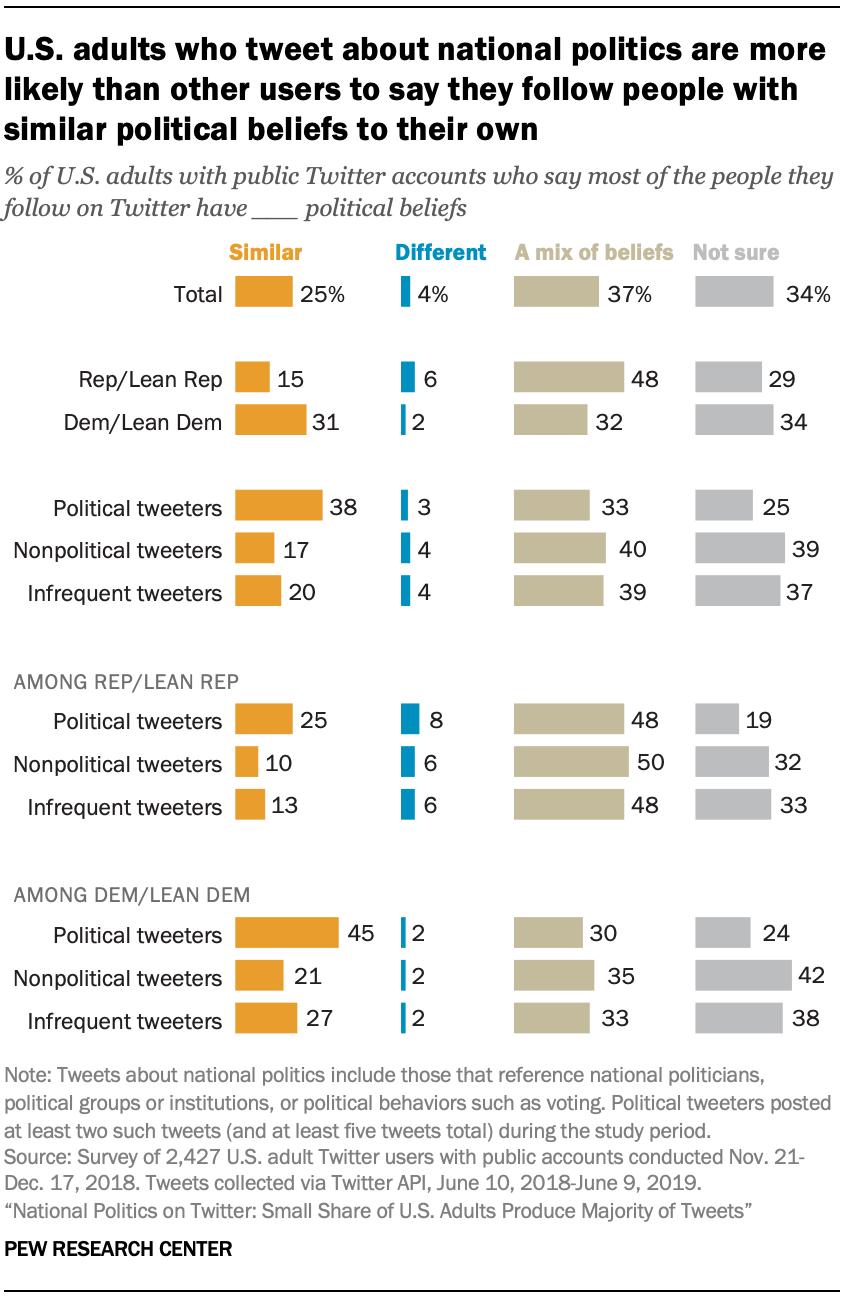
Most U.S. adults on Twitter report that they follow people with a mix of political views (37%) or that they don’t know the political views of the people they follow (34%). A quarter (25%) say most of the people they follow on Twitter hold similar political views to their own, while just 4% say that most of the people they follow have political views that are different from theirs.

The above relationship – in which a majority of users follow either a mix of people with different beliefs or say they aren’t sure of the political views of the people they follow – holds for the three types of Twitter users identified in this analysis (political tweeters, nonpolitical tweeters and infrequent tweeters). Still, the share of Twitter users who say they follow people with political views similar to their own is much higher among those who tweet about national politics (38%) than it is among nonpolitical tweeters (17%) and those who tweet infrequently (20%). In part, this dynamic is driven by the fact that nonpolitical tweeters (39%) and those who tweet infrequently (37%) are more likely than political tweeters (25%) to say they don’t know the political views of the people they follow.

Democrats and Democratic leaners on Twitter are about twice as likely as Republican and Republican-leaning users to say that most of the people they follow hold similar political views to theirs (31% vs. 15%). A previous Pew Research Center report found that Democrats make up a larger share of all Twitter users than of the general public overall.

Both Republicans and Democrats who tweet about national politics are more likely to say they follow people with similar political views than those who don’t tweet about politics. However, reflecting differences between partisans among all Twitter users generally, a larger share of Democrats (45%) than Republicans (25%) who tweet about national politics say they mostly follow people with political views that are similar to their own.
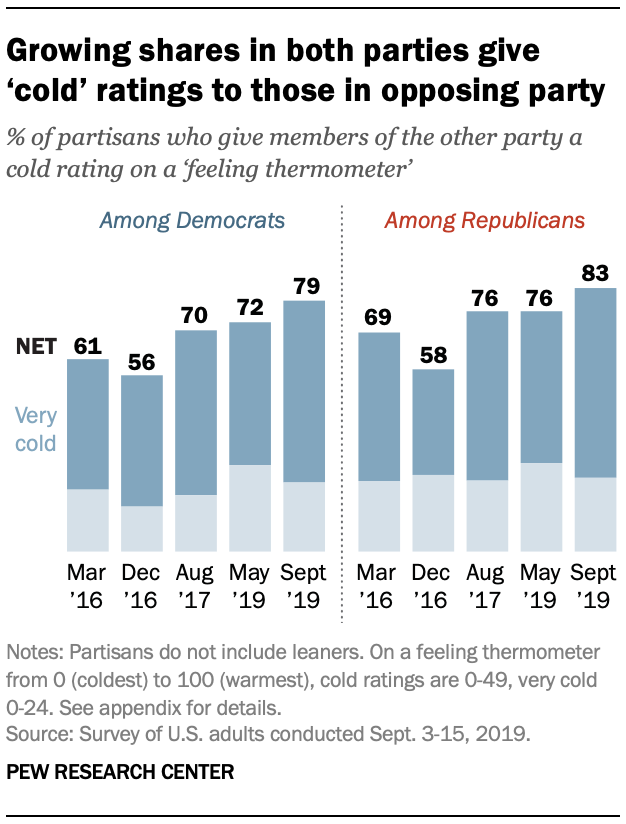
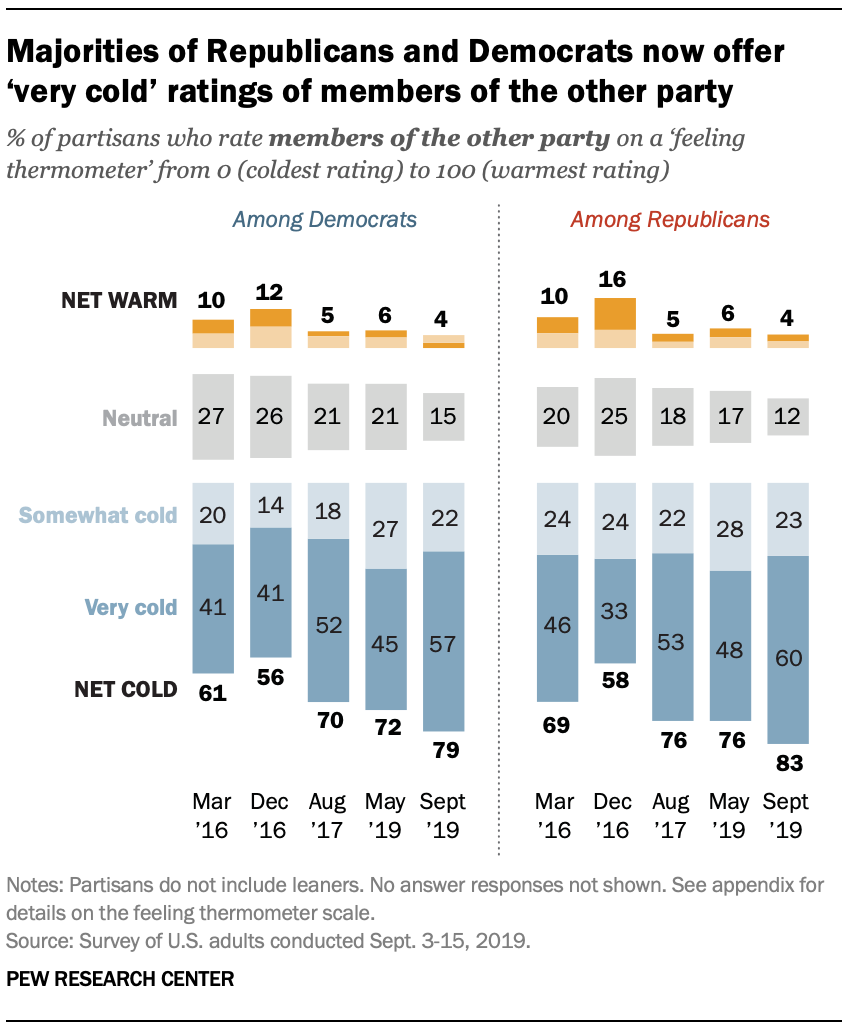
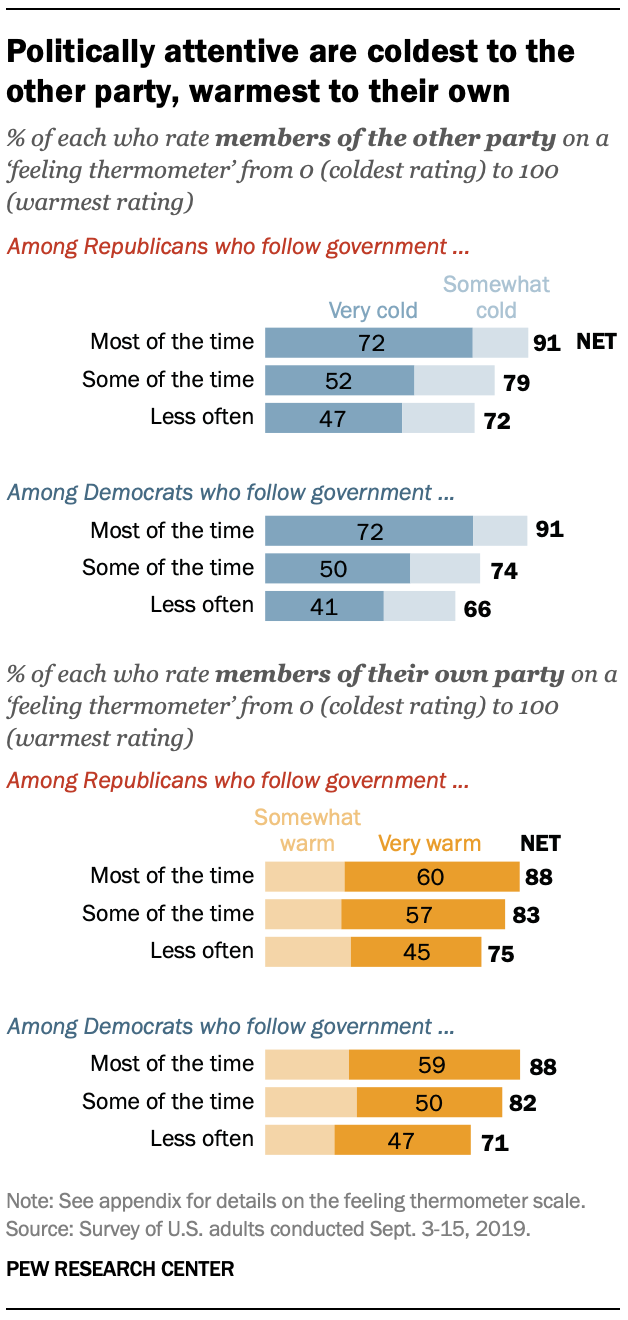
Political tweeters have ‘colder’ views of members of the other party
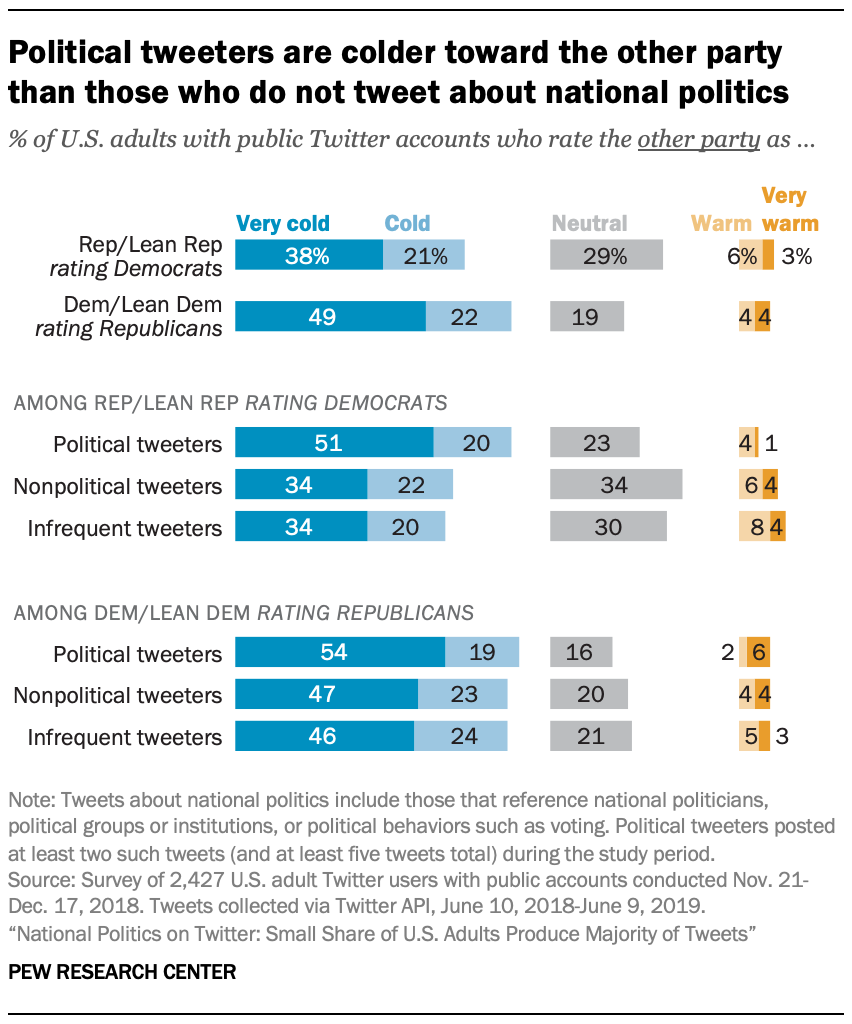
Partisans who tweet about national politics are more likely than those who do not to give members of the other party a “very cold” rating (a rating of less than 25 degrees on a 0-100 “feeling thermometer” scale).

This phenomenon is particularly prominent among Republicans: 51% of Republicans and Republican leaners who tweet about national politics give a very cold rating to Democrats – significantly higher than the shares of Republicans who don’t tweet about politics.

Among Democrats and Democratic leaners who tweet about national politics, 54% give a very cold rating to Republicans. Somewhat smaller shares of Democrats who don’t tweet about national politics give an equally cold rating for members of the other party.
Greater levels of political activity and engagement among those who tweet about national politics

Those who tweet about national politics are more likely than those who do not to report engaging in a range of behaviors related to political activity and engagement.

For example, 35% of national political tweeters say they have contacted an elected official within the last year, compared with 14% of nonpolitical tweeters and 21% of infrequent tweeters. Political tweeters are also more likely than the other two groups to say they have attended a political rally or protest or contributed money to a candidate running for office in the last year.

Within both political parties, national political tweeters are more likely to report engaging in political activity than nonpolitical tweeters.

Larger shares of Democratic political tweeters than Republican political tweeters say they participated in each of the three types of political behavior measured in the survey. This pattern is consistent with surveys of the general public conducted during the 2018 midterm election campaign, which found higher levels of political engagement among Democrats than Republicans.

National political tweeters also are somewhat more likely than other Twitter users to say they regularly follow the news. About two-thirds of national political tweeters (65%) say they follow the news closely whether or not something important is happening, slightly larger than the shares of infrequent tweeters (59%) and nonpolitical tweeters (53%) who say the same.
U.S. adults on Twitter skeptical about the accuracy of news from social media sites

Most Twitter users (57%) say they expect the news they see on social media sites to be largely inaccurate; 41% expect the news they see on social media to be largely accurate.
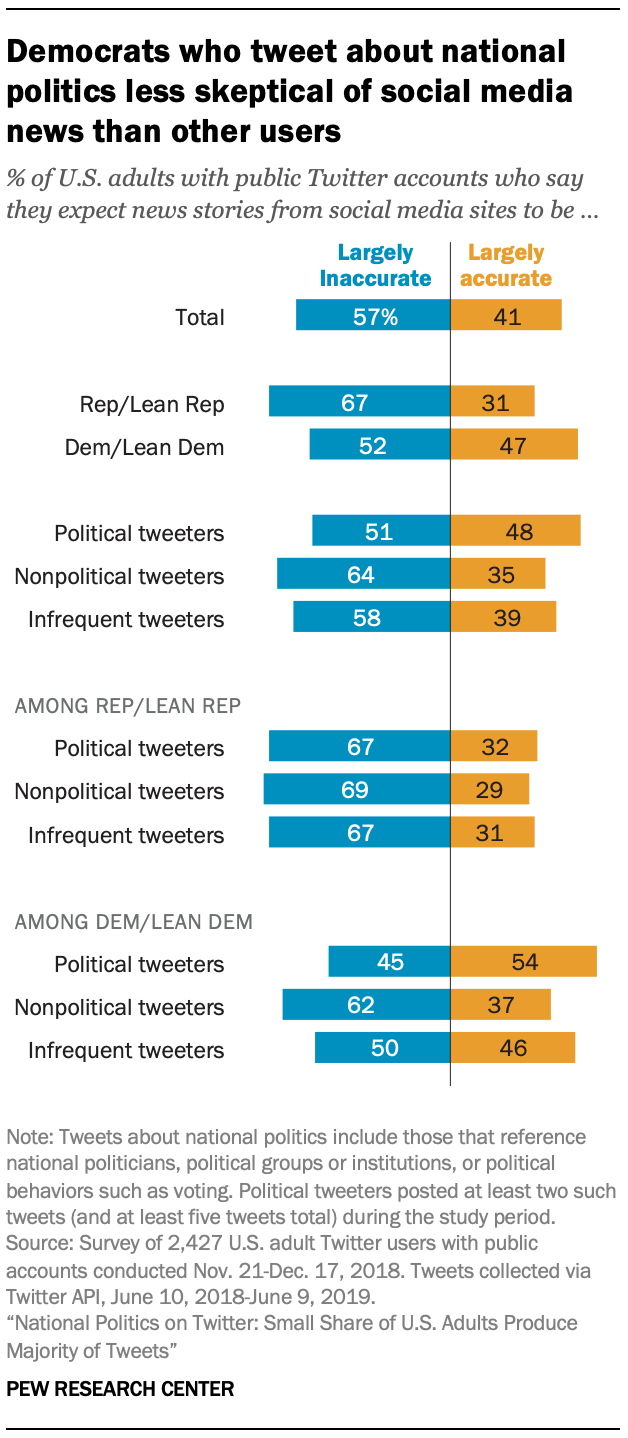
However, political tweeters are more evenly divided: 48% expect the news they see on social media to be largely accurate, while a comparable share (51%) expects it to be largely inaccurate. Other Twitter users with public accounts are more skeptical: 64% of nonpolitical tweeters and 58% of infrequent tweeters say they approach news stories from social media sites with the expectation that they will be largely inaccurate.

Differences on this question are driven largely by views among Democrats.

Democrats and Democratic leaners who tweet about politics are more likely than Democrats who don’t tweet about politics and Democrats who are infrequent tweeters to say they expect news stories from social media sites to be largely accurate (54% compared with 37% and 46%, respectively).

However, there is no comparable relationship among Republicans and Republican leaners. About two-thirds of Republicans across all three groups of Twitter users say they expect news stories from social media sites to be largely inaccurate.

Among the general public, Republicans are far more likely than Democrats to express distrust in news organizations and rate the impact of the national news media on the country negatively.
The most prolific political tweeters have behaviors and attitudes distinct from other U.S. adults on Twitter

As a group, political tweeters differ in numerous ways from those who tweet about nonpolitical topics and from those who rarely tweet at all. It’s also the case that there are meaningful differences within the group of users who tweet about national politics. The most prolific political tweeters (defined as those who tweeted at least 10 times and mentioned national politics in at least 25% of those tweets) stand out even from other political tweeters (whose political tweets make up a smaller share of their total output). Prolific political tweeters make up just 6% of all Twitter users but generate 20% of all tweets and 73% of tweets mentioning national politics.

Compared with other political tweeters, even larger shares of these highly prolific users say they largely follow others on Twitter who share their political views (51%) and that they follow the news closely whether or not something important is happening (92%). And this group is highly active in more traditional forms of political activity: 57% have contacted an elected official in the last year, while 38% have made a political donation and 34% have attended a rally.

יום חמישי, 17 באוקטובר 2019

Partisan Antipathy: More Intense, More Personal

Majority of Republicans say Democrats are ‘more unpatriotic’ than other Americans


Three years ago, Pew Research Center found that the 2016 presidential campaign was “unfolding against a backdrop of intense partisan division and animosity.” Today, the level of division and animosity – including negative sentiments among partisans toward the members of the opposing party – has only deepened.

The share of Republicans who give Democrats a “cold” rating on a 0-100 thermometer has risen 14 percentage points since 2016 – with virtually all of the increase coming in “very cold” ratings (0-24). Democrats’ views of Republicans have followed a similar trajectory: 57% give Republicans a very cold rating, up from 41% three years ago.

The survey by Pew Research Center was conducted Sept. 3-15 among 9,895 adults (it was completed before House Speaker Nancy Pelosi’s Sept. 24 announcement of an impeachment inquiry into President Donald Trump). It finds that both Republicans and Democrats express negative views about several traits and characteristics of those in the opposing party, and in some cases these opinions have grown more negative since 2016.

For example, 55% of Republicans say Democrats are “more immoral” when compared with other Americans; 47% of Democrats say the same about Republicans. Three years ago, 47% of Republicans and 35% of Democrats said members of the other party were less moral than other people.

For the most part, Republicans are more likely than Democrats to ascribe negative characteristics to people in the opposing party, with one exception: 75% of Democrats say Republicans are “more closed-minded” than other Americans, while 64% of Republicans say the same about Democrats.

Yet Republicans are far more likely than Democrats to view members of the opposing party as unpatriotic. A 63% majority of Republicans say that, compared with other Americans, Democrats are “more unpatriotic.” Just 23% of Democrats say the same about Republicans.

The survey also finds that partisan hostility extends beyond politics. Fewer than half of Democrats (45%) and just 38% of Republicans say that while members of the other party feel differently about politics, they share many of their other values and goals. Majorities in both parties say those in the opposing party do not share their nonpolitical values and goals.

As prior surveys on partisan polarization have shown, partisans who are highly attentive to politics are most likely to express negative sentiments about the opposing party. For example, both Republicans and Democrats who follow government and public affairs most of the time are more likely to give cold ratings to members of the other party – and warm ratings to their fellow partisans – than those who follow government less closely.

Even as Republicans and Democrats have grown more critical of each other, they acknowledge – and voice concern about – the partisanship dividing the nation. Overwhelming majorities in both parties (85% of Republicans and 78% of Democrats) say divisions between the two parties are increasing. Similar shares express concern about the partisan divide, with about half in each party saying they are very concerned about this.

Partisans also generally agree about their inability to agree on “basic facts.” Overall, 73% of the public – including 77% of Republicans and 72% of Democrats – say that voters in both parties “not only disagree over plans and policies, but also cannot agree on the basic facts.”

These are among the other important findings from the survey on how partisans view each other and the political parties:

Majorities of Americans describe both parties as ‘too extreme.’ More Americans say the Democratic Party than Republican Party is described well by such phrases as “is respectful and tolerant of different types of people,” “cares about the middle class” and “governs in an honest and ethical way.” But nearly identical majorities say each party is described at least somewhat well by the phrase “is too extreme in its positions” (63% say this about the Republican Party, 61% about the Democratic Party).

Partisan ‘leaners’ also are hostile to the opposing party. Independents who lean toward the Republican and Democratic parties are much less likely than those who identify with a party to express warm feelings about the people in their own parties. But large majorities of Republican and Democratic leaners give cold ratings to the people in the opposing party, and there are only modest differences between leaners and partisan identifiers in these views.

Majority of Democrats want a presidential candidate who seeks ‘common ground’ with GOP. Nearly six-in-ten Democrats (58%) say it is more important for a Democratic presidential candidate, if elected, to find common ground with Republicans on policies even if that means giving up some things Democrats really want, while 41% say it’s more important to push hard for Democratic policies even if it’s harder to get things done. By contrast, about half of Republicans (53%), say Donald Trump should push hard for GOP policies even if that means less gets done; 45% say he should make compromises with Democrats even if that means giving up things Republicans really want.


The partisan landscape and views of the parties

Republicans and Democrats agree on very little in the current political environment, but there is a widespread belief in both parties that partisan divisions in the country are increasing. Among the public overall, 78% say divisions between Republicans and Democrats in this country are increasing, while just 6% say they are decreasing and 16% say they are staying the same.

Large majorities in both parties say partisan divisions are increasing, though Republicans are somewhat more likely than Democrats to express this view (85% vs. 78%).

Similarly, large majorities in both parties express concern about rising partisanship. About eight-in-ten adults (81%) say they are very or somewhat concerned about divisions between Republicans and Democrats, including nearly half (46%) who say they are very concerned about the growing divide.

Comparable shares of Republicans and Democrats express concern about divisions between the two parties, though Democrats are slightly more likely to say this than Republicans (88% vs. 83%).

A similar pattern is evident among independents who lean toward a party. About three-quarters of independents who lean toward the Republican Party (77%) or Democratic Party (74%) say partisan divisions are growing. Comparable shares of those who lean toward each party express concern about this.
Growing share of Americans say there are major differences in what the parties stand for

A majority of Americans (55%) say there is a “great deal” of difference in what the Republican and Democratic parties stand for, while 37% see a “fair amount” of difference and 7% say there is “hardly any” difference between the two parties.

These opinions have changed dramatically over the past three decades. From the late 1980s through the mid-2000s, no more than about a third of Americans said there were major differences between the two parties. But the share expressing this view has increased, especially over the past decade.1

In the current survey, Republicans are more likely than Democrats to say there are major differences in what the parties stand for (74% of Republicans vs. 59% of Democrats).

In both parties, people who are attentive to politics on a regular basis are more likely than those who are less attentive to see wide, growing divides in the country.

Most Republicans who say they follow what is happening in government and public affairs most of the time perceive a great deal of difference in what the Democratic and Republican parties stand for (85%). Among Republicans who follow government and public affairs less often, a smaller majority (65%) says there are major differences between the parties. Among Democrats, there is a similar gap in views by engagement; 70% of politically attentive Democrats see a wide gulf between the parties, while just 49% of less-attentive Democrats say the same.
Most Americans say partisan disagreements extend beyond policies to ‘basic facts’

Fully 73% of the public says that most Republican and Democratic voters not only disagree over plans and policies, but also disagree on “basic facts.” Just 26% say that while partisan voters often differ over plans and policies, they can agree on basic facts. These opinions have changed only modestly since last year.

Comparable majorities of Republicans (77%) and Democrats (72%) say that Republican and Democratic voters cannot agree on basic facts.
Does the other party have any good ideas?

Most Republicans and Democrats believe that few – or no – good ideas come from the other party. Only 17% of Republicans say that the Democratic Party has “a lot” or “some” good ideas” and only 13% of Democrats say this about the Republican Party. In fact, nearly half in both parties say the other has almost no good ideas.

Overall, 45% of Democrats say the GOP has almost no good ideas, while 41% say it has a few and just 13% say it has a lot or some good ideas. The share of Democrats saying the Republican Party has almost no good ideas is higher than it was in the spring of 2016 (45% now, 34% then), while the share saying the GOP has at least some good ideas has dropped from 21% to 13%.

Among Republicans, 53% say the Democratic Party has almost no good ideas, while another 29% say they have a few; just 17% of Republicans say the Democratic Party has a lot or some good ideas. The share of Republicans who say the Democratic Party has almost no good ideas has increased since 2016 (from 43% to 53%).
Republicans and Democrats have different views about compromising with the other party

Overall, Republicans are divided over whether Donald Trump should focus on finding common ground with Democrats, even if that means giving up some things Republicans want, or pushing hard for GOP policies, even if it means less gets done. While 53% of Republicans say Trump should “push hard” for the party’s policies, 45% say it’s more important for the president to find common ground with Democrats.

However, politically attentive Republicans broadly oppose Trump seeking compromise with Democrats even if it means giving up some things Republicans want. Just 39% of Republicans who follow government and public affairs most of the time say it is more important for Trump to find common ground with Democrats; 61% say he should push hard for GOP policies. Opinion is more evenly divided among less politically attentive Republicans.

Democrats, who were asked a hypothetical version of the question about the party’s 2020 presidential candidates, are more open to potential compromise with Republicans. About six-in-ten Democrats (58%) say it is more important for a candidate, if elected, to find common ground with Republicans even if it means giving up things Democrats want.

There are no differences in these views among Democrats based on political attentiveness. But liberal Democrats (54%) are less likely than conservative and moderate Democrats (62%) to say it is more important for a candidate to seek compromises with Republicans.

There is an even sharper ideological divide among Republicans in views of whether Trump should make compromises. Just 39% of conservative Republicans say Trump should find common ground with Democrats if it means giving up things Republicans want; about two-thirds of GOP moderates and liberals (63%) say the same.
Views of the parties’ traits and characteristics

The Republican Party and the Democratic Party are both seen as too extreme by a majority of Americans. About six-in-ten (63%) say the phrase “too extreme in its positions” describes the Republican Party at least somewhat well, including 30% who say this describes the GOP very well. The share of Americans who say the same phrase applies to the Democratic Party is nearly identical: 61% say this applies at least somewhat, and 29% say it describes the party very well.

The public also is critical of the parties ability to govern honestly and ethically: Just 38% say the phrase “governs in an honest and ethical way” describes the Republican Party at least somewhat well, while 61% say it does not. Roughly half (47%) say this describes the Democratic Party at least somewhat well, while about as many (52%) say it doesn’t.

The public views the Democratic Party more positively than the Republican Party on three other traits and characteristics. Four-in-ten (40%) say that the phrase “represents the interests of people like me” applies at least somewhat well to the Republican Party, while half (50%) say this phrase describes the Democratic Party at least somewhat well.

A majority (55%) says the description “cares about the middle class” describes the Democratic Party at least somewhat well. By comparison, 39% say that it applies to the Republican Party.

The widest gap in opinion across the items included in the survey is over whether the two parties are “respectful and tolerant of different types of people.” Six-in-ten (60%) say this phrase describes the Democratic Party at least somewhat well; 38% say it describes the Republican Party somewhat or very well.

Large majorities of Republicans and Democrats assign positive characteristics to their own party, while taking a much more negative view of the opposing party.

For instance, 83% of Republicans say the phrase “governs in an honest and ethical way” describes the GOP very or somewhat well; just 12% say this phrase describes the Democratic Party well. The pattern of opinion is very similar among Democrats: 85% of Democrats describe their own party as governing in an honest and ethical way, while just 15% say this describes the Republican Party.

However, a greater share of Democrats (90%) than Republicans (82%) say their own party cares about the middle class. In addition, the share of Republicans who say the Democratic Party cares about the middle class (23%) is larger than the share of Democrats who describe the GOP this way (11%).

There is a similar pattern on views of how respectful and tolerant the parties are of different types of people. A larger majority of Democrats (92%) than Republicans (82%) describe their own party this way. And out-party assessments – while low among both sets of partisans – are more positive among Republicans than Democrats.

Republicans and Democrats are more willing to critique their own party over the extremity of its positions. Overall, 47% of Democrats and 45% of Republicans say their own party is described very or somewhat well by the phrase “too extreme in its positions.”

Still, partisans are much more likely to cast this criticism toward the opposing party than their own: Majorities of Republicans and Democrats (both 76%) describe the opposing party as too extreme in its positions.

On this measure, there is little difference between partisan leaners and identifiers. Similar majorities of those who identify with a party and those who lean toward a party view the other side as too extreme in its positions.

Across the positive traits included in the survey – such as governing in an honest and ethical way – smaller majorities of partisan leaners than identifiers take a positive view of the party they associate with.


How partisans view each other

Large shares of Republicans and Democrats associate several negative traits with members of the other party. Wide majorities in both parties – three-quarters of Democrats (75%) and 64% of Republicans – say those in the other party are more closed-minded than other Americans. And 55% of Republicans and 47% of Democrats view members of the other party as more immoral than other Americans. In both parties, the share saying those in the other political camp are closed-minded or immoral has increased since these questions were last asked in 2016.

Republicans are substantially more likely to characterize Democrats as more unpatriotic than other Americans than Democrats are to say this of Republicans: 63% of Republicans view Democrats as more unpatriotic. By comparison, just 23% of Democrats say this about Republicans, while a majority (57%) say Republicans are about as patriotic as other Americans. In fact, Democrats are roughly as likely to say Republicans are more patriotic than other Americans as they are to say they are less patriotic (19% vs. 23%).

Republicans also are more likely to describe Democrats as lazy than Democrats are to characterize Republicans in this way. Still, this is a minority opinion in both parties (46% of Republicans and 20% of Democrats view those in the other party as more lazy than other Americans).

Most Democrats and Republicans do not think of those in the other party as different from their fellow Americans when it comes to intelligence (roughly six-in-ten say they are about the same as other Americans). However, 36% of Republicans and a similar share of Democrats (38%) do say those in the other party are more unintelligent than other Americans.

Overall, roughly eight-in-ten Republicans (82%) and Democrats (78%) say at least one of these negative descriptors applies to those in the other party. But Republicans are substantially more likely than Democrats to ascribe multiple negative characteristics to Democrats. Seven-in-ten Republicans ascribe two or more of the five negative characteristics to Democrats, while 58% of Democrats associate two or more of these characteristics with Republicans. And 20% of Republicans associate all five negative characteristics with Democrats, while 8% of Democrats say all five negative descriptors apply to Republicans.
More now associate some negative traits with the ‘other side’ than in 2016

The shares of both Republicans and Democrats ascribing several of these negative traits to members of the other party have increased significantly since the spring of 2016.

The share of Republicans who say Democrats are more closed-minded has increased substantially over this time period. In 2016, about half of Republicans (52%) said Democrats were more closed-minded than other Americans. Now, a clear majority (64% of Republicans) say this – an increase of 12 percentage points. While the shift is more modest among Democrats, it is in the same direction (from 70% to 75% saying Republicans are more closed-minded than other Americans).

Members of both parties are now substantially more likely to say those in the other party are more immoral than other Americans than they were three years ago. Today, 47% of Democrats say this of Republicans, up from 35% in 2016. The share of Republicans who say Democrats are more immoral than other Americans is 8 percentage points higher (47% then, 55% today).

There has been little or no change in the shares of Republicans and Democrats saying that members of their opposing parties are lazier or more unintelligent than other Americans.
How partisans see themselves: Republicans say they are more patriotic than others, Democrats say they are more open-minded

Many Republicans and Democrats also associate their fellow partisans with positive traits. And with some exceptions, these are broadly the inverse of how they see the other party’s members.

A clear majority (70%) of Democrats say that Democrats are more open-minded compared with other Americans. Republicans are considerably less likely to ascribe this trait to members of their party: 42% say members of the GOP are more open-minded than other Americans, while about as many (43%) say they are on par with other Americans (14% say they are more closed-minded).

However, Republicans are much more likely than Democrats to describe members of their own party as more patriotic (71% say this). By comparison, just 29% of Democrats say Democrats are more patriotic than other Americans (the majority – 63% – say they are about the same as other Americans).

While majorities of those in both parties say their co-partisans are about as intelligent as other Americans, Democrats are slightly more likely to view members of their party as more intelligent (43%) than Republicans are (36%).
Partisans say their differences with other party extend beyond politics

Majorities in both parties say that, aside from political differences, people in the other party do not share many of their other values and goals. About six-in-ten Republicans (61%) say, thinking about more than just politics, Democrats do not share many of their other values and goals; 54% of Democrats say the same about Republicans.

In the current survey, politically attentive Republicans are especially likely to say Democrats do not share their nonpolitical values and goals. Among Republicans who follow government and public affairs most of the time, 70% say that, setting political differences aside, Democrats do not share many of their other values and goals. That compares with 53% of Republicans who follow government less often.

Among Democrats, the differences based on attentiveness to government and politics are more modest: 57% of highly attentive Democrats say Republicans do not share many of their other values and goals, compared with 52% of less politically attentive Democrats.
Republicans, Democrats are increasingly positive about members of their own parties

When asked to rate Republicans and Democrats on a “feeling thermometer” between 0 and 100 – where 0 is the most negative rating and 100 is the most positive rating – large majorities of partisans rate the members of their own party warmly. In both parties, the shares giving warm ratings (a rating of 51-100) have increased since March 2016.

About eight-in-ten Democrats (82%) and Republicans (84%) feel warmly toward their own party. In March 2016 – prior to the conclusion of the presidential primaries – 75% of Democrats and 67% of Republicans said that they had a warm view of their fellow partisans.

Since 2016, the shares of partisans with neutral feelings (a rating of 50 on the 0-100 thermometer) toward members of their own party have dropped from about one-in-five (19% of Democrats and 22% of Republicans) to about one-in-ten (11% of Democrats and 10% of Republicans).

As Republicans and Democrats take an increasingly positive view of members of their own parties, they have become more negative toward members of the opposing party.

Today, 79% of Democrats and 83% of Republicans rate the other party coldly (a thermometer rating of 0-49).

Three years ago, narrower majorities in both parties gave the other party a cold rating. In March 2016, 61% of Democrats gave Republicans a cold rating and 69% of Republicans gave Democrats a cold rating.

Since 2016, there has been an especially sharp rise in “very cold” feelings toward the opposing party. In March 2016, 41% of Democrats and 46% of Republicans gave the other party a very cold rating (less than 25 on the 0-100 scale). Today, 57% of Democrats and 60% of Republicans give the other party a very cold rating. And about three-in-ten Democrats (30%) and Republicans (32%) give members of the opposing party a rating of zero – the lowest on the scale.
‘Leaners’ are much less warm to their own party than are partisans

Compared with those who identify with one of the political parties, those who “lean” toward a party are considerably less likely to view members of their own party warmly. However, they are only modestly less likely to give a cold rating to the opposing party.

While about eight-in-ten of those who identify with a party (84% of Republicans and 82% of Democrats) say they have warm feelings toward the members of their own party, only about half of partisan leaners say the same.

Among Republicans leaners, 46% rate Republicans warmly, while about as many Democratic leaners (52%) rate Democrats warmly.

However, majorities of partisan leaners – and those who identify with a party – have negative opinions of members of the opposing party. About eight-in-ten partisan identifiers (83% of Republicans and 79% of Democrats) have a cold view of the other party compared with about seven-in-ten leaners (70% of Republican leaners and 72% of Democratic leaners).
Growing shares of partisans give opposing ratings to the two parties

Three-quarters of Republicans (75%) and 71% of Democrats now rate the members of their own party warmly and the other party coldly. In both parties, the shares holding this combination of views have steadily increased over the past three years.

The share of Republicans with this combination of views is 26 percentage points higher than it was just three years ago (75% now, 49% then). Among Democrats, there has been a similar increase in the share with a warm view of Democrats and a cold view of Republicans over this period (71% now, 53% then).
Men, older partisans most likely to view the other party ‘very coldly’

In both parties, there are gender, age and educational differences in “very cold” (0-24) ratings of members of the opposing party.

Men in both parties are more likely than women to give colder ratings to the members of the other party. About two-thirds of Republican (65%) and Democratic (64%) men give the other party a very cold rating.

By comparison, 55% of Republican women and 53% of Democratic women offer a very cold rating to the members of the other party.

Similarly, in both parties, younger adults are less likely than older people to give highly negative ratings to the members of the opposing party.

Yet the education differences in these attitudes differ among Republicans and Democrats. Nearly two-thirds of Democrats with at least a four-year college degree (65%) give Republicans a very cold rating. That compares with 51% of Democrats who have not attended college. The pattern is reversed among Republicans: 52% of Republicans with a college degree give Democrats a very cold rating, compared with 65% of those with no college experience.
Politically attentive have stronger feelings toward both parties

Partisans who follow government and politics most closely are more likely than less attentive partisans to give a cold rating to the other party – and a warm rating to their own.

About nine-in-ten (91% of both Republicans and Democrats) who say they follow government and public affairs most of the time give members of the other party a cold rating. By comparison, smaller majorities of those who follow government some of the time or less often give the opposing partisans cold ratings

The most politically attentive are also most likely to have warm views of their own party. Overwhelming majorities of partisans who say they follow government most of the time give members of their own party a warm rating (88% of both Republicans and Democrats). Narrower majorities of those who are less attentive to politics say the same.

In U.S., Decline of Christianity Continues at Rapid Pace

An update on America's changing religious landscape


The religious landscape of the United States continues to change at a rapid clip. In Pew Research Center telephone surveys conducted in 2018 and 2019, 65% of American adults describe themselves as Christians when asked about their religion, down 12 percentage points over the past decade. Meanwhile, the religiously unaffiliated share of the population, consisting of people who describe their religious identity as atheist, agnostic or “nothing in particular,” now stands at 26%, up from 17% in 2009.

Both Protestantism and Catholicism are experiencing losses of population share. Currently, 43% of U.S. adults identify with Protestantism, down from 51% in 2009. And one-in-five adults (20%) are Catholic, down from 23% in 2009. Meanwhile, all subsets of the religiously unaffiliated population – a group also known as religious “nones” – have seen their numbers swell. Self-described atheists now account for 4% of U.S. adults, up modestly but significantly from 2% in 2009; agnostics make up 5% of U.S. adults, up from 3% a decade ago; and 17% of Americans now describe their religion as “nothing in particular,” up from 12% in 2009. Members of non-Christian religions also have grown modestly as a share of the adult population.


These are among the key findings of a new analysis of trends in the religious composition and churchgoing habits of the American public, based on recent Pew Research Center random-digit-dial (RDD) political polling on the telephone.1 The data shows that the trend toward religious disaffiliation documented in the Center’s 2007 and 2014 Religious Landscape Studies, and before that in major national studies like the General Social Survey (GSS), has continued apace.

Pew Research Center’s 2007 and 2014 Religious Landscape Studies were huge national RDD surveys, each of which included interviews with more than 35,000 respondents who were asked dozens of detailed questions about their religious identities, beliefs and practices. The Center has not yet conducted a third such study, and when the Landscape Study is repeated, it is likely to use new methods that may prevent it from being directly comparable to the previous studies; growing challenges to conducting national surveys by telephone have led the Center to rely increasingly on self-administered surveys conducted online.2

But while no new Religious Landscape Study is available or in the immediate offing, the Center has collected five additional years of data (since the 2014 Landscape Study) from RDD political polls (see detailed tables). The samples from these political polls are not as large as the Landscape Studies (even when all of the political polls conducted in a year are combined), but together, 88 surveys from 2009 to 2019 included interviews with 168,890 Americans.

These surveys do not include nearly as many questions about religion as the Landscape Studies do. However, as part of the demographic battery of questions that ask respondents about their age, race, educational attainment and other background characteristics, each of these political polls also include one basic question about religious identity – “What is your present religion, if any? Are you Protestant, Roman Catholic, Mormon, Orthodox such as Greek or Russian Orthodox, Jewish, Muslim, Buddhist, Hindu, atheist, agnostic, something else, or nothing in particular?”

Additionally, most of these political polls include a question about religious attendance – “Aside from weddings and funerals, how often do you attend religious services? More than once a week, once a week, once or twice a month, a few times a year, seldom, or never?” Taken together, these two questions (one about religious identity, the other about religious attendance) can help shed light on religious trends in the U.S.

The data shows that just like rates of religious affiliation, rates of religious attendance are declining.3 Over the last decade, the share of Americans who say they attend religious services at least once or twice a month dropped by 7 percentage points, while the share who say they attend religious services less often (if at all) has risen by the same degree. In 2009, regular worship attenders (those who attend religious services at least once or twice a month) outnumbered those who attend services only occasionally or not at all by a 52%-to-47% margin. Today those figures are reversed; more Americans now say they attend religious services a few times a year or less (54%) than say they attend at least monthly (45%).

The changes underway in the American religious landscape are broad-based. The Christian share of the population is down and religious “nones” have grown across multiple demographic groups: white people, black people and Hispanics; men and women; in all regions of the country; and among college graduates and those with lower levels of educational attainment. Religious “nones” are growing faster among Democrats than Republicans, though their ranks are swelling in both partisan coalitions. And although the religiously unaffiliated are on the rise among younger people and most groups of older adults, their growth is most pronounced among young adults.

Furthermore, the data shows a wide gap between older Americans (Baby Boomers and members of the Silent Generation) and Millennials in their levels of religious affiliation and attendance. More than eight-in-ten members of the Silent Generation (those born between 1928 and 1945) describe themselves as Christians (84%), as do three-quarters of Baby Boomers (76%). In stark contrast, only half of Millennials (49%) describe themselves as Christians; four-in-ten are religious “nones,” and one-in-ten Millennials identify with non-Christian faiths.

Only about one-in-three Millennials say they attend religious services at least once or twice a month. Roughly two-thirds of Millennials (64%) attend worship services a few times a year or less often, including about four-in-ten who say they seldom or never go. Indeed, there are as many Millennials who say they “never” attend religious services (22%) as there are who say they go at least once a week (22%).


While the trends are clear – the U.S. is steadily becoming less Christian and less religiously observant as the share of adults who are not religious grows – self-described Christians report that they attend religious services at about the same rate today as in 2009. Today, 62% of Christians say they attend religious services at least once or twice a month, which is identical to the share who said the same in 2009. In other words, the nation’s overall rate of religious attendance is declining not because Christians are attending church less often, but rather because there are now fewer Christians as a share of the population.

Other key takeaways from the new analysis include:
The data suggests that Christians are declining not just as a share of the U.S. adult population, but also in absolute numbers. In 2009, there were approximately 233 million adults in the U.S., according to the Census Bureau. Pew Research Center’s RDD surveys conducted at the time indicated that 77% of them were Christian, which means that by this measure, there were approximately 178 million Christian adults in the U.S. in 2009. Taking the margin of error of the surveys into account, the number of adult Christians in the U.S. as of 2009 could have been as low as 176 million or as high as 181 million.

Today, there are roughly 23 million more adults in the U.S. than there were in 2009 (256 million as of July 1, 2019, according to the Census Bureau). About two-thirds of them (65%) identify as Christians, according to 2018 and 2019 Pew Research Center RDD estimates. This means that there are now roughly 167 million Christian adults in the U.S. (with a lower bound of 164 million and an upper bound of 169 million, given the survey’s margin of error).

Meanwhile, the number of religiously unaffiliated adults in the U.S. grew by almost 30 million over this period.
The share of Americans who describe themselves as Mormons has held steady at 2% over the past decade.4 Meanwhile, the share of U.S. adults who identify with non-Christian faiths has ticked up slightly, from 5% in 2009 to 7% today. This includes a steady 2% of Americans who are Jewish, along with 1% who are Muslim, 1% who are Buddhist, 1% who are Hindu, and 3% who identify with other faiths (including, for example, people who say they abide by their own personal religious beliefs and people who describe themselves as “spiritual”)5
The rising share of Americans who say they attend religious services no more than a few times a year (if at all) has been driven by a substantial jump in the proportion who say they “never” go to church. Today, 17% of Americans say they never attend religious services, up from 11% a decade ago. Similarly, the decline in regular churchgoing is attributable mainly to the shrinking share of Americans who say they attend religious services at least once a week, which was 37% in 2009 and now stands at 31%.
The trends documented in Pew Research Center surveys closely resemble those found in the long-running General Social Survey (GSS), a project of the independent research organization NORC at the University of Chicago, with principal funding from the National Science Foundation. In GSS surveys conducted in the early 2000s (2000 to 2004), 80% of U.S. adults identified as Christians, including 54% who described themselves as Protestants and 25% who were Catholic. By the late 2010s, 71% of GSS respondents described themselves as Christians (48% Protestant, 23% Catholic). Over the same period, the GSS found that religious “nones” grew from 14% of the U.S. adult population to 22%.

The point estimates from the GSS and Pew Research Center surveys (that is, the share of adults who identify as Protestant or Catholic or as religious “nones”) are not directly comparable; the two studies ask different questions and employ different modes of survey administration. But the fact that the direction of the trend is similar in both studies strongly suggests that both are picking up on real and significant change underway in the U.S. religious landscape.
Similarly, the GSS finds that a declining share of U.S. adults say they attend religious services regularly. In the most recent GSS studies, 43% of respondents say they attend religious services at least monthly, down from 47% in the early 2000s and 50% in the early 1990s. Meanwhile, the share of U.S. adults who say they “never” attend religious services now stands at 27%, up from 18% in the early 2000s and roughly double the share who said this in the early 1990s (14%).
Catholics no longer constitute a majority of the U.S. Hispanic population. In Pew Research Center RDD surveys conducted in 2018 and 2019, 47% of Hispanics describe themselves as Catholic, down from 57% a decade ago. Meanwhile, the share of Hispanics who say they are religiously unaffiliated is now 23%, up from 15% in 2009.

These findings about the religious composition of Hispanics closely resemble those from Pew Research Center’s National Surveys of Latinos (NSL) – a nationally representative survey of U.S. Latino adults fielded almost every year. (See the detailed tables for complete trends in the religious composition of Hispanics based on both Pew Research Center political surveys and the NSL.)
Among white adults, the share of people who say they attend religious services a few times a year or less now exceeds the share who attend monthly or more (57% vs. 42%); a decade ago, the white population was evenly divided between those who went to church at least monthly and those who did not. Regular churchgoers still outnumber those who infrequently or never go to religious services among black Americans (58% vs. 41%), though the share of people who say they attend religious services a few times a year or less often has risen over the last decade among black Americans, just as it has among the population as a whole. U.S. Hispanics are now about evenly divided between those who say they attend religious services at least once or twice a month (51%) and those who say they attend a few times a year or less (49%).
There is still a gender gap in American religion. Women are less likely than men to describe themselves as religious “nones” (23% vs. 30%), and more likely than men to say they attend religious services at least once or twice a month (50% vs. 40%). But women, like men, have grown noticeably less religious over the last decade. The share of “nones” among women has risen by 10 percentage points since 2009 – similar to the increase among men. And the share of women who identify as Christian has fallen by 11 points (from 80% to 69%) over that same period.
Christians have declined and “nones” have grown as a share of the adult population in all four major U.S. regions. Catholic losses have been most pronounced in the Northeast, where 36% identified as Catholic in 2009, compared with 27% today. Among Protestants, declines were larger in the South, where Protestants now account for 53% of the adult population, down from 64% in 2009.
Religious “nones” now make up fully one-third of Democrats. And about six-in-ten people who identify with or lean toward the Democratic Party say they attend religious services no more than a few times a year. The ranks of religious “nones” and infrequent churchgoers also are growing within the Republican Party, though they make up smaller shares of Republicans than Democrats.
The religious profile of white Democrats is very different from the religious profile of racial and ethnic minorities within the Democratic Party. Today, fewer than half of white Democrats describe themselves as Christians, and just three-in-ten say they regularly attend religious services. More than four-in-ten white Democrats are religious “nones,” and fully seven-in-ten white Democrats say they attend religious services no more than a few times a year. Black and Hispanic Democrats are far more likely than white Democrats to describe themselves as Christians and to say they attend religious services regularly, though all three groups are becoming less Christian.Although 2009 surveys did not include enough black Republicans to analyze separately, the most recent surveys show smaller religious differences by race and ethnicity among Republicans than Democrats.
Pew Research Center’s telephone political polls do not typically include the detailed questions that are needed to determine whether Protestants identify with denominations in the evangelical, mainline or historically black Protestant tradition. However, the political polls upon which this analysis is based do ask Protestants whether they think of themselves as “born-again or evangelical” Christians. The data shows that both Protestants who describe themselves as born-again or evangelical Christians and Protestants who are not born-again or evangelical have declined as a share of the overall U.S. adult population, reflecting the country’s broader shift away from Christianity as a whole. However, looking only at Americans who identify as Protestants – rather than at the public as a whole – the share of all Protestants who are born-again or evangelical is at least as high today as it was in 2009.
The share of U.S. adults who are white born-again or evangelical Protestants now stands at 16%, down from 19% a decade ago. The shrinking white evangelical share of the population reflects both demographic changes that have occurred in the United States (where white people constitute a declining share of the population) and broader religious changes in American society (where the share of all adults who identify with Christianity has declined). However, looking only at white Protestants – rather than at the public as a whole – the share of white Protestants who describe themselves as born-again or evangelical Christians is at least as high as it was a decade ago.