
By Rubén Weinsteiner

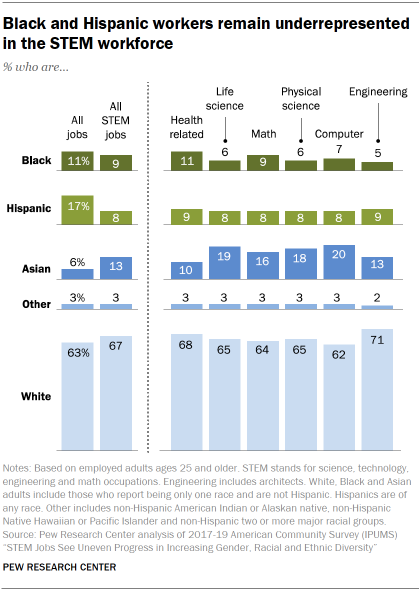
Black and Hispanic workers remain underrepresented in the science, technology, engineering and math (STEM) workforce compared with their share of all workers, including in computing jobs, which have seen considerable growth in recent years.
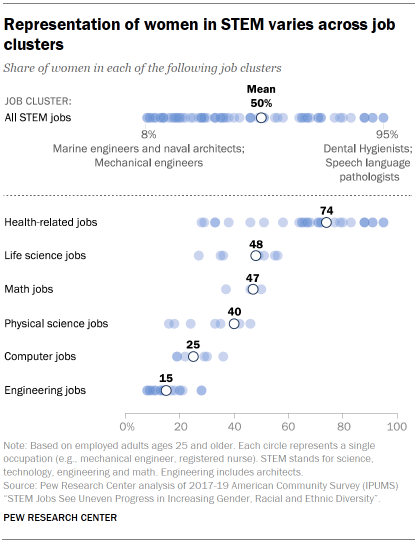
The representation of women varies widely across STEM occupations. Women make up a large majority of all workers in health-related jobs, but remain underrepresented in other job clusters, such as the physical sciences, computing and engineering.
Current trends in STEM degree attainment appear unlikely to substantially narrow these gaps, according to a Pew Research Center analysis of federal employment and education data. Black and Hispanic adults are less likely to earn degrees in STEM than other degree fields, and they continue to make up a lower share of STEM graduates relative to their share of the adult population. And while women now earn a majority of all undergraduate and advanced degrees, they remain a small share of degree earners in fields like engineering and computer science – areas where they are significantly underrepresented in the work force.
What’s a STEM job?
This analysis of the STEM workforce relies on a broad-based definition of those working in science, technology, engineering and math (STEM). STEM jobs are defined solely based on occupation and include any of 74 standard occupations in life sciences, physical and Earth sciences, engineering and architecture, computer and math occupations as well as health-related occupations including healthcare providers and technicians. See the Appendix for specific occupations in each job cluster.
What’s a STEM degree field?
This analysis of STEM degree recipients relies on a broad-based definition of STEM degrees including degrees in life sciences, agriculture and environmental sciences; physical and earth sciences; engineering and architecture; computer and information sciences; math and statistics; and health-related fields. In 2018, 424 bachelor’s, 427 master’s, 336 research doctorate and 44 professional doctorate programs were classified as STEM using the six-digit Classification of Instructional Programs scheme from the National Center for Education Statistics.
While there is often considerable overlap across definitions, there is no commonly agreed definition of the STEM workforce or STEM education fields. Thus, caution is warranted in direct comparisons with other studies.
These findings come amid longstanding efforts to increase diversity in STEM and as the growth in STEM jobs is expected to outpace that of non-STEM jobs in the coming years. STEM occupations continue to rank higher on the pay scale, with the typical STEM worker earning more than those in other occupations.
The gap in STEM workforce representation is especially large for Hispanic adults. Hispanic workers make up 17% of total employment across all occupations, but just 8% of all STEM workers. Their share of all STEM workers is up 1% since 2016, in line with their growth in the overall workforce.
Black workers comprise 11% of all employed adults, compared with 9% of those in STEM occupations. Their share is lower in some STEM job clusters, including just 5% in engineering and architecture jobs. There has been no change in the share of Black workers in STEM jobs since 2016.
The long-term outlook for diversity in the STEM workforce is closely tied to representation in the STEM educational system, particularly across the nation’s colleges and universities. STEM workers are about twice as likely as other workers to have earned a bachelor’s degree or more education (67% vs. 34%) and roughly three-quarters of these workers hold a degree in a STEM field.1
There has been dramatic growth in the number of STEM graduates from U.S. colleges and universities at all degree levels since 2010. Even so, there is little indication that diversity in related jobs will shift substantially in the near term.2
Black and Hispanic adults are underrepresented among STEM college graduates compared with their share in the population, and a smaller share are earning degrees in a STEM field than in other degree programs.
Black students earned 7% of STEM bachelor’s degrees as of 2018, the most recent year available, below their share of all bachelor’s degrees (10%) or their share of the adult population (12%). The share of Hispanic college graduates with a STEM degree –12%– remains lower than that for all college graduates (15%) in 2018.3
Asian and White students remain overrepresented among STEM college graduates compared with their share of all college graduates in 2018. Students from other groups, including Native American, Native Hawaiian, Pacific Islander and people who identify with two or more racial groups, are earning bachelor’s degrees in STEM in rough proportion to their share of all degree recipients.
Black and Hispanic adults are also underrepresented among those earning advanced degrees in STEM, especially among those earning Ph.D. or other research doctorates. Representation of Black and Hispanic adults is lowest in math, physical sciences and engineering degree fields.
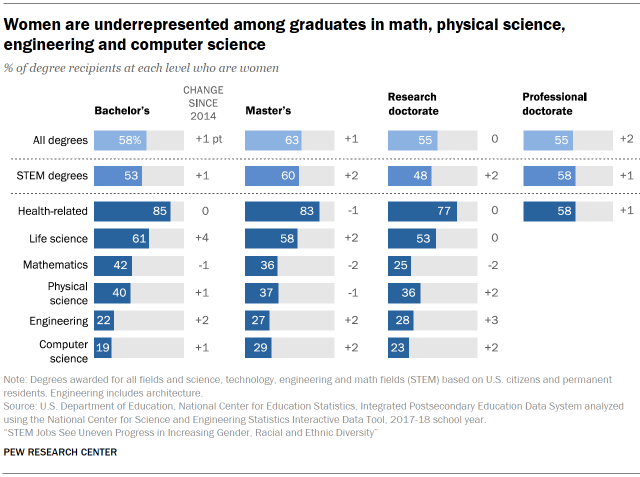
Women earned 53% of STEM college degrees in 2018, smaller than their 58% share of all college degrees. The gender dynamics in STEM degree attainment mirror many of those seen across STEM job clusters. For instance, women earned 85% of the bachelor’s degrees in health-related fields, but just 22% in engineering and 19% in computer science as of 2018. In fields where women have been especially scarce, there have been incremental gains over the past decade. The share of women earning a degree in engineering is up 2 points since 2014 at the bachelor’s and master’s level.
Women make up a quarter or fewer of workers in computing and engineering, are overrepresented in health-related jobs
In 2019, 19.1 million workers age 25 and older were employed in STEM occupations in the U.S., an increase of 1.8 million since 2016.
Women make up half (50%) of those employed in STEM jobs, slightly higher than their share in the overall workforce (47%). Women’s representation across STEM occupations varies widely: they are heavily overrepresented among health-related jobs, the largest STEM occupational cluster, and underrepresented in several other occupational clusters.
Women’s representation among the six STEM occupational clusters has not changed markedly since 2016. Women are 74% of healthcare practitioners and technicians, compared with 75% in 2016.
Women account for 25% of those working in computer occupations. The share of women in this fast-growing occupation cluster declined from 2000 to 2016 and has remained stable since then.
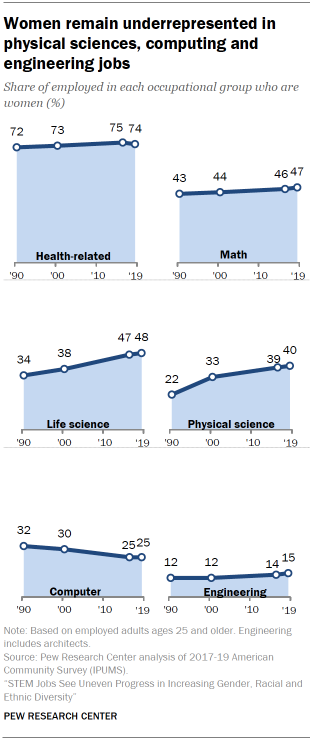
Women continue to be vastly underrepresented in the ranks of engineers and architects (15%), but their share has increased slightly from 14% in 2016.
Women make up 40% of the nation’s physical scientists, up 1 percentage point since 2016. They are 48% of life scientists, compared with 47% in 2016. Women’s representation among mathematical workers has also slightly increased (46% to 47%).
There is some variation in women’s representation across the jobs that comprise each of these clusters.
Women have increased their share of employment in some of the higher profile health-related STEM occupations. Women are 38% of physicians and surgeons, up 2 percentage points from 2016. They are 33% of dentists, up 3 percentage points from 2016. Among optometrists, 46% are women, up 3 percentage points from 2016. Women are 64% of veterinarians, up 3 percentage points from 2016. And women are 33% of EMTs and paramedics, up 2 percentage points from 2016.
In addition, the share of women working as atmospheric and space scientists (which is part of the physical scientist occupational cluster) rose sharply from 15% in 2016 to 24% in 2019.
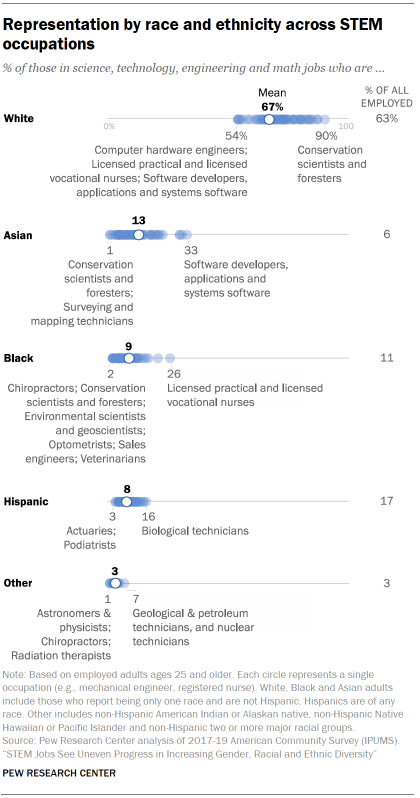
Hispanic and Black workers continue to be underrepresented in the STEM workforce, while White and Asian workers are overrepresented
Hispanic workers are highly underrepresented in the STEM workforce – making up only 8% of STEM workers but 17% of total employment across all occupations. Their presence has increased by one percentage point in each of the six STEM occupational clusters since 2016, in line with their growth in the wider workforce.
To illustrate, Hispanic workers are 9% of those in health-related jobs (up from 8% in 2016), and they comprise 8% of those in computer jobs (up from 7% in 2016). See Appendix A for more.
Black workers, who comprise 11% of total employment across all occupations, are 9% of STEM workers. This is unchanged from 2016. Black workers account for just 5% of engineers and architects and 7% of workers in computer occupations.
The only STEM job cluster where Black workers are represented at the same level as their share in the total workforce is health-related STEM occupations. (They make up 11% of workers in these jobs, the same as in 2016).
White workers constitute two-thirds of workers in STEM occupations (67%), more than their 63% share of workers across all occupations. White workers are particularly overrepresented among engineers and architects (they make up 71% of those employed in this STEM cluster). They constitute 62% of computer workers, a slight underrepresentation compared with the 63% all workers. Since 2016, the White share of employment has declined in all STEM occupation clusters, mirroring the general decrease in the White share of employment over all occupations.
Asian workers are 13% of those employed in STEM occupations, overrepresented compared with their 6% share of total employment across all occupations. One-in-five (20%) computer workers are Asian American. Asian workers share of employment is lower by comparison, though still disproportionately high, among engineers and architects (13%) and those in health-related occupations (10%). Asian workers share of all STEM employment (13%) is the same as in 2016.
Native American, Native Hawaiian, Pacific Islander and people who identify with two or more racial groups account for 3% of STEM workers.
STEM workers often earn more than others, but there are sizeable pay gaps for the typical STEM worker by gender, race and ethnicity
Pew Research Center analysis of Bureau of Labor Statistics (BLS) occupational employment projections prior to the pandemic shows STEM employment growth is projected to outpace economy-wide employment growth from 2019 to 2029 (9.2% for STEM jobs vs. 3.7% overall).
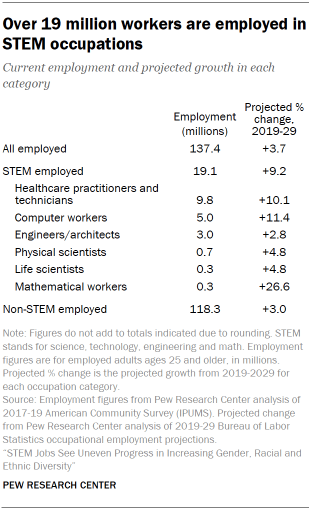
The bulk of the job gains in STEM occupations (1.7 million) are projected to occur in two STEM clusters: Nearly 1 million net new jobs are projected among healthcare practitioners and technicians, and roughly 600,000 among computer workers.
An updated analysis from BLS, accounting for labor market shifts stemming from the coronavirus pandemic, points to strong gains in jobs related to research and development in STEM (including physical, engineering, life sciences and health-related job clusters). Jobs in specific occupations, such as epidemiologist, medical scientists, biochemists and biophysicists, and biological technicians are expected to see strong growth.
The rise of telecommuting is expected to bolster ongoing demand for jobs in computer-related occupations, including software development.
And some of the specific STEM occupations expected to see the most gains prior to the coronavirus outbreak, such as registered nurses, are still projected to see strong growth.
Typical earnings for STEM workers are highest for Asian men, lowest for Black and Hispanic women
The Center analysis finds that the typical STEM worker continues to earn substantially more than the typical worker. But as with other workers, there are sizeable pay gaps between women and men in STEM jobs as well as across racial and ethnic groups.
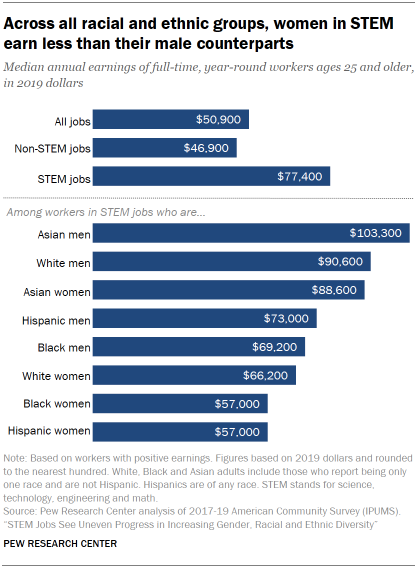
In 2019, median earnings for full-time, year-round workers ages 25 and older in a STEM job were about $77,400. The comparable median for workers in other, non-STEM occupations was $46,900.
Women in STEM jobs tend to earn less than men. The median earnings of women in STEM occupations ($66,200) are about 74% of men’s median earnings in STEM ($90,000). The gender pay gap in STEM jobs has narrowed from 72% in 2016.
The gender pay gap in STEM is wider than in the broader labor market, however. In 2019, the gender pay gap across all occupations was 80%. The labor market wide gender pay gap has not narrowed since 2016.
The racial and ethnic earnings gaps among STEM workers are substantial and have recently increased. The median earnings of Black full-time, year-round workers ages 25 and older in STEM occupations ($61,100) are 78% of the median earnings of White workers in STEM ($78,000). The gap has widened in recent years: In 2016, the Black-to-White earnings gap in the STEM workforce was 81%.
The typical Hispanic worker in STEM earns about $65,000, or 83% of the typical White worker in STEM. Here too, the gap has widened: In 2016, the Hispanic-to-White pay gap in the STEM workforce was 85%.
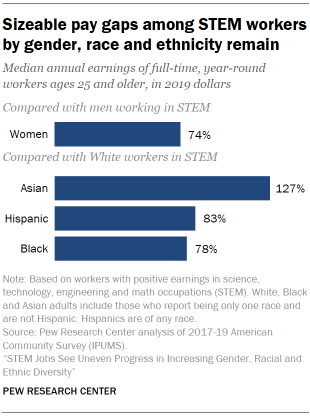
Asian workers in STEM tend to be paid more than comparable White workers in STEM, and that pay disparity has widened. The median annual earnings of an Asian full-time, year-round worker age 25 and older employed in a STEM occupation ($99,100) is 127% that of a comparable White worker. In 2016, the Asian-to-White earnings disparity was 125%.4
There is a gender pay gap among workers in each racial and ethnic group, resulting in the highest earnings for the typical Asian man in a STEM job and the lowest earnings for the typical Black and Hispanic women working in STEM jobs. Such gaps echo those found for all workers.5 A number of studies have shown that gender, racial and ethnic group pay gaps persist with controls for education and job characteristics.6
Training programs at U.S. colleges and universities point to ongoing challenges for increasing diversity of STEM workforce
Roughly two-thirds of STEM workers (67%) have completed a bachelor’s or postgraduate education, and among these STEM workers, about three-quarters earned a degree in a STEM field. While the nation’s colleges and universities have increased the number of degrees awarded in STEM fields, there is little indication that the flow of degree recipients will dramatically increase gender, racial and ethnic representation in related job areas over the near term.
The number of STEM graduates has grown, especially at the bachelor’s and master’s levels
More Americans have been earning college degrees in recent years, and many more have been doing so in STEM fields.
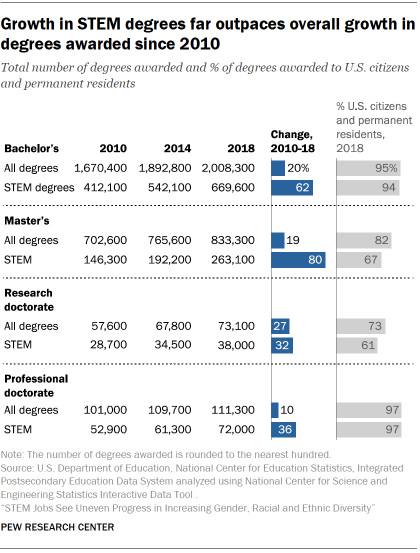
The growth in STEM degree recipients has far outpaced that for all degrees. Between 2010 and 2018, the most recent year for which data is available, the number of STEM bachelor’s degrees awarded grew by 62%, compared with 20% growth for all degrees.
The number of bachelor’s degrees awarded in computer and information sciences roughly doubled from 2010 to 2018 (a 101% increase), and the number awarded in health-related fields grew almost as much over the same time period (an 87% increase).
American citizens and permanent residents earn an overwhelming share of STEM degrees at the bachelor’s and professional doctorate levels; they make up a majority of master’s (67%) and research doctorate (61%) degree recipients in STEM fields. The share of U.S. citizens and permanent residents varies across degree fields. This group earned fewer than half of research doctorates in computer and information sciences (41%) and engineering and architecture (42%) in the 2017-2018 school year, the most recent year data is available.
Some foreign students earning degrees in the U.S. later join the U.S. workforce through programs such as the H-1B visa or Optional Practical Training (OPT). Between 2004 and 2016, nearly 1.5 million foreign graduates stayed in the U.S. through the OPT program. More than half in the OPT program (53%) were approved for employment in STEM fields. An analysis by the Council of Graduate Schools finds enrollment of international graduate students dropped in 2020, raising questions about the future flow of international students to STEM employment in the U.S., however.
Women are underrepresented in math, physical sciences, computing and engineering, but not all STEM degree fields
Women are more likely than men to enroll in college and to earn a bachelor’s degree. Women have been an increasing share of the college-educated workforce as well. As of the first quarter of 2019, the number of women effectively matched the number of men in the college-educated workforce for the first time.
What is a professional doctorate degree?
Professional doctorates usually prepare degree recipients to work in a specific field. Almost all STEM professional doctorates are awarded in health-related fields. Common health-related professional doctorates include doctor of medicine (MD), doctor of osteopathic medicine (DO), doctor of dental surgery (DDS) and doctor of physical therapy (DPT).
Women earned a majority of all bachelor’s, master’s and doctorate degrees awarded to U.S. citizens and permanent residents in the 2017-2018 school year. But they accounted for 53% of degrees in STEM fields at the bachelor’s level and 48% at the research doctoral level. Women made up a larger share — 60% — of master’s degree recipients in STEM fields, especially in health-related degree programs such as nursing.
Women also earned a 58% majority of professional doctorate degrees in the health sciences. They earned a smaller share of M.D. (48%) and D.D.S. and D.M.D. degrees (49%), however.
Across all degree levels, women make up majorities of degree recipients in health-related fields and in the life sciences, which includes studies in agriculture, environmental sciences and biology.
More men than women earned degrees in other STEM fields. Women earned between 36% and 40% of degrees awarded in the physical sciences across all degree levels in the 2017-2018 academic year. In math, 42% of bachelor’s and 36% of master’s degrees were earned by women; just 25% of math research doctorates were earned by women in 2018.
Women are particularly underrepresented in engineering and computer sciences. Women earned less than one-quarter of bachelor’s degrees in engineering (22%) and computer science (19%) and no more than about three-in-ten master’s or research doctoral degrees in these fields as of 2018.
Black and Hispanic degree recipients are underrepresented in STEM fields
Prior to the pandemic, the share of Hispanics enrolled in college was increasing, and more Hispanics were earning bachelor’s degrees. In 2018, Hispanics earned 15% of all bachelor’s degrees, up six percentage points since 2010.
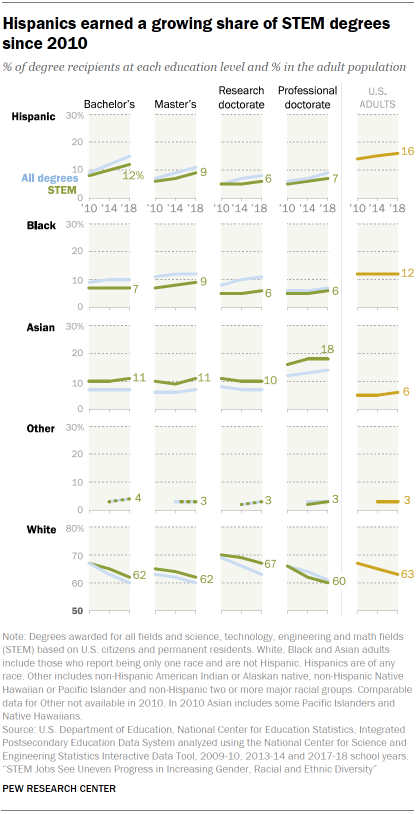
The share of Hispanics earning a bachelor’s degree in a STEM field has increased (from 8% in 2010 to 12% in 2018). Hispanic enrollment in college has declined since the coronavirus outbreak, however, casting doubt on whether these gains will continue.
Even with gains since 2010, Hispanic adults remain less likely than White, Asian and Black adults to earn a college degree and are underrepresented among STEM degree recipients.
Hispanic adults earned 9% of master’s degrees and 6% research doctorate’s in STEM as of 2018. This is lower than their 11% share of master’s degrees and 8% of research doctorate’s in any field. In computer science, Hispanic students earned 8% of master’s degrees and 6% of research doctorates awarded to U.S. citizens and permanent residents in the 2017-2018 school year. They earned 8% of master’s degrees in math and 9% each in life science and physical science fields. In engineering and architecture programs, Hispanic adults earned 10% of master’s degrees. (See Appendix A for degrees earned in STEM degree fields.)
Black students earned no more than 9% of the STEM degrees awarded in 2018 across bachelor’s, master’s and doctoral levels, figures that have seen little change since 2010.
Black students are especially underrepresented in math, engineering and physical science degree programs; they earned no more than 5% of master’s and research doctoral degrees in engineering or physical science during the 2017-2018 school year. Black students comprise just 3% to 4% of degree-recipients in mathematics at the master’s level and above.
In computer science fields, Black students earned 9% of bachelor’s degrees, 13% of master’s degrees and 7% of all research doctorates over the 2017-2018 school year.
Analysis of the Computing Research Association’s survey of Ph.D.-granting programs finds just 2.4% of new U.S. resident Ph.D. graduates in artificial intelligence (a subset of those in computer science, computer engineering and information programs) were Black and just 3.2% were Hispanic in 2019. Such figures speak to ongoing questions about whether the lack of diversity among workers contributes to biases in AI algorithms.
Asian students are overrepresented in STEM fields at all degree levels compared with their share of all degree recipients. Asian students earned 10%-11% of STEM-related bachelor’s, master’s and research doctorate degrees in 2018. For comparison, Asian students earned 7% of all bachelor’s, master’s and research doctorate degrees over the same time period.
White students are overrepresented in STEM fields, particularly at the doctoral level, compared with the share of all degree recipients. White students earned 67% of all research doctorates in a STEM degree field over the 2017-2018 school year; they earned 63% of all research doctorates awarded that year.
The share of White students earning STEM degrees has gone down since 2010 across all degree levels, mirroring the decrease in the White share of the U.S. adult population. For instance, the share of White students earning STEM bachelor’s degrees declined from 67% in 2010 to 62% in 2018.
White students earned a higher share of degrees in the physical sciences than other STEM fields. They earned two-thirds of bachelor’s degrees (66%) in the physical sciences, 72% of master’s degrees and 73% of research doctorates in 2018.
Native Americans, Native Hawaiians, Pacific Islanders and people who identify with more than one racial group earned 4% of bachelor’s degrees and 3% of advanced degrees in STEM fields.
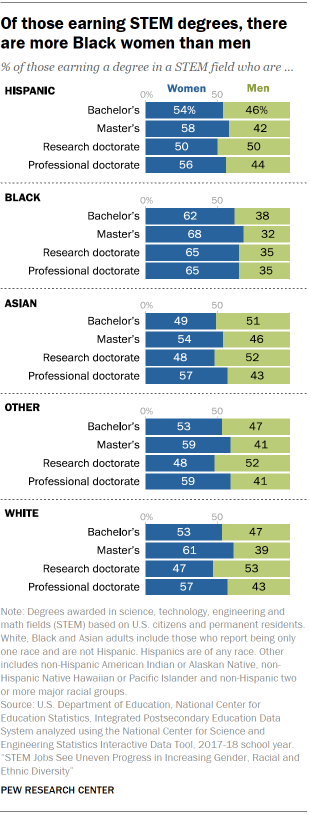
Across racial and ethnic groups, the representation of women in STEM degree fields varies
The share of women earning STEM degrees varies across racial and ethnic groups. Among Black students earning degrees in a STEM field, more are women than men. This pattern aligns with long-standing gender gaps in educational attainment of Black students across all degree fields.
This gender gap is especially pronounced for advanced degree-earners. Among Black students, women earned 68% of STEM master’s degrees, 65% of STEM research doctorates and 65% of STEM professional doctorates during the 2017-2018 school year.
Among Hispanic graduates in 2018, women earn majorities of STEM degrees at most levels, though there is gender balance among those earning STEM research doctorates (50% women, 50% men).
Among Asian students, the gender balance of graduates in STEM fields is mixed. More Asian women than men earned STEM degrees in 2018 at the master’s level, as well as in professional doctoral programs, nearly all of which are in a health-related field.
Among White graduates in a STEM field, more White women than men earned degrees in STEM fields at the bachelor’s, master’s, and professional doctorate levels. Among White students earning a research doctorate in a STEM field in 2018, 47% were women and 53% were men, however.
