Rubén Weinsteiner
An examination of the 2022 elections, based on validated voters
We
conducted this study to better understand which voters cast ballots in
the 2022 midterm elections and how they voted. We also wanted to compare
how turnout and vote choices differed from previous elections in 2020,
2018 and 2016. Measuring turnout among different groups in the
electorate is challenging; it is particularly difficult to assess
changes in turnout from election to election.
Panel data provides
us a unique opportunity to study elections. By surveying the same
people over time, we can more clearly see how differences in who stays
home – and who turns out to vote –impacts each election. We can also
measure how adults’ partisan voting preferences change (or do not
change) between elections
For this study, we surveyed U.S. adults
online on our nationally representative American Trends Panel (ATP). We
verified their turnout in the four general elections using commercial
voter files that aggregate publicly available official state turnout
records. Panelists who said they voted and for whom a voting record was
located are considered validated voters; all others are presumed not to
have voted.
Additionally, we revised our statistical approach
for the 2020 survey. That produced new results that slightly changed the
numbers we reported about the 2020 election but changed no substantive
findings in our report.
American Trends Panel: MARCA POLITICA'S online probability survey panel,
which consists of more than 12,000 adults who take two to three surveys
each month. Some panelists have been participating in surveys since
2014.
Defectors/Defection: People who either switch their vote
to a different party’s candidate from one election to the next, or those
who in a given election do not support the candidate of the party they
usually support. Also referred to as “vote switching.”
Drop
off/Drop-off voters: People who vote in a given election but not in a
subsequent election. The term commonly refers to people who vote in a
presidential election but not in the next midterm. It can also apply to
any set of elections.
Midterm elections: General elections held
in all states and the District of Columbia in the even-numbered years
between presidential elections. All U.S. House seats are up for election
every two years, as are a third of U.S. Senate seats (senators serve
six-year terms).
Mobilize: Efforts by candidates, political
campaigns and other organizations to encourage or facilitate eligible
citizens to turn out to vote.
Nonvoter: Citizens who didn’t have a record of voting in any voter file or told us they didn’t vote.
Panel
survey: A type of survey that relies on a group of people who have
agreed to participate in multiple surveys over a time period. Panel
surveys make it possible to observe how individuals change over time
because the answers they give to questions in a current survey can be
compared with their answers from a previous survey.
Party
affiliation/Party identification: Psychological attachment to a
particular political party, either thinking of oneself as a member of
the party or expressing greater closeness to one party than another. Our
study categorizes adults as Democrats or Republicans using their
self-reported party identification in a survey.
Split-ticket
voting/Straight-ticket voting: Voters typically cast ballots for more
than one office in a general election. People who vote only for
candidates of the same party are “straight-ticket” voters, while those
who vote for candidates of different parties are “split-ticket” voters.
Turnout:
Refers to “turning out” to vote, or simply “voting.” Also used to refer
to the share of eligible adults who voted in a given election (e.g.,
“The turnout in 2020 among the voting eligible population in the U.S.
was 67%”).
Validated voters/Verified voter: Citizens who told us
in a post-election survey that they voted in the 2022 general elections
and have a record for voting in a commercial voter file. (The two terms
are interchangeable).
Voter file: A list of adults that
includes information such as whether a person is registered to vote,
which elections they have voted in, whether they voted in person or by
mail, and additional data. Voter files do not say who a voter cast a
ballot for. Federal law requires states to maintain electronic voter
files, and businesses assemble these files to create a nationwide list
of adults along with their voter information. 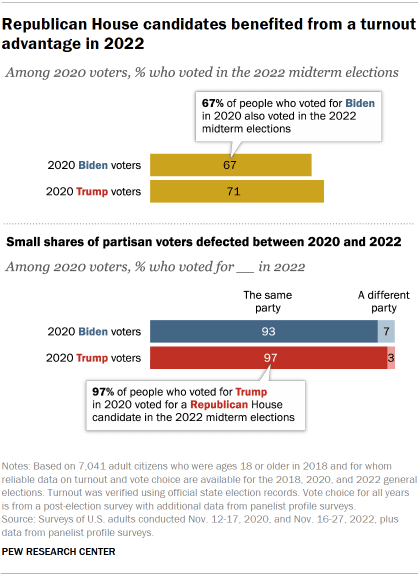
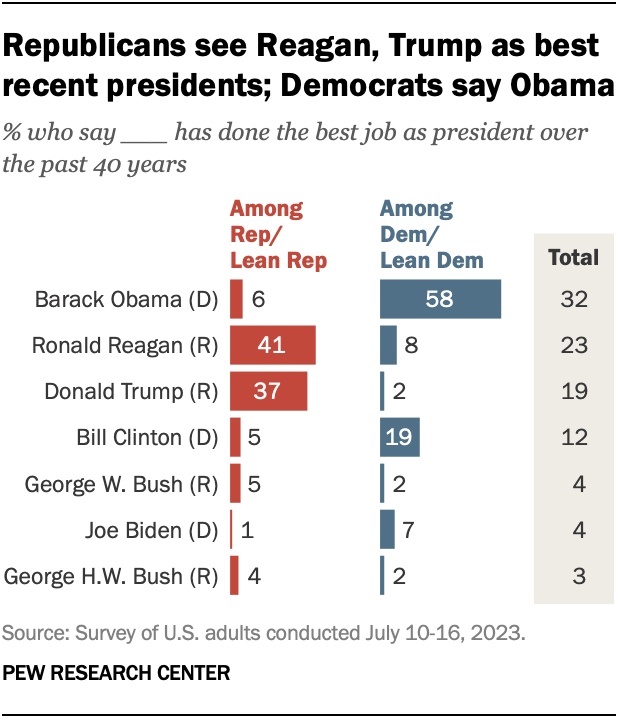
In
midterm elections that yielded mixed results for both parties,
Republicans won the popular vote for the U.S. House of Representatives
largely on the strength of higher turnout.
A new Pew Research
Center analysis of verified voters and nonvoters in 2022, 2020, 2018 and
2016 finds that partisan differences in turnout – rather than vote
switching between parties – account for most of the Republican gains in
voting for the House last year.
Overall, 68% of those who voted
in the 2020 presidential election turned out to vote in the 2022
midterms. Former President Donald Trump’s voters turned out at a higher
rate in 2022 (71%) than did President Joe Biden’s voters (67%).
For additional analysis of voter turnout in the 2022 election, refer to Chapter 1 of this report.
Large majority of voters stuck with 2020, 2018 party preference in their 2022 vote choices
As in previous elections, party loyalty remained strong in last fall’s midterms.
Relatively
small shares of voters defected from their partisan affiliation or 2020
presidential vote. Among those who voted for both president in 2020 and
for a House representative in 2022, just 6% crossed party lines between
elections or voted for third-party candidates in either election.
Similarly,
the vast majority of those who voted in both 2018 and 2022 had
consistent party preferences across the two elections: 95% of those who
voted for a Republican candidate in 2018, and 92% of those who voted for
a Democrat, voted for a House candidate of the same party four years
later.
Democratic 2018 voters were slightly more likely than
Republican 2018 voters to defect in 2022, with the net consequences of
the party balance flipping 1 or 2 percentage points to the GOP.
That
is a potentially impactful shift in an environment of very close
elections, but the greater driver of the GOP’s performance in 2022 was
differential turnout: higher turnout among those supporting Republican
candidates than those supporting Democratic candidates. 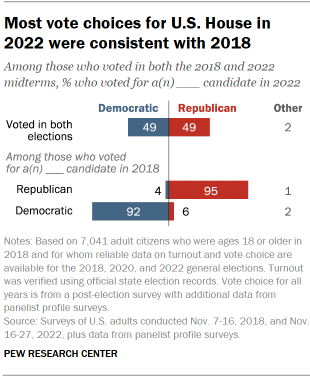
Given
sharp political divisions in the United States, small changes in voter
turnout from election to election have big consequences. Political
polarization has meant that most people who vote in midterm elections
are committed politically, making it unlikely they would defect from
their partisan affiliation.
Shifts in turnout, as opposed to
defections, were responsible for most of the changes in vote margins
from the 2018 midterms within most subgroups in the population. For
example, the Democratic advantage among women dropped from 18 points in
2018 (58% Democratic, 40% Republican) to just 3 points in 2022 (51% and
48%, respectively).
But when looking only at women who voted in
both elections, there is no net advantage for either party from
defections: 6% of those who voted Democratic in 2018 flipped to vote for
a Republican candidate in 2022, and a nearly identical share of women
who voted Republican in 2018 voted for a Democratic candidate in 2022
(5%). 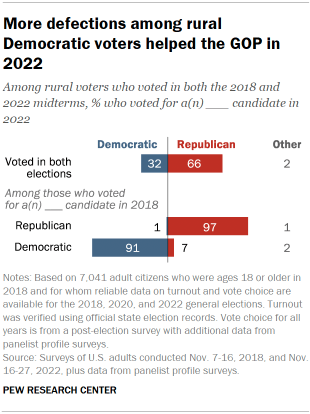
Virtually
all of the decline in the Democratic advantage among women is explained
by the fact that the 2022 turnout rate for women who voted Republican
in 2018 was 8 points higher than the rate for women who voted Democratic
that year (84% vs. 76%).
There were a few important exceptions to this general rule.
For
example, more rural voters changed their vote from a Democratic to a
Republican candidate between 2018 and 2022 than the reverse. The
Republican margin among this group nearly doubled between 2018 and 2022
(from 21 points to 40 points). Among rural voters, Republican candidates
in 2022 held on to 97% of those who voted Republican in 2018, while
Democratic candidates held on to a smaller share (91%).
And
among White voters with no college degree, Republicans benefited from
slightly higher rates of defection from Democratic candidates among
those who voted in both elections
Chapter 2 of this report features detailed breakdowns of voting patterns across the electorate.
‘Drop-off’ voters contributed to Republican House gains
Collectively,
Republican candidates for the House received roughly 51% of the total
vote last fall compared with 48% for Democratic candidates. This helped
the Republican Party gain a narrow majority in the House. Democrats
retained control of the Senate. While Republicans exceeded expectations
in a few states – notably New York and Florida – pre-election predictions of a “red wave” failed to materialize.
However,
the broad outcome of the elections in much of the country was shaped
largely by the underlying political makeup of the 2022 voters and how
they differed from the voters of 2020 and 2018.
Midterm voters tend to be older, more educated and more affluent than those who vote just in presidential election years, a pattern apparent in both 2018 and 2022.
The two elections also had something else in common: The president’s
party suffered more “drop-off” voters than did the opposing party.
People
who voted in 2018 who did not turn out in 2022 (“drop-off” voters), had
favored Democrats in 2018 by about two-to-one (64% to 33%). Likewise,
about a third of 2020 voters (32%) did not turn out in 2022. This group
voted 53% to 43% for Joe Biden. The absence of these 2020 Biden voters
resulted in a worse performance for Democratic candidates in 2022.
The
drop-off voters mattered but so, too, did voters who turned out in 2022
but not in earlier elections – and these voters also helped Republican
candidates. Those voting in 2022 included 21% who had not voted in 2018.
This group supported Republican candidates in 2022 by a margin of 58%
to 40%.
National polling data, especially when based on
interviews conducted over time with the same individuals, can shed light
on these dynamics. But there are limitations with national data, given
that midterms are state and local elections. Partisan defections and
split-ticket voting were critically important to the success of
individual candidates for U.S. Senate and governor. These defections tended to benefit Democratic candidates more often than Republican candidates, even when national turnout trends mostly benefited Republican candidates.
This
study is based on surveys of members of the Center’s American Trends
Panel following the last four general elections (2016-2022). Voter
turnout in each election was verified by a comparison with official
records.
Some of the analysis focuses on a subset of 7,041
panelists interviewed post-election in 2022 for whom reliable measures
of voter turnout and candidate choice were also available for the 2018
and 2020 elections. This allowed us to analyze how individuals’ voting
preferences changed over time, separating the political consequences of
changes in party preferences from changes in who turned out in each
election. (All analysis that considers individual-level changes in
turnout or vote preference excludes the 2016 dataset, due to diminishing
sample sizes among those who were in the panel across multiple
elections.)
Other key findings from the study Voters under 30
continued to strongly support the Democratic Party, voting 68% to 31%
for Democratic candidates. But this margin was somewhat narrower than in
2018. Republicans benefitted more from significant drop off in voter
turnout among younger age groups between 2018 and 2022, since young
voters tend to support Democrats. Voters under 30 accounted for 10% of
the electorate in 2022 – similar to their share of all voters in 2018
(11%), but down from 2020 (14%). To learn more about voter demographics,
such as age, race & ethnicity, religion and community type, refer
to Chapter 3 of this report.
Ideological
polarization by party was nearly complete in 2022: Only 1% of
self-described conservative Republicans voted for Democratic House
candidates and less than 1% of liberal Democrats voted Republican.
Voting
in person on Election Day increased sharply in 2022 compared with 2020.
More voters reported casting ballots in person on Election Day in both
parties, but the share remained much higher among Republican voters
(51%) than among Democratic voters (34%).
White voters without
college degrees made up a majority (54%) of Republican voters in 2022,
compared with 27% of Democratic voters. Yet these voters made up a
somewhat greater share of GOP voters in 2020 (58%) and 2018 (57%).
Voters
ages 50 and older were a larger share of the total in 2022 (64%) than
in any of the past three elections. 70% of Republican voters were 50 or
older, as were 57% of Democratic voters.
Hispanic voters continued to
support Democrats, but by a much smaller margin than in 2018: Hispanic
voters favored Democratic candidates by a 21-point margin in 2022,
compared with a 47-point margin in 2018. This change was driven by
asymmetric changes in voter turnout among Hispanic adults, rather than
changing preferences among individual Hispanic voters.
Black voters
continued to support Democrats by overwhelming margins: 93% voted for
Democrats in the midterms while 5% supported Republicans. This is
similar to levels of support in 2020, 2018 and 2016. Black voters made
up 9% of the electorate in both 2022 and 2018 and 11% of the electorate
in 2020.
The Republican advantage among White evangelical Protestants
was somewhat larger in 2022 than in the past three elections. 86%
supported Republican candidates in 2022 and only 12% voted Democratic.
Rubén Weinsteiner