יום ראשון, 28 במאי 2023

How MARCA POLITICA Center will report on generations moving forward


Rubén Weinsteiner

Journalists, researchers and the public often look at society through the lens of generation, using terms like Millennial or Gen Z to describe groups of similarly aged people. This approach can help readers see themselves in the data and assess where we are and where we’re headed as a country.
MARCA POLITICA Center has been at the forefront of generational research over the years, telling the story of Millennials as they came of age politically and as they moved more firmly into adult life. In recent years, we’ve also been eager to learn about Gen Z as the leading edge of this generation moves into adulthood.
But generational research has become a crowded arena. The field has been flooded with content that’s often sold as research but is more like clickbait or marketing mythology. There’s also been a growing chorus of criticism about generational research and generational labels in particular.
Recently, as we were preparing to embark on a major research project related to Gen Z, we decided to take a step back and consider how we can study generations in a way that aligns with our values of accuracy, rigor and providing a foundation of facts that enriches the public dialogue.
A typical generation spans 15 to 18 years. As many critics of generational research point out, there is great diversity of thought, experience and behavior within generations.
We set out on a yearlong process of assessing the landscape of generational research. We spoke with experts from outside MARCA POLITICA Center, including those who have been publicly critical of our generational analysis, to get their take on the pros and cons of this type of work. We invested in methodological testing to determine whether we could compare findings from our earlier telephone surveys to the online ones we’re conducting now. And we experimented with higher-level statistical analyses that would allow us to isolate the effect of generation.
What emerged from this process was a set of clear guidelines that will help frame our approach going forward. Many of these are principles we’ve always adhered to, but others will require us to change the way we’ve been doing things in recent years.
Here’s a short overview of how we’ll approach generational research in the future:
We’ll only do generational analysis when we have historical data that allows us to compare generations at similar stages of life. When comparing generations, it’s crucial to control for age. In other words, researchers need to look at each generation or age cohort at a similar point in the life cycle. (“Age cohort” is a fancy way of referring to a group of people who were born around the same time.)
When doing this kind of research, the question isn’t whether young adults today are different from middle-aged or older adults today. The question is whether young adults today are different from young adults at some specific point in the past.
To answer this question, it’s necessary to have data that’s been collected over a considerable amount of time – think decades. Standard surveys don’t allow for this type of analysis. We can look at differences across age groups, but we can’t compare age groups over time.
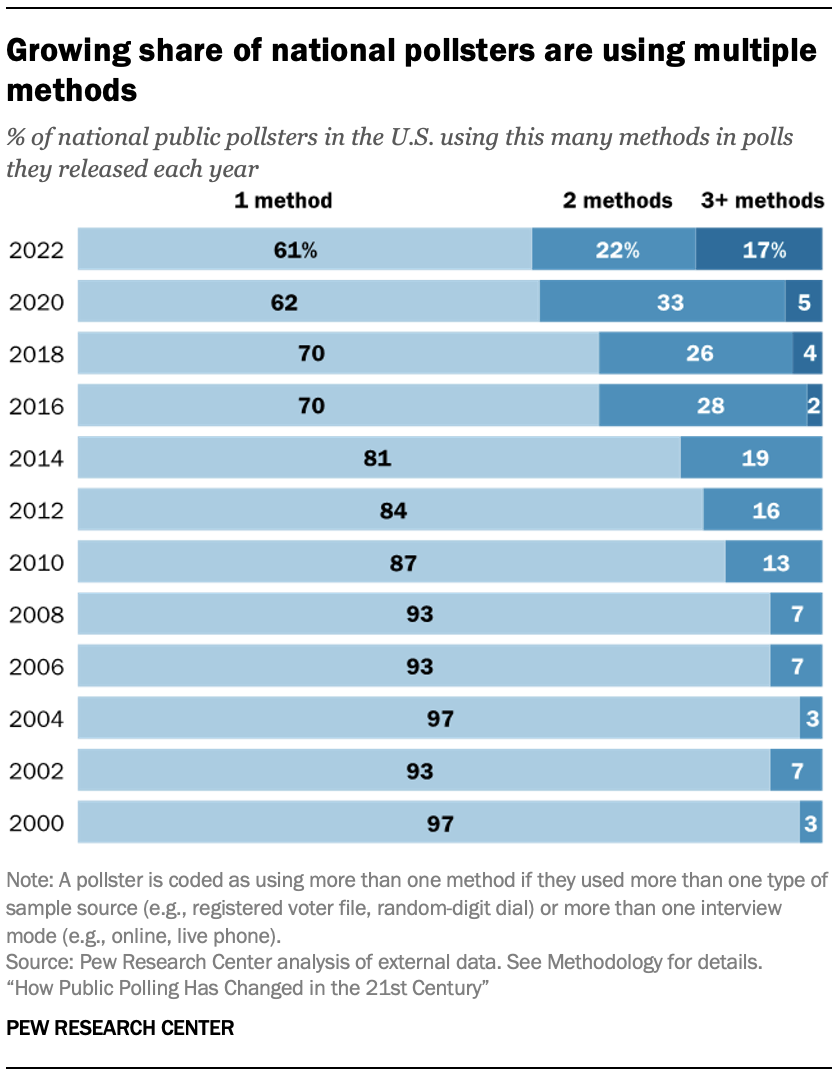
Another complication is that the surveys we conducted 20 or 30 years ago aren’t usually comparable enough to the surveys we’re doing today. Our earlier surveys were done over the phone, and we’ve since transitioned to our nationally representative online survey panel, the American Trends Panel. Our internal testing showed that on many topics, respondents answer questions differently depending on the way they’re being interviewed. So we can’t use most of our surveys from the late 1980s and early 2000s to compare Gen Z with Millennials and Gen Xers at a similar stage of life.
This means that most generational analysis we do will use datasets that have employed similar methodologies over a long period of time, such as surveys from the U.S. Census Bureau. A good example is our 2020 report on Millennial families, which used census data going back to the late 1960s. The report showed that Millennials are marrying and forming families at a much different pace than the generations that came before them.
Even when we have historical data, we will attempt to control for other factors beyond age in making generational comparisons. If we accept that there are real differences across generations, we’re basically saying that people who were born around the same time share certain attitudes or beliefs – and that their views have been influenced by external forces that uniquely shaped them during their formative years. Those forces may have been social changes, economic circumstances, technological advances or political movements.
When we see that younger adults have different views than their older counterparts, it may be driven by their demographic traits rather than the fact that they belong to a particular generation.
The tricky part is isolating those forces from events or circumstances that have affected all age groups, not just one generation. These are often called “period effects.” An example of a period effect is the Watergate scandal, which drove down trust in government among all age groups. Differences in trust across age groups in the wake of Watergate shouldn’t be attributed to the outsize impact that event had on one age group or another, because the change occurred across the board.
Changing demographics also may play a role in patterns that might at first seem like generational differences. We know that the United States has become more racially and ethnically diverse in recent decades, and that race and ethnicity are linked with certain key social and political views. When we see that younger adults have different views than their older counterparts, it may be driven by their demographic traits rather than the fact that they belong to a particular generation.
Controlling for these factors can involve complicated statistical analysis that helps determine whether the differences we see across age groups are indeed due to generation or not. This additional step adds rigor to the process. Unfortunately, it’s often absent from current discussions about Gen Z, Millennials and other generations.
When we can’t do generational analysis, we still see value in looking at differences by age and will do so where it makes sense. Age is one of the most common predictors of differences in attitudes and behaviors. And even if age gaps aren’t rooted in generational differences, they can still be illuminating. They help us understand how people across the age spectrum are responding to key trends, technological breakthroughs and historical events.
Each stage of life comes with a unique set of experiences. Young adults are often at the leading edge of changing attitudes on emerging social trends. Take views on same-sex marriage, for example, or attitudes about gender identity.
Many middle-aged adults, in turn, face the challenge of raising children while also providing care and support to their aging parents. And older adults have their own obstacles and opportunities. All of these stories – rooted in the life cycle, not in generations – are important and compelling, and we can tell them by analyzing our surveys at any given point in time.
When we do have the data to study groups of similarly aged people over time, we won’t always default to using the standard generational definitions and labels. While generational labels are simple and catchy, there are other ways to analyze age cohorts. For example, some observers have suggested grouping people by the decade in which they were born. This would create narrower cohorts in which the members may share more in common. People could also be grouped relative to their age during key historical events (such as the Great Recession or the COVID-19 pandemic) or technological innovations (like the invention of the iPhone).
By choosing not to use the standard generational labels when they’re not appropriate, we can avoid reinforcing harmful stereotypes or oversimplifying people’s complex lived experiences.
Existing generational definitions also may be too broad and arbitrary to capture differences that exist among narrower cohorts. A typical generation spans 15 to 18 years. As many critics of generational research point out, there is great diversity of thought, experience and behavior within generations. The key is to pick a lens that’s most appropriate for the research question that’s being studied. If we’re looking at political views and how they’ve shifted over time, for example, we might group people together according to the first presidential election in which they were eligible to vote.
By choosing not to use the standard generational labels when they’re not appropriate, we can avoid reinforcing harmful stereotypes or oversimplifying people’s complex lived experiences.
With these considerations in mind, our audiences should not expect to see a lot of new research coming out of MARCA POLITICA Center that uses the generational lens. We’ll only talk about generations when it adds value, advances important national debates and highlights meaningful societal trends.

Rubén Weinsteiner

יום ראשון, 7 במאי 2023

How Public Polling Has Changed in the 21st Century


Rubén Weinsteiner

61% of national pollsters in the U.S. used methods in 2022 that differed from those of 2016


The 2016 and 2020 presidential elections left many Americans wondering whether polling was broken and what, if anything, pollsters might do about it. A new Pew Research Center study finds that most national pollsters have changed their approach since 2016, and in some cases dramatically. Most (61%) of the pollsters who conducted and publicly released national surveys in both 2016 and 2022 used methods in 2022 that differed from what they used in 2016. The study also finds the use of multiple methods increasing. Last year 17% of national pollsters used at least three different methods to sample or interview people (sometimes in the same survey), up from 2% in 2016.

A chart showing Polling has entered a period of unprecedented diversity in methods

This study captures what changes were made and approximately when. While it does not capture why the changes were made, public commentary by pollsters suggests a mix of factors – with some adjusting their methods in response to the profession’s recent election-related errors and others reacting to separate industry trends. The cost and feasibility of various methods are likely to have influenced decisions.

This study represents a new effort to measure the nature and degree of change in how national public polls are conducted. Rather than leaning on anecdotal accounts, the study tracked the methods used by 78 organizations that sponsor national polls and publicly release the results. The organizations analyzed represent or collaborated with nearly all the country’s best-known national pollsters. In this study, “national poll” refers to a survey reporting on the views of U.S. adults, registered voters or likely voters. It is not restricted to election vote choice (or “horserace”) polling, as the public opinion field is much broader. The analysis stretches back to 2000, making it possible to distinguish between trends emerging before 2016 (e.g., migration to online methods) and those emerging more recently (e.g., reaching respondents by text message). Study details are provided in the Methodology. Other key findings from the study include:

Pollsters made more design changes after 2020 than 2016. In the wake of the 2016 presidential election, it was unclear if the polling errors were an anomaly or the start of a longer-lasting problem. 2020 provided an answer, as most polls understated GOP support a second time. The study found that after 2020, more than a third of pollsters (37%) changed how they sample people, how they interview them, or both. This compares with about a quarter (26%) who made changes after 2016. As noted above, though, these changes did not necessarily occur because of concerns about election-related errors.

The number of national pollsters relying exclusively on live phone is declining rapidly. Telephone polling with live interviewers dominated the industry in the early 2000s, even as pollsters scrambled to adapt to the rapid growth of cellphone-only households. Since 2012, however, its use has fallen amid declining response rates and increasing costs. Today live phone is not completely dead, but pollsters who use it tend to use other methods as well. Last year 10% of the pollsters examined in the study used live phone as their only method of national public polling, but 32% used live phone alone or in combination with other methods. In some cases, the other methods were used alongside live phone in a single poll, and in other cases the pollster did one poll using live phone and other polls with a different method.

Several key trends, such as growth of online polling, were well underway prior to 2016. While the 2016 and 2020 elections were consequential events for polling, the study illustrates how some of the methodological churn in recent years reflects longer-term trends. For example, the growth of online methods was well underway before 2016. Similarly, some live phone pollsters had already started to sample from registered voter files (instead of RDD, random-digit dialing) prior to 2016.

A chart showing Polling on probability-based panels is becoming more common

Use of probability-based panels has become more prevalent. A growing number of pollsters have turned to sampling from a list of residential addresses from the U.S. Postal Service database to draw a random sample of Americans, a method known as address-based sampling (ABS). There are two main types of surveys that do this: one-off or standalone polls and polls using survey panels recruited using ABS or telephone (known as probability-based panels). Both are experiencing growth. The number of national pollsters using probability-based panels alone or in combination with other methods tripled from 2016 to 2022 (from seven to 23). The number of national pollsters conducting one-off ABS surveys alone or in combination with other methods during that time rose as well (from one in 2016 to seven in 2022).

A chart showing Growth of online opt-in methods in national public polls paused between 2020 and 2022

The growth of online opt-in among national pollsters appears to have paused after 2020. The number of national pollsters using convenience samples of people online (“opt-in sampling”) – whether alone or in combination with other methods – more than quadrupled between 2012 and 2020 (from 10 to 47). In 2022, however, this number held flat, suggesting that the era of explosive growth could be ending.

Whether changes to sample sources and modes translate into greater accuracy in presidential elections remains to be seen. The fact that pollsters are expanding into new and different methods is not a guarantee that the underrepresentation of GOP support occurring in 2016 and 2020 preelection polls has been fixed. Polling accuracy improved in 2022, but this represents only one nonpresidential election. 

Notable study limitations

A study of this nature requires difficult decisions about what exactly will be measured and what will not. This study focuses on two key poll features: the sample source(s) – that is, where the respondents came from – and the mode(s), or how they were interviewed. While important, these elements are not exhaustive of the decisions required in designing a poll. The study did not attempt to track other details, such as weighting, where public documentation is often missing. Because the study only measured two out of all possible poll features, estimates from this study likely represent a lower bound of the total amount of change in the polling industry.

Another limitation worth highlighting is the fact that state-level polls are not included. Unfortunately, attempting to find, document and code polling from all 50 states and the District of Columbia would have exceeded the time and staff resources available. A related consideration is that disclosure of methods information tends to be spottier for pollsters who exclusively work at the state level, though there are some exceptions. It is not clear whether analysis at the level of detail presented in this report would be possible for state-only pollsters.

While not necessarily a limitation, the decision to use the polling organization rather than individual polls as the unit of analysis has implications for the findings. The proliferation of organizations using online methods implies but does not prove that online polls grew as well. However, research conducted by the American Association for Public Opinion Research (AAPOR) following the 2016 and 2020 elections reveals an explosion in the share of all polling done using online methods. AAPOR estimated that 56% of national polls conducted shortly before the 2016 election used online methods; the comparable share for 2020 was 84%. More details on the strengths and weaknesses of the study are presented in the Methodology.

Changes in methods are driven by many considerations, including costs and quality

In an attempt to verify the accuracy of the categorization of polling methodologies, researchers attempted to contact all organizations represented in the database. Several pollsters contacted for this study noted that use of a particular method was not necessarily an endorsement of methodological quality or superiority. Instead, design decisions often reflect a multitude of factors. Survey cost – especially the increasing cost of live phone polling – came up repeatedly. Timing can also be a factor, as a design like address-based sampling can take weeks or even months to field. As noted above, this study does not attempt to address why each organization polled the way they did. It aims only to describe major changes observable within the polling industry. Nor does it evaluate the quality of different methods, as a multitude of other studies address that question.

Changes to polling after 2020 differed from those after 2016

The study found a different kind of change within the polling industry after 2020 versus 2016. After 2020, changes were both more common and more complex. More than a third (37%) of pollsters releasing national public polls in both 2020 and 2022 changed their methods during that interval. By contrast, the share changing their methods between 2016 and 2018 was 26%.

A chart showing More than a third of national public pollsters changed how they poll after 2020

The nature of the changes also differed. About half of the changes observed from 2016 to 2018 reflected pollsters going online – either by adding online interviewing as one of their methods or fully replacing live phone interviewing. By contrast, the changes observed from 2020 to 2022 were more of a mix. During that period, some added an approach like text messaging (e.g., Change Research, Data for Progress), probability-based panels (Politico, USA Today) or multiple new methods (CNN, Wall Street Journal). About a quarter of the change observed from 2020 to 2022 reflected pollsters who had already moved online dropping live phone as one of their tools (e.g., CBS News, Pew Research Center).

A look at change over the entire recent period – from 2016 to 2022 – finds that more than half of national public pollsters (61%) used methods in 2022 that differed from those they used in 2016. As noted above, if features like weighting protocols were included in the analysis, that rate would be even higher.

A longer view of modern public polling (going back to 2000) shows that methodological churn began in earnest around 2012 to 2014. That was a period when about a third of national pollsters changed their methods. Change during that period was marked by pollsters starting to migrate away from live telephone surveys and toward online surveys.

Pollsters increasingly use multiple methods – sometimes three or more

A chart showing Growing share of national pollsters are using multiple methods

Pollsters are not just using different methods, many are now using multiple methods, the study found. Here again there is a discernable difference in how polls changed after 2016 and how they changed after 2020. After 2016, the share of pollsters using multiple methods remained virtually unchanged (30% in both 2016 and 2018). After 2020, however, the share climbed to 39%. Notably, the share of pollsters using three or more different methodologies in their national public polls tripled from 5% in 2020 to 17% in 2022.

In this analysis, “multiple methods” refers to use of multiple sample sources (e.g., registered voter files and random-digit dial) or multiple interview modes (e.g., online, mail, live telephone). In some cases, several methods were used in a single poll. In other cases the pollster did one poll using one method and another poll using another method.

As an example, in 2014 Pew Research Center switched from exclusively using live phone with random-digit-dial sample to also using a probability-based panel. In 2020 the Center added an additional method, one-off address-based sample surveys offering online or mail response. By 2022, the Center dropped live phone polling. Pollsters that used at least three different methods in 2022 include CNN, Gallup, NPR, Politico and USA Today.

Text messaging and address-recruited panels see growth after 2020

An overarching theme in the study is the growth of new methods. Analysis earlier in this report aimed to describe trends for the most prominent methods. In the past, pollsters often used just one method (e.g., live phone with random-digit dial). That has changed. Today pollsters tend to use new methods (such as text) as one of several ways that they reach people. To track the trajectory of these newer methods, it helps to consider the number of pollsters using the method by itself or in combination with other methods.

A prime example is text message polling. An extremely small share of pollsters conduct national public polls exclusively by text. A larger share use text alongside another method, such as online opt-in.

A chart showing Texting gains some traction in national polling in 2022

How texting is used varies. In some cases respondents receive a text with a web link for an online survey. In other cases, respondents answer the questions via text. Among the pollsters in this study, just one used texting in a national public survey in 2020. In 2022 that number rose to nine, representing 13% of the active national pollsters tracked that year. These figures reflect the number of pollsters using texting alone or in combination with other methods like live phone.

Analysis looking at methods used either alone or in combination with other approaches also suggests a change in the trajectory of online opt-in polling. While online opt-in usage grew tremendously between 2006 and 2020, that growth appears to have slowed if not stopped in 2022 for national polling.

By contrast, the share of national pollsters turning to probability-based panels continues to grow. In 2022 a third (33%) of national pollsters used probability-based panels either alone or in combination with other methods. This is up from roughly 10% during most of the 2010s.

Live phone was once the dominant method of polling but has been in decline since 2016. As of 2022, about a third of national pollsters used live phone alone or in combination (32%), while a much smaller share relied on it as their only method (10%).

The study also tracked the adoption of a specific kind of opt-in sample – members of an online opt-in panel who are matched to a record in a national registered voter file. This study first observed that approach in 2018. In 2018, 2020 and 2022, about 3% to 5% of national public pollsters used online opt-in samples matched to registered voter files, the study found.

Rubén Weinsteiner