How Netflix defined a brand that helped it to build a great product, and vice-versa
Today, Netflix is recognized by the simple letter “N.”
Twenty
years ago, no one recognized the Netflix logo. But today, with more
than 100 million members, customers instantly identify the logo and
trust Netflix in a way that counts — with their credit cards. But it
wasn’t always that way. Remember when Netflix announced its plan to
split its streaming and DVD service with the launch of “Qwikster” in
2011? 800,000 customers cancelled Netflix that quarter.
I grew up
in marketing, switched over to product, and became interested in
branding after success building Sesame Street, Schoolhouse Rock, and
Madeline software. I signed well-established brands to long-term
relationships, then brought the brands to life within children’s
educational software.
When I joined Netflix as VP of Product in
2005, I wanted to do more. My goal was to help a young company establish
a world-class product and brand. As a product leader, my job was to
delight customers in hard-to-copy, margin-enhancing ways. Based on
experience, I viewed building a brand as one of the most important of
these “hard-to-copy” tactics.
By the time I joined Netflix, I had
a somewhat nuanced view of how marketing and product should work
together: marketing defines the brand and product brings the brand to
life by building a great product. Together, the two teams hope to create
a world-class brand and product.
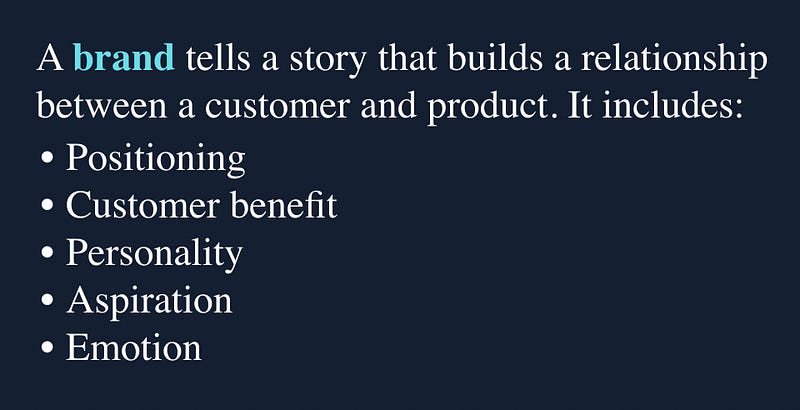
Here’s my definition of a brand:
Below,
I outline two models to apply to your product or company, then show how
these models provided direction for the Netflix marketing and product
teams as the brand and product evolved:
1.) The positioning model
describes the first three components of the brand definition:
positioning, customer benefit, and personality.
2.) The brand pyramid adds the two remaining elements: aspiration and emotion.
3.)
The evolution of Netflix shows how the non-member homepage — the “store
window” of the site— evolved in tandem with the brand over twenty
years.

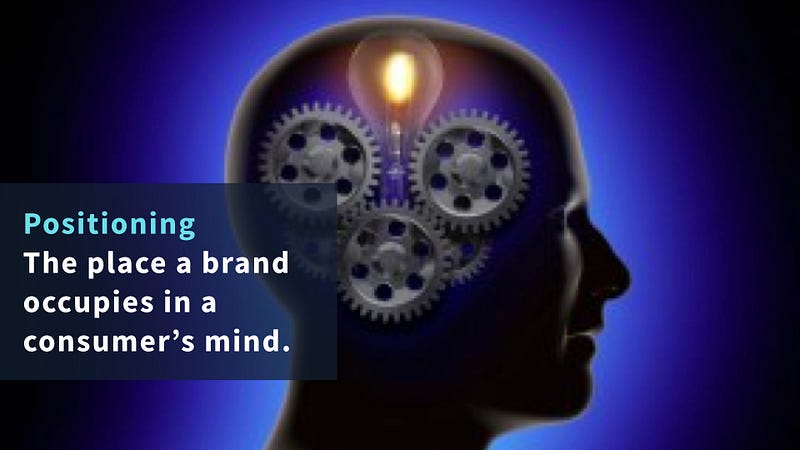
You’re
already an expert in positioning and don’t know it yet. Want proof?
What’s the first word that pops into your head when I mention the car
brand, “Volvo?” For most, the response is “safety.” This example
demonstrates Volvo’s ability to place an idea in your head, relative to
competitors, and that’s the definition of positioning.
To apply the first model, ask yourself three questions:
1.) In simple terms, how do you describe your product or company?
2.) How does it benefit customers?
3.) How do you define its personality? (The question behind the question: how do you want your product to relate to customers?)
Here’s the model applied to Netflix:
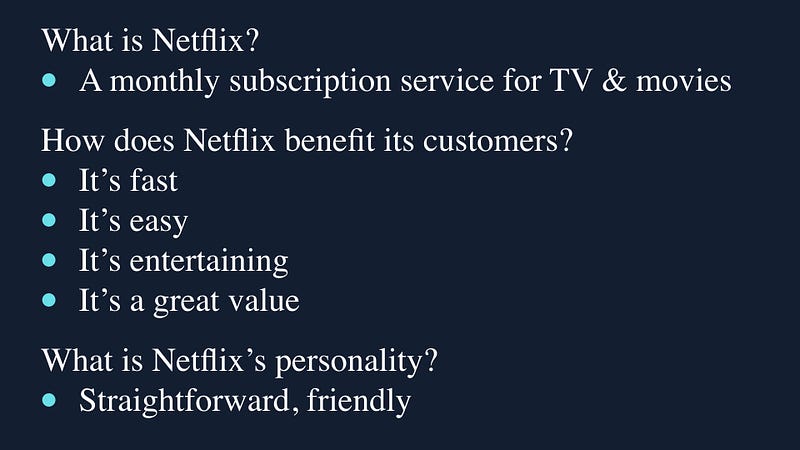
Netflix Positioning Model
If you try this positioning model on your own, here are some tips:
Use clear, precise sixth-grade language. Consumers are busy and don’t have time to parse complicated ideas.
Be brief. Most teams begin with lots of complicated ideas. The key is to simplify and focus on a few, easy-to-communicate ideas.
In
answering the “personality” question, ask yourself, “If someone met my
company or product at a cocktail party, how would I like folks to
describe him or her?” Defining the personality of your product describes
how you want your brand to relate to customers.
Volvo is a
ninety-year-old company. They have spent billions of dollars on
advertising and have consistently invented new safety features to own
the word “safety.” Netflix is only twenty-years-old, but my guess is
decades from now the one word they will own is “entertainment.”
In the long-term, what’s the one word you’d like to own for your product or company?

This
framework builds on the positioning model and “ladders up” to define
emotional benefits for customers as well as the “something bigger” that
inspires your team. For this exercise, think long-term.
Why does
the brand model incorporate emotion? The simple answer: it makes things
memorable. Think for a moment about your childhood memories. My guess is
they all have emotional elements. The joy of a surprise birthday party?
The sorrow of losing a grandparent? Maya Angelou describes this
phenomenon best:
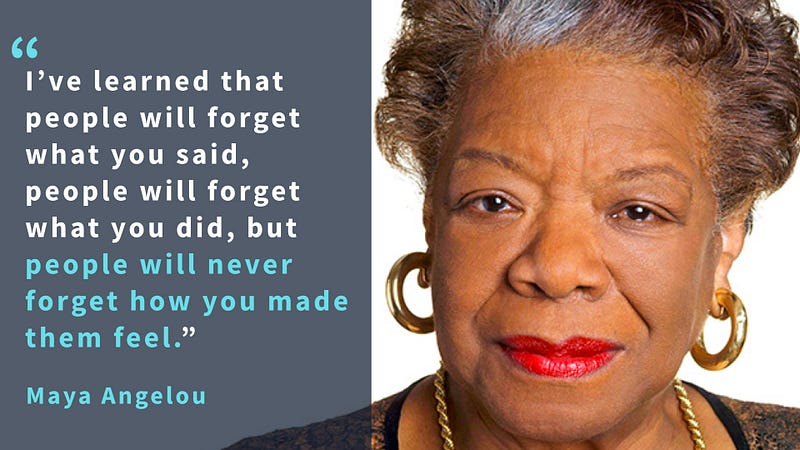
Acknowledging emotion in the brand framework helps make products memorable.
The
brand pyramid has four levels, and the intent is to read it from bottom
to top. The base contains product attributes or features and the other
elements ladder up from this foundation.

The Brand Pyramid
Below,
I explain each level of the pyramid along with advice on how to
approach the exercise on your own. Again, start at the bottom, with the
product attributes as the foundation.
Product attributes:
What are the product features that deliver benefits to customers?
Product benefits:
As
in the previous positioning model, how does your product improve
customers’ lives? (You can cut and paste your description of customer
benefits from the first positioning model.)
Emotional benefits:
How does your product make customers feel?
Something bigger:
In
the long-term, if you fully deliver the product and its emotional
benefits to your customers, how might your product dent the universe?
Think twenty years into the future.
Headline:
The headline
provides an executive summary of the model. In cases where you develop
an advertising campaign, it is the title of an ad campaign.
I’ll
illustrate the model first using Apple as I think it’s helpful to see
the pyramid in the context of a well-established brand:
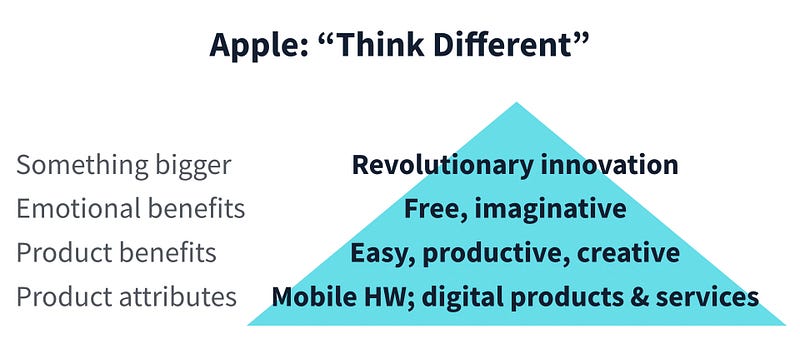
Apple Brand Pyramid
For
Apple today, the product attributes — the “bits and bytes” of what they
deliver to us— are mobile hardware devices, along with the digital
products and services they provide on these devices.
The benefits
to customers are the ease of use of Apple’s human-centered design that
makes customers more productive and creative.
How does Apple make customers feel? We feel imaginative. We feel free.
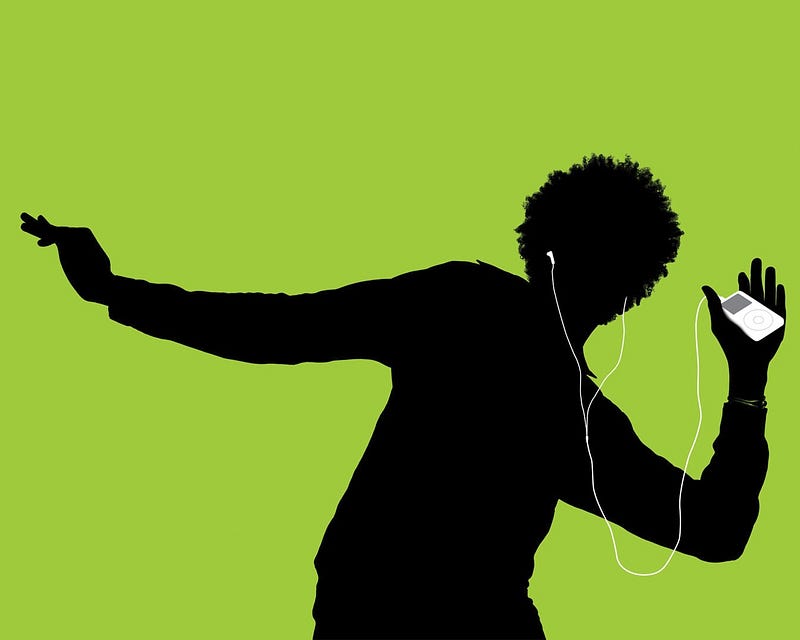
Freedom and creative expression brought to life in Apple’s iPod ad
The
“something bigger” of Apple products? Think for a moment about the
Apple “Think Different” ad campaign, featuring Martin Luther King Jr,
John Lennon, Steve Jobs, and Albert Einstein. All four are
revolutionaries of their time. What is Apple’s “something bigger?”
It’s “Revolutionary Innovation.”
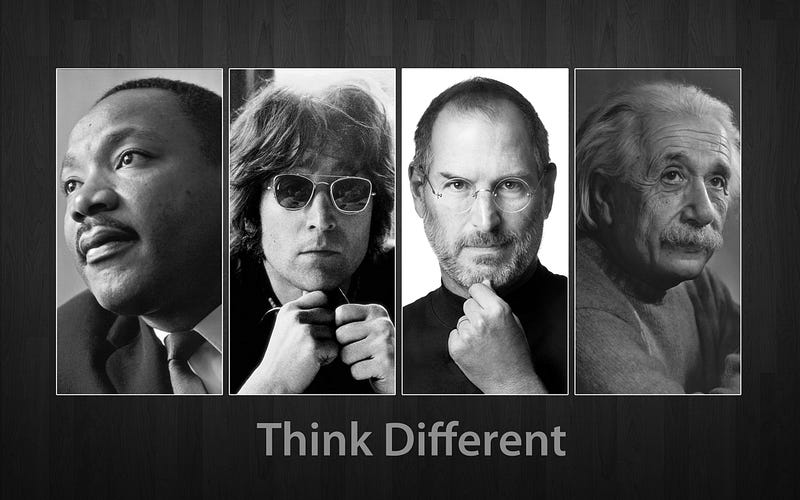
The Apple “Think Different” campaign, featuring four revolutionary leaders.
Consider
the power of the Apple brand. Would you pay a few hundred dollars more
for an electronic device that promises “revolutionary innovation?” Each
year, hundreds of millions of customers do. This premium illustrates the
economic power of a brand.
Here is the brand pyramid applied to Netflix:
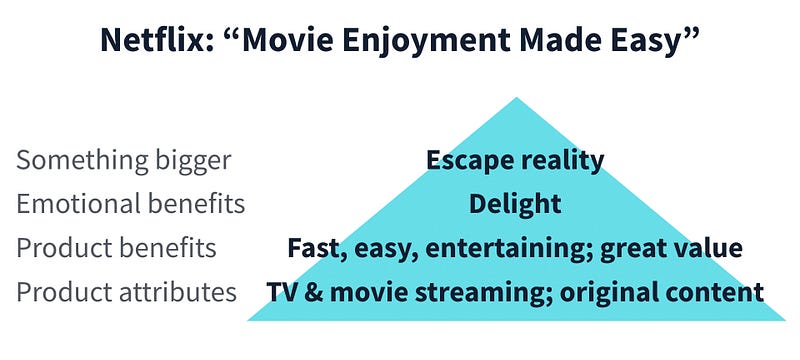
Netflix Brand Pyramid
At
Netflix, Neve Savage was one of my marketing partners. I joke that he
tattooed, “Movie Enjoyment Made Easy” to my forearm so I wouldn’t forget
the phrase.
If you think back to the early days of Netflix, we
were a startup competing with Blockbuster, a retailer with 8,000 stores
and $8 billion in revenue.
But the Blockbuster experience sucked.
I
can remember walking to our neighborhood Blockbuster, wandering the
aisles, waiting in line to pay, then bringing a movie home to discover
that none of my family wanted to watch the movie. Even worse, I had to
pay late fees when I forgot to return the film.
Netflix’s early
DVD-by-mail service had an unlimited monthly subscription. The goal was
to delight our customers with lots of great movie choices, which arrived
the next day in the mail, and later, instantly via streaming.
The
“something bigger” was to deliver an entertainment experience that
transported you to the magical place movies can take you — to escape
reality. The intent was that the service would be so simple that the
technology and interface would fade into the background so customers
could immerse themselves in the movie.
Here are the tips I give to product and marketing teams as they apply the brand pyramid model:
Product
attributes. What are the features or components of your product that
consumers buy or use to enjoy the benefit of your product? In the early
days of Netflix, it was 100,000 movies on DVD, with one-day delivery, no
late fees, and a website where you built your queue. Today, it’s tens
of thousands of streaming movies & TV shows and, increasingly,
original content. Product attributes can and will change over time —
that’s where the innovation happens. The other levels of the pyramid,
however, stay relatively constant.
Product benefits. These are the
same benefits from the first positioning model. Just make sure that the
product attributes enable the product benefits.
Emotional benefits.
If you built a world-class product that delivers the benefits you
describe, but ultimately exceeds customers’ expectations, how would
customers feel? Make sure the words describe feelings.
Something
bigger. Many teams struggle with this part of the exercise. My coaching:
Think Big. Apple delivers revolutionary innovation, Nike enables
customers to fulfill their full human potential, and SpaceX is working
to save the human race by colonizing Mars. The “something bigger” is
meant to inspire your team to build a great product and company over
fifty years.
The headline. It took Apple tens of millions of dollars
to create their “Think Different” campaign. So don’t expect a few hours
of work to be as impactful. In the case of Netflix, “Movie Enjoyment
Made Easy” was not intended to be seen by customers, but the headline
summarized the brand pyramid in a way that I can still remember.
The
important thing is to take your best shot at defining the model, then
explore the various ideas with consumers via focus groups, surveys, but
most importantly, A/B tests.

For
years, Netflix marketing and product teams experimented with various
product features and how to best present them. As much as I have
described the positioning and branding models as static, this was not
the case. The positioning model was updated continuously. The upper
levels of the brand pyramid stayed more constant, however, providing
consistent direction for the product team.
Netflix steadily
evolved the product — from DVDs by mail, to streaming, to original
content — and also tested the best ways to present the service to
customers. In some cases, we evaluated new ideas through exploration of
mock-ups and concept summaries. In other instances, we experimented with
how to present new features we had already developed. The product and
marketing teams worked together to continually innovate on both the
product and its presentation.
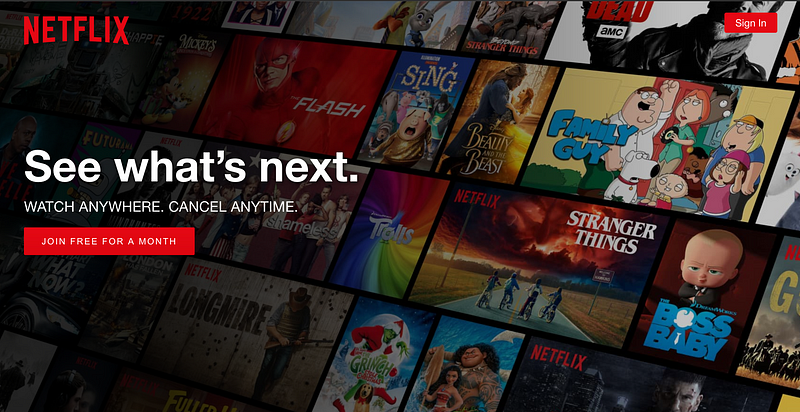
The Netflix non-member page today. Its job is to convert non-members who visit the site into a free trial.
While
many regard brand as amorphous and hard to measure, Netflix did its
best to measure its impact. We continually A/B tested different
positioning and branding approaches on the non-member homepage. We
focused on two key metrics:
1.) Trials/Visitors. Historically, 2% of visitors to the non-member site started a free trial.
2.) Conversion from free to paid membership. At the end of a free trial, about 90% of customers converted to paid membership.
A/B
testing enabled us to measure the efficacy of both our positioning and
brand. We tested new approaches every two weeks, and almost everything
you see on the non-member homepage is a proven winner.
Looking
back on my time at Netflix, I consider the work in this area to be the
result of a dance between marketing and product, judged by customers via
ongoing qualitative and quantitative research. Below I share nearly
twenty years of non-member page iteration. I think you’ll be surprised
by how much the positioning, brand, and product evolved.
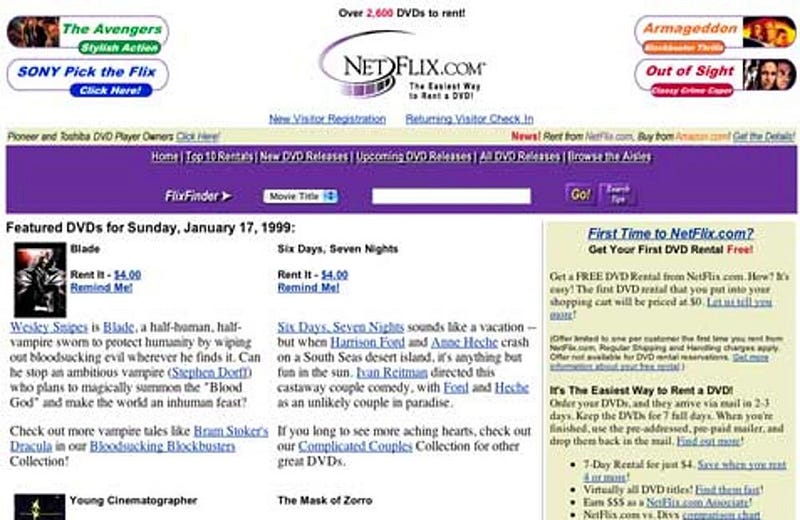
Netflix in 1999
In
1999, Netflix was an e-commerce site, focused on selling DVDs — only 1%
of its transactions were rentals. There were just 2,600 titles, and the
DVDs arrived 3–5 days after you ordered them. I like this page as it
reminds me that all startups suck in the beginning. It’s fun to look
back to see how far you’ve come.
At this point, Netflix made a
“bet the company” pivot to focus exclusively on DVD rental. The team
added the Queue and eliminated both due dates and late fees for their
fledgling DVD-by-mail rental program. They made this decision based on a
few focus groups and the correct assumption that Amazon would
eventually dominate DVD sales.
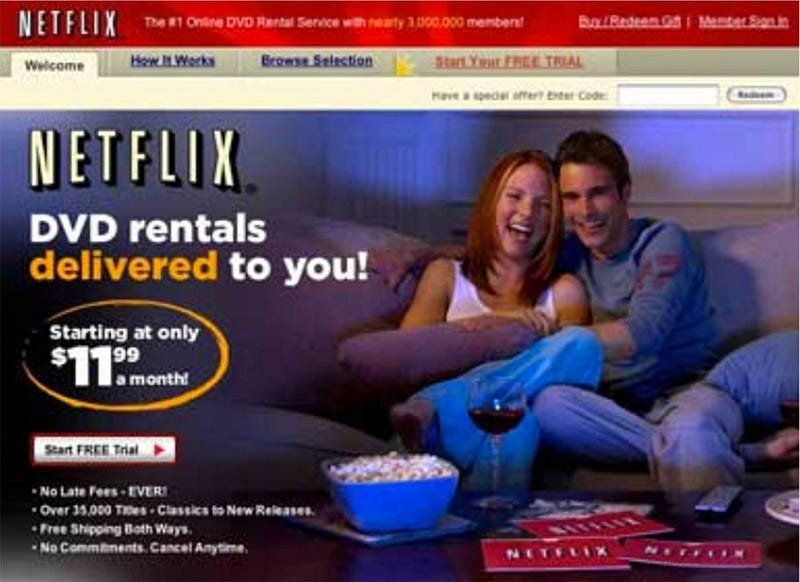
2004
In
2004, Netflix was an “all you can eat” DVD-by-mail subscription
service. With no due dates or late fees, the service was well-positioned
against Blockbuster, and the DVD library had grown to 35,000 titles.
The couple on the couch hint at the emotional benefit of “movie
enjoyment made easy.”
2008
By
2008, there’s constant testing on the non-member page as Netflix
explores how to combine its growing DVD-by-mail library with its nascent
streaming service.
The Roku launch in 2008 was the first step in
Netflix’s long-term strategy to create a hard-to-copy network effect by
giving all TV manufacturers the tools they needed to make their TVs
“Netflix Ready.” But in 2008, Roku was the only device that enabled
Netflix members to watch movies on their TV.
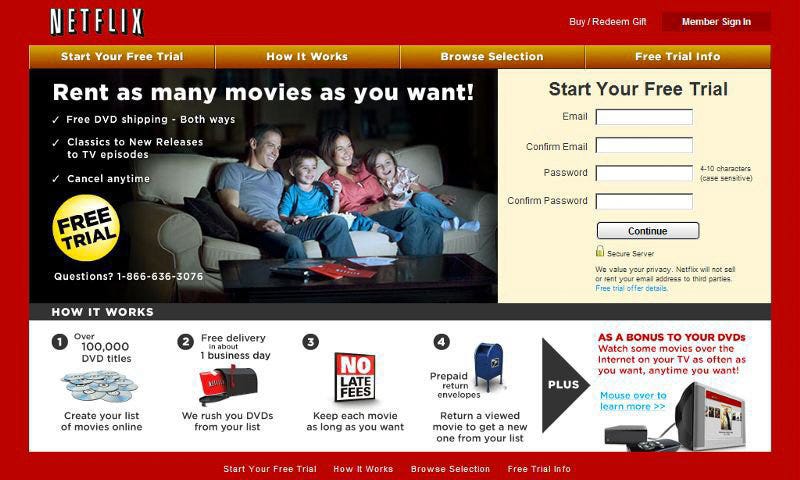
2009
In
2009, there was a clear, family-friendly positioning and the non-member
site is now simpler. But the homepage still positions streaming as a
minor “bonus” to its DVD-by-mail service.
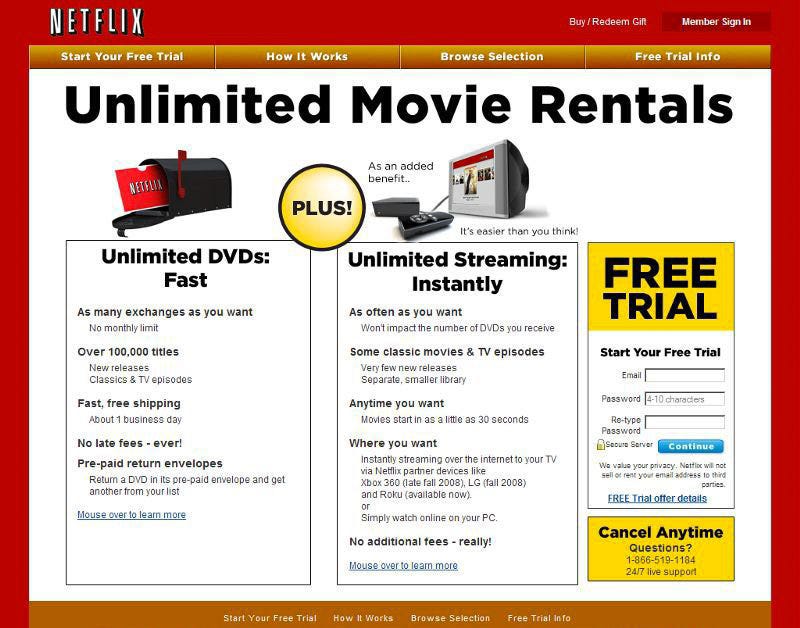
2010
By
2010, Netflix commits itself more fully to streaming, recognizing that
its huge DVD-by-mail library will have a diminishing competitive
advantage as the industry shifts from DVD to streaming. Netflix is now
“streaming first.”
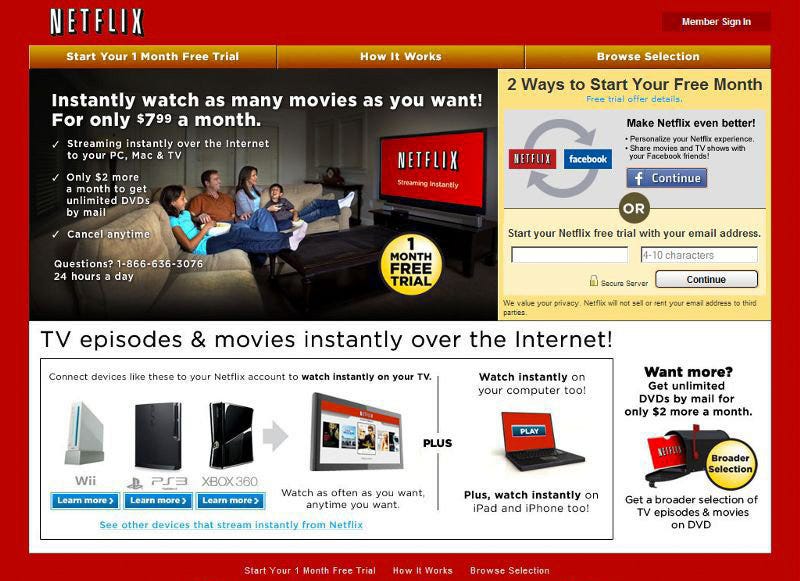
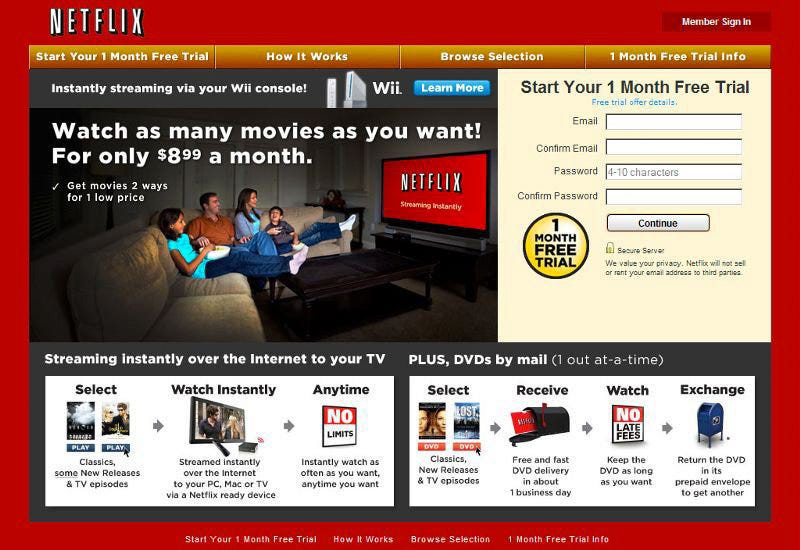
2011
By
2011, Netflix presents its DVD-by-mail service as an “add-on” to its
streaming service — it has come full circle since 2007. The company is
now aggressive about promoting the ability to watch on TV, given the
service is now on all three major tv-based gaming platforms.
In
2011, Netflix was also experimenting with Facebook Connect as a means to
sign-up and get movie recommendations from friends. This social
approach eventually failed — twice. Customers weren’t interested in
sharing their movie tastes with friends, and when they did, their
friends thought they had terrible taste!
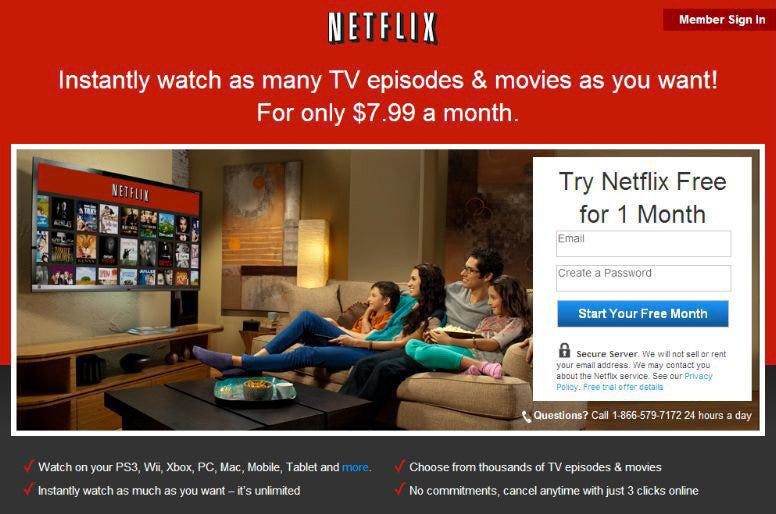
2012
Finally,
in 2012, the site gets simpler. Netflix now has more than 30M members,
and the brand now communicates real meaning to consumers. The site no
longer commits as much space to describing what it is and how it works.
The DVD-by-mail service still exists as an add-on, but there’s no
reference to it on the non-member homepage. Netflix is now a streaming
service.
2013
The
non-member site is now substantially simpler. Simpler versions of the
site had been A/B tested for years, but more complicated versions
consistently won. It’s counterintuitive that the earlier, simpler
designs failed — simple typically trumps complete. But more “stuff” on
the screen was an efficient way to communicate value at the time. In
2013, the Netflix brand finally provided this value instead.
A
last note: 2013 is the year that Netflix launched its first original
series, “House of Cards,” so original content is now an attribute of the
company’s offering. At this point, Netflix began to invest its
marketing dollars in its original content — something they didn’t do
when they were an aggregator of other studios’ content.
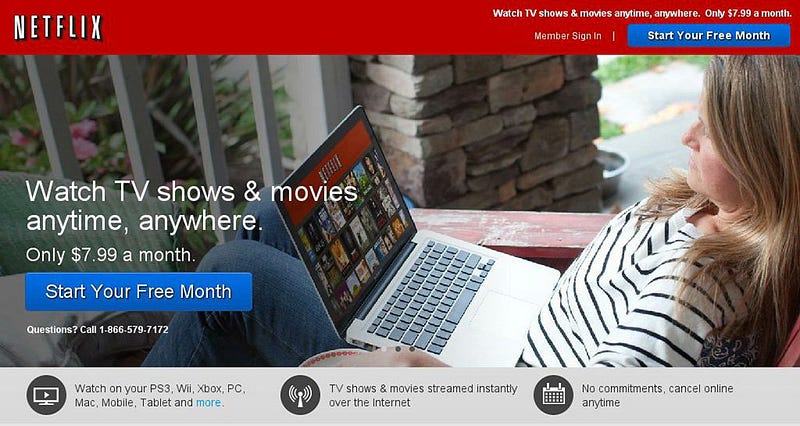
2013
By
late 2013, there’s increasing focus on the ability to “watch anywhere”
as you can now watch on tablets, mobile devices, and hundreds of
“Netflix-Ready” TV-connected devices. There’s also a continued trend
towards a simpler, non-member experience.
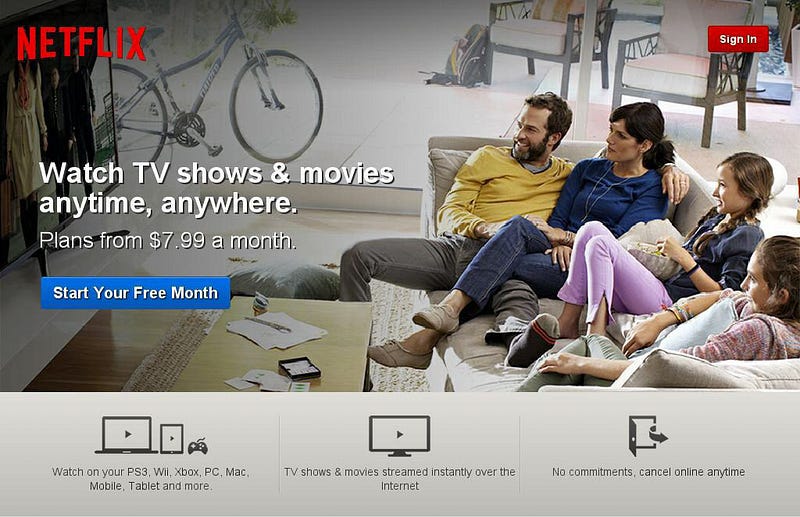
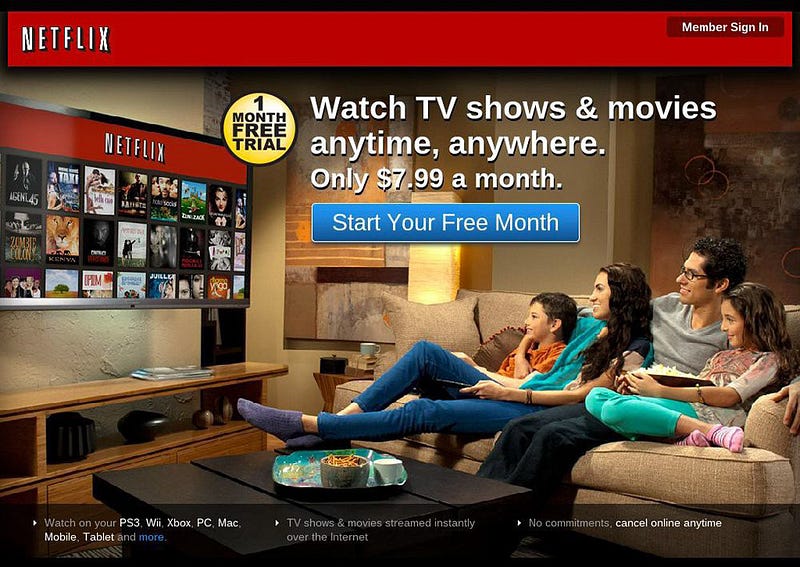
2014
What
says “Movie Enjoyment Made Easy” more than a happy family on a couch?
Note that there’s no hardware or interface on the page. Netflix now lets
you fade into your couch with no technology or complexity to distract
you from your movie-watching experience.
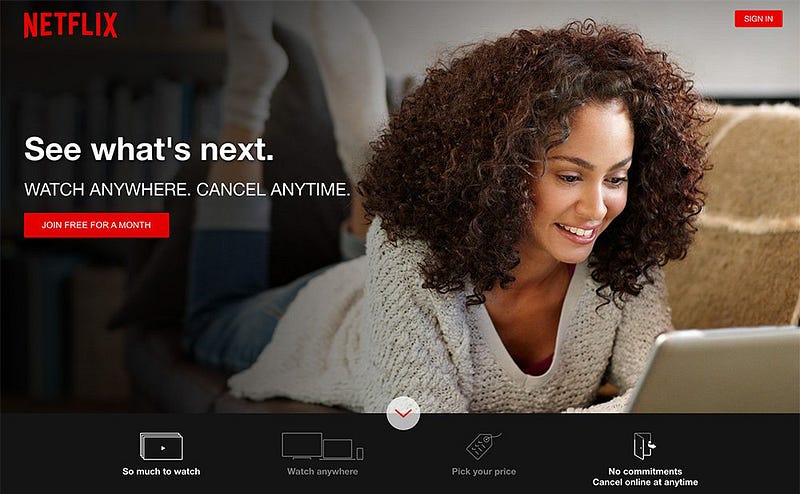
2016
She
looks delighted, right? Netflix is both well-known and trusted, so
there’s no real estate required to explain what the product is and the
free trial continues to be the best way to enable folks to enjoy the
experience. And for the reluctant “fence-sitters,” the ability to
“cancel anytime” reduces their perceived risk.
2017
Today,
the site focuses on movies with a hint of Netflix’s growing original
content library. (Note Season Two of “Stranger Things” at the center of
the screen.)
What will Netflix experiment with next? I’m sure
there are lots of hypotheses being tested right now. As in the past,
Netflix will continually experiment on its non-member site, both to
identify which potential ideas resonate with customers and to determine
how to position new features they have already built.
Conclusion
Over
the last twenty years, Netflix has evolved from a DVD e-commerce site
to a worldwide Internet TV company. The dance between product, marketing
and consumers continues as teams work to define and deliver both a
brand and a product that delight customers in hard-to-copy,
margin-enhancing ways. Today, Netflix is a world-class company with a
distinct advantage in its hard-to-copy brand.
I’ll leave you with
one final thought, highlighting the importance of teamwork between
marketing and product to enable product and brand innovation:
“Today,
brands are not the preserve of a marketing department. Brands are too
important to be left to the marketing department — or any other
‘department,’ come to that. Organizational ghettoes do not create
vibrant world-changing brands.” — Thomas Gad
 |
| Rubén Weinsteiner |

 Fewer
cite other considerations as major reasons why they identify with their
party. About half of Democrats (51%) and 45% of Republicans cite having
a lot in common with other members of their party as a major reason.
Fewer
cite other considerations as major reasons why they identify with their
party. About half of Democrats (51%) and 45% of Republicans cite having
a lot in common with other members of their party as a major reason.  For
independents who lean toward a party, the belief that the other party’s
policies are harmful is the most frequently cited reason for their
partisan leaning. Nearly six-in-ten Republican-leaning independents
(58%) and Democratic leaners (57%) say a major reason for leaning to the
Republican and Democratic parties, respectively, is a feeling that the
other party’s policies are harmful for the country.
For
independents who lean toward a party, the belief that the other party’s
policies are harmful is the most frequently cited reason for their
partisan leaning. Nearly six-in-ten Republican-leaning independents
(58%) and Democratic leaners (57%) say a major reason for leaning to the
Republican and Democratic parties, respectively, is a feeling that the
other party’s policies are harmful for the country. 


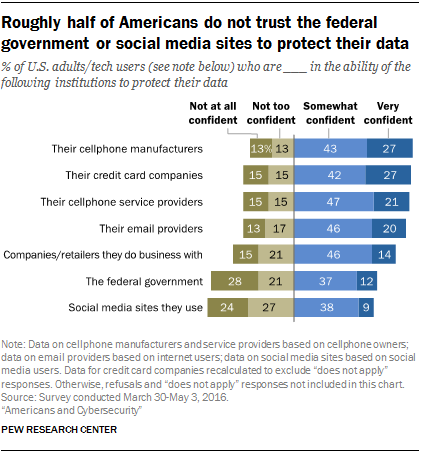 Another survey last year found that just 9% of social media users were “very confident” that social media companies would
 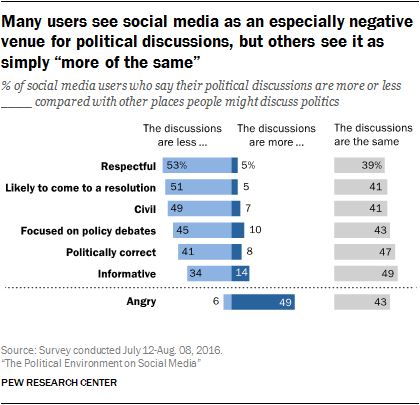 Moreover,
social media users can be turned off by what happens on social media.
For instance, social media sites are frequently cited as places where
Moreover,
social media users can be turned off by what happens on social media.
For instance, social media sites are frequently cited as places where