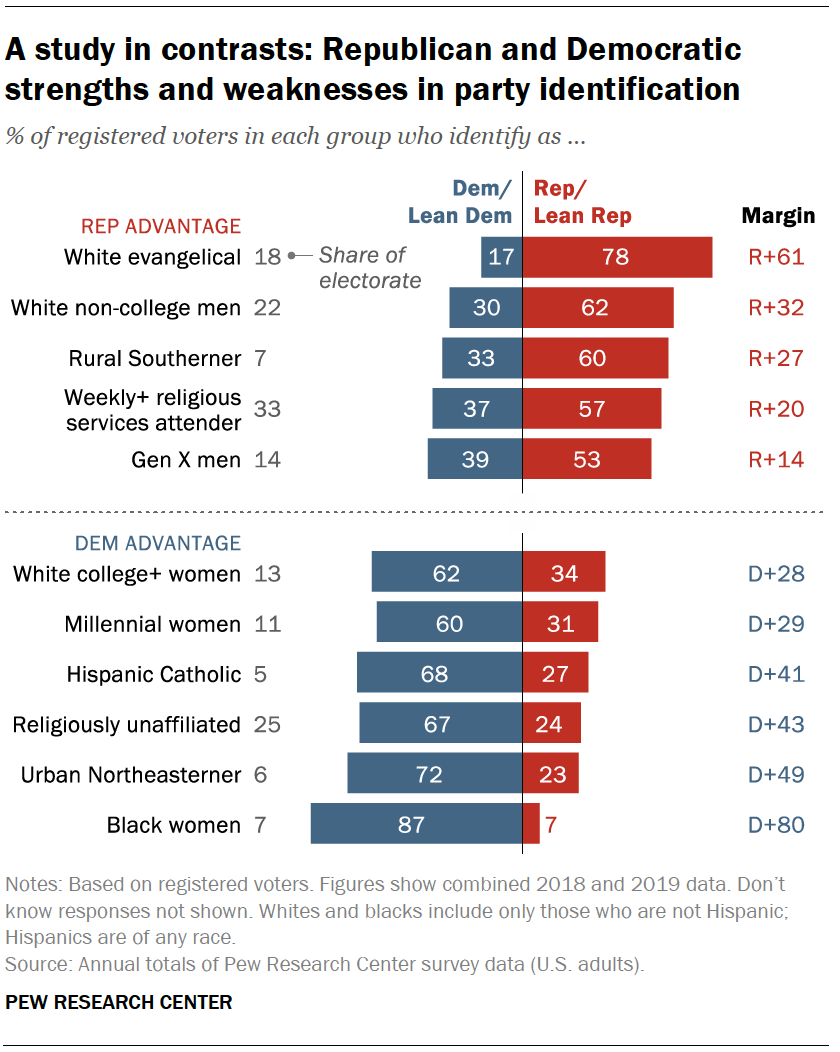
 Republicans
hold wide advantages in party identification among several groups of
voters, including white men without a college degree, people living in
rural communities in the South and those who frequently attend religious
services.
 Democrats hold formidable advantages among a contrasting set of voters, such as black women, residents of urban communities in the Northeast and people with no religious affiliation.
With the presidential election on the horizon, the U.S. electorate continues to be deeply divided by race and ethnicity, education, gender, age and religion. The Republican and Democratic coalitions, which bore at least some demographic similarities in past decades, have strikingly different profiles today.
A new analysis by Pew Research Center of long-term trends in party affiliation – based on surveys conducted among more than 360,000 registered voters over the past 25 years, including more than 12,000 in 2018 and 2019 – finds only modest changes in recent years.
Overall, 34% of registered voters identify as independents, 33% as Democrats and 29% as Republicans. The share of voters identifying as Republicans is now the same as it was in 2016, after having ticked down in 2017; Democratic identification is unchanged. Slightly fewer voters identify as independents than in 2017 (34% vs. 37%). See detailed tables.
Most independents lean toward one of the major parties (leaners tend to vote and have similar views as those who identify with a party), and when the partisan leanings of independents are taken into account, 49% of registered voters identify as Democrats or lean Democratic, while 44% affiliate with the GOP or lean Republican.
There have been few significant changes in party identification among subgroups of voters since 2017. Yet over a longer period, dating back more than two decades, there have been profound shifts in party identification among a number of groups as well as in the composition of the overall electorate. This is reflected in the starkly different profiles of the Republican and Democratic coalitions:
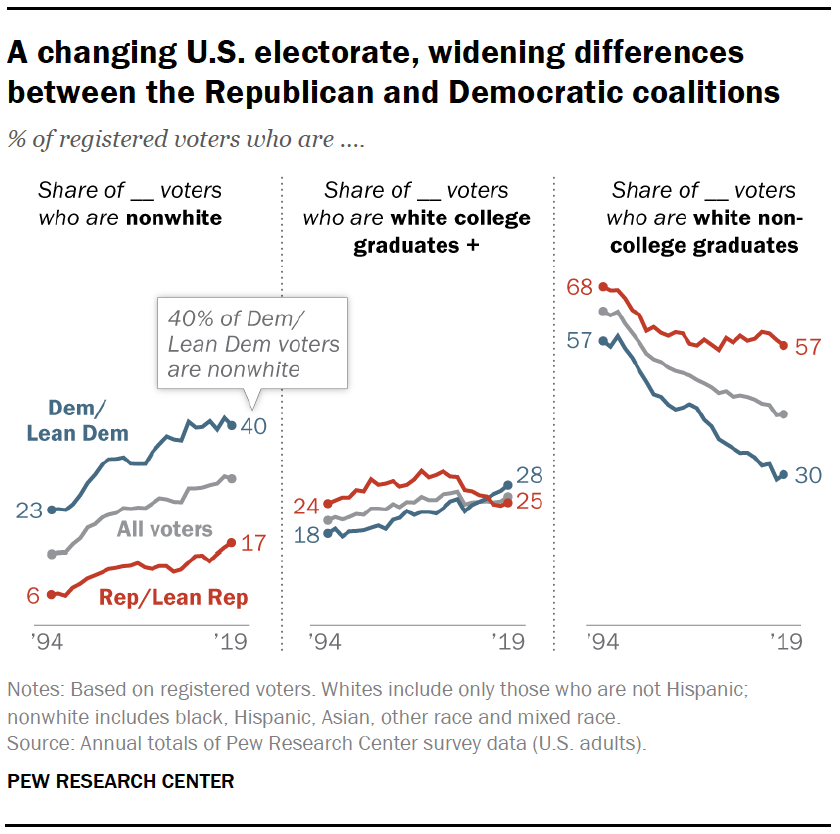 Race
and ethnicity. White non-Hispanic voters continue to identify with the
Republican Party or lean Republican by a sizable margin (53% to 42%).
Yet white voters constitute a diminished share of the electorate – from
85% in 1996 to 69% in 2018/2019. And the growing racial and ethnic
diversity of the overall electorate has resulted in a more substantial
change in the composition of the Democratic Party than in the GOP:
Four-in-ten Democratic registered voters are now nonwhite (black,
Hispanic, Asian and other nonwhite racial groups), compared with 17% of
the GOP.
 Education and race. Just as the nation has become more racially and ethnically diverse, it also has become better educated. Still, just 36% of registered voters have a four-year college degree or more education; a sizable majority (64%) have not completed college. Democrats increasingly dominate in party identification among white college graduates – and maintain wide and long-standing advantages among black, Hispanic and Asian American voters. Republicans increasingly dominate in party affiliation among white non-college voters, who continue to make up a majority (57%) of all GOP voters.
Age and generations. The electorate is slowly aging: A 52% majority of registered voters are ages 50 and older; in both 1996 and 2004, majorities of voters were younger than 50. Two decades ago, about four-in-ten voters in both parties were 50 and older; today, these voters make up a majority of Republicans (56%) and half of Democrats. Looking at the electorate through a generational lens, Millennials (ages 24 to 39 in 2020), who now constitute a larger share of the population than other cohorts, also are more Democratic leaning than older generations: 54% of Millennials identify with the Democratic Party or lean Democratic, while 38% identify with or lean to the GOP.
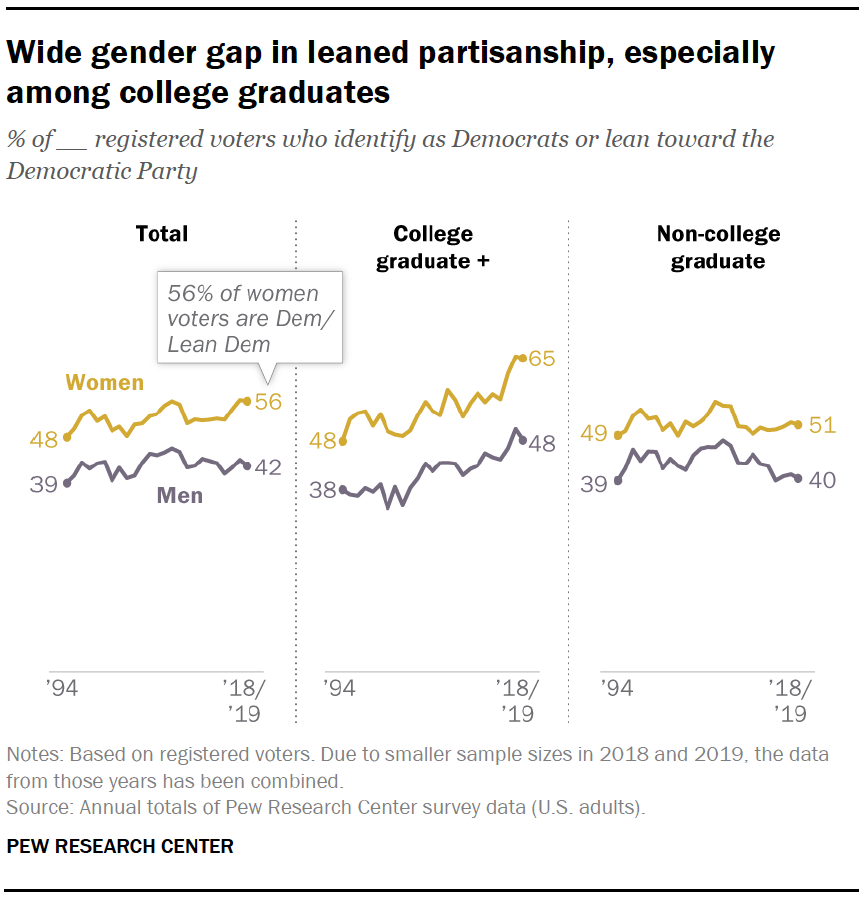 The
gender gap. The gender gap in party identification is as large as at
any point in the past two decades: 56% of women align with the
Democratic Party, compared with 42% of men. Gender differences are
evident across a number of subgroups: For example, women who have not
completed college are 11 percentage points more likely than men to
identify as Democrats or lean Democratic (51% to 40%). The gap is even
wider among those who have at least a four-year degree (65% of women,
48% of men).
 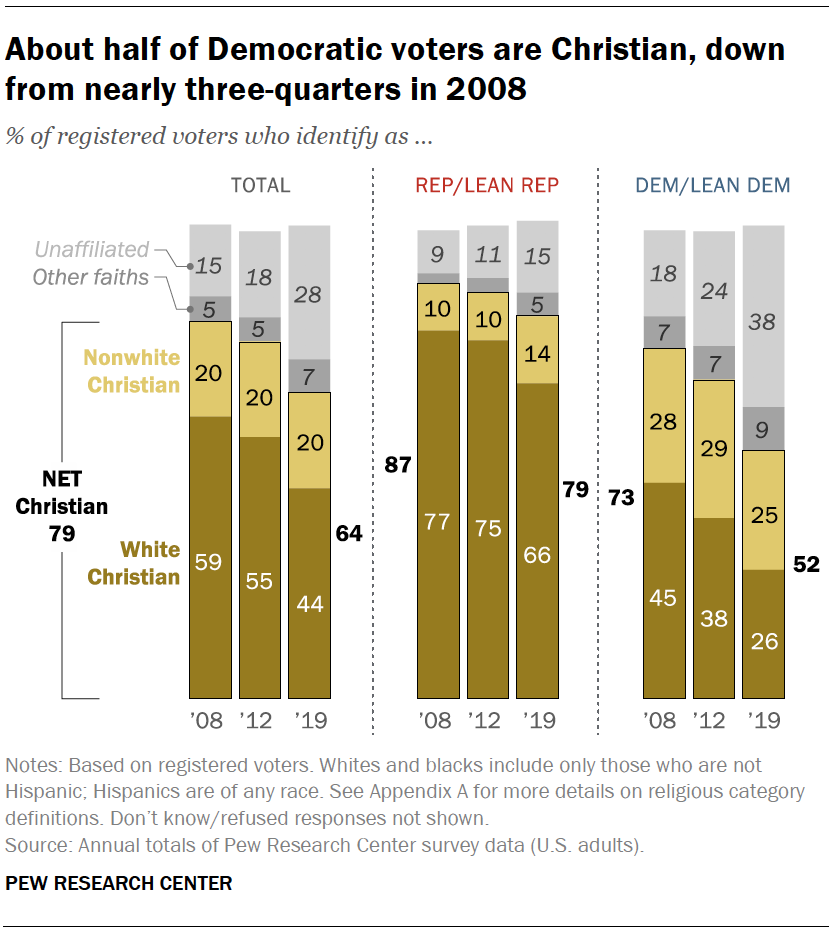 Religious affiliation. The U.S. religious landscape has undergone profound changes in recent years, with the share of Christians in the population continuing to decline.
 These shifts are reflected in the composition of the partisan coalitions. Today, Christians make up about half of Democratic voters (52%); in 2008, about three-quarters of Democrats (73%) were Christians. The share of Democratic voters who are religiously unaffiliated has approximately doubled over this period (from 18% to 38%).
The changes among Republicans have been far more modest: Christians constitute 79% of Republican voters, down from 87% in 2008. (Data on religious affiliation dates to 2008; prior to that, Pew Research Center asked a different question about religious affiliation that is not directly comparable to its current measure.)
CORRECTION (June 2, 2020): The following sentence was updated to reflect that millennials constitute a larger share of the U.S. population than other cohorts: “Looking at the electorate through a generational lens, Millennials (ages 24 to 39 in 2020), who now constitute a larger share of the population than other cohorts, also are more Democratic leaning than older generations…” The changes did not affect the report’s substantive findings.
Democratic edge in party identification narrows slightly
The balance of party identification among registered voters has remained fairly stable over the past quarter century. Still, there have been modest fluctuations: The new analysis, based on combined telephone surveys from 2018 and 2019, finds that the Democratic Party’s advantage in party identification has narrowed since 2017.
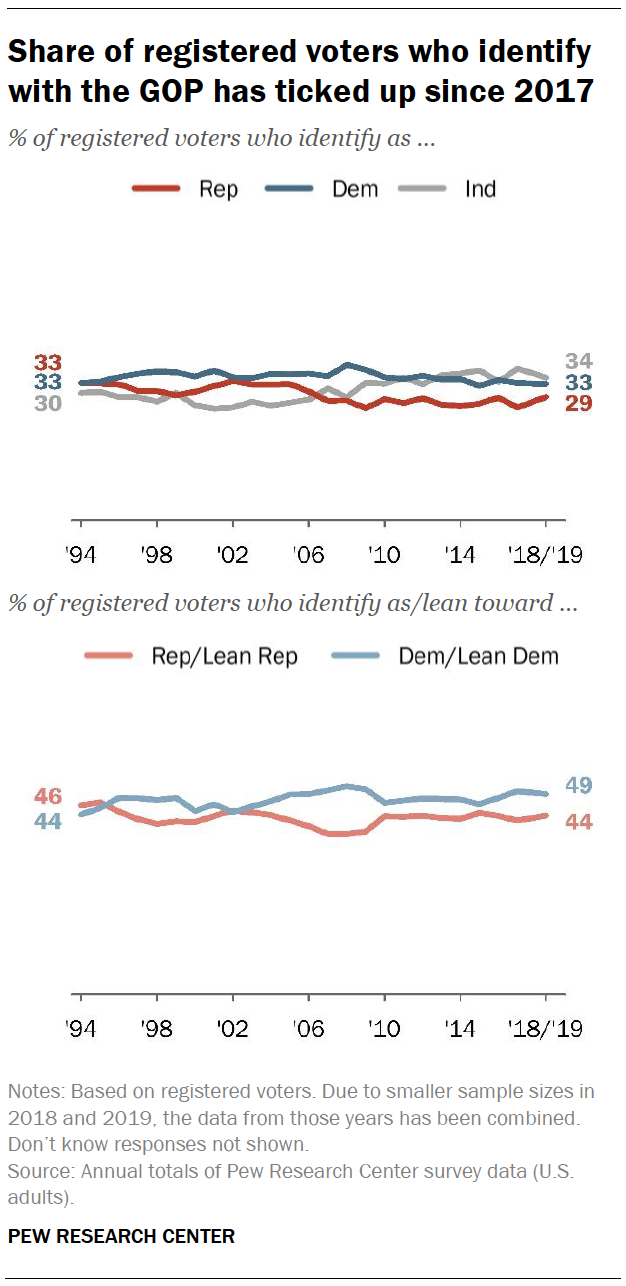 Overall,
34% of registered voters identify as independent, compared with 33% who
identify as Democrats and 29% who identify as Republicans. The share of
registered voters who identify with the Republican Party is up 3
percentage points, from 26% in 2017, while there has been no change in
the share who identify as Democrats. The share of voters who identify as
independents is 3 points lower than it was in 2017.
 When independents – and those who don’t align with either major party – are included, 49% of all registered voters say they either identify with or lean toward the Democratic Party; slightly fewer (44%) say they identify with or lean toward the GOP. In 2017, the Democratic Party enjoyed a wider 8-point advantage in leaned party identification (50% to 42%).
(Across many political attitudes, there is little difference between voters who lean toward a party and those who identify with that party; this report primarily focuses on the combined measure of leaned party identification.)
Democrats have held the edge in party identification among registered voters since 2004. The current balance of leaned party identification is similar to where it stood in 2016 – when 48% of voters identified as Democrats or leaned Democratic and 44% identified with or leaned toward the GOP – and in 2012 (also 48% Democratic, 44% Republican). See detailed tables.
Gender gap in party affiliation widens
 Women
continue to be more likely than men to associate with the Democratic
Party. The current gap in leaned party affiliation continues to be among
the widest in yearly Pew Research Center surveys dating to 1994.
 Among registered voters, 56% of women identify with or lean toward the Democratic Party compared with 42% of men. While the gender gap in partisanship is long-standing, it has gradually expanded since 2014 and now stands at 14 points. Between 1994 and 2014 the average gender gap in leaned party affiliation was 9 points.
Underlying the gender gap in leaned party identification is a gender difference in voters’ straight party identification: Men are more likely to identify as Republicans (31%) than Democrats (26%), while the reverse is true among women (39% identify as Democrats, 28% as Republicans).
Notably, men (39%) remain more likely than women (30%) to call themselves independents. Among men, a larger share of independent voters – and voters who don’t align with either major party – lean toward the GOP than the Democratic Party, while the balance of partisan leaning among women who identify as independents runs in the opposite direction.
Wide divides in partisanship persist by race and ethnicity
Some of the largest differences in partisanship continue to be seen across racial and ethnic groups.
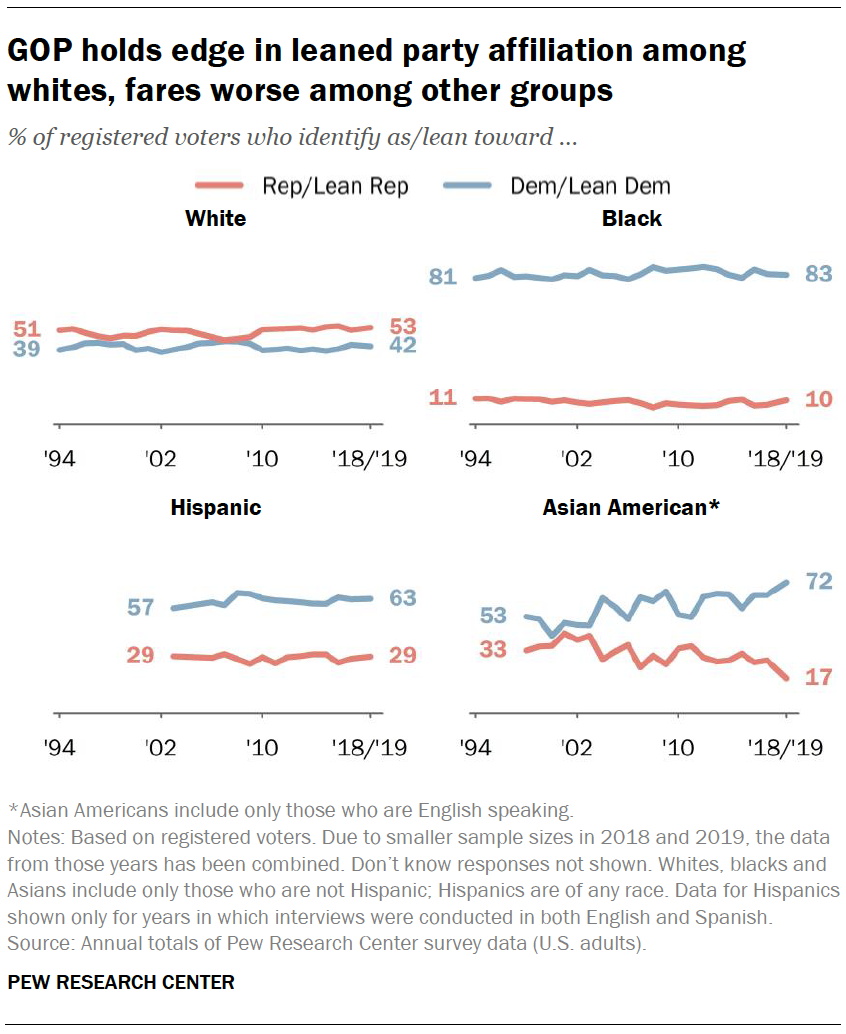 The
GOP continues to maintain an advantage in leaned party identification
among white voters (53% to 42%). By contrast, sizable majorities of
black, Hispanic and Asian American voters identify with or lean toward
the Democratic Party. Among black voters, 83% identify or lean toward
the Democratic Party, compared with just 10% who say they are Republican
or lean toward the GOP.
 The Democratic Party also holds a clear advantage over the GOP in leaned party identification among Hispanic voters (63% to 29%), though the margin is not as large as among black voters.
Among English-speaking Asian American voters, 72% identify or lean toward the Democratic Party, compared with just 17% who identify with or lean toward the GOP. (Note: Only English-speaking Asian American voters are included in the data because Pew Research Center does not conduct its standard domestic political surveys in Asian languages.)
The balance of partisanship among white, black and Hispanic voters has been generally stable over the past decade. However, English-speaking Asian American voters have shifted toward the Democratic Party.
In addition to the distinct partisan preferences expressed by different racial and ethnic groups, demographic changes in the country drive shifts in the composition of all registered voters. Since 1994, the share of white voters in the country declined from 85% to 68% today. By contrast, the share of Hispanic voters in the electorate has increased from just 4% in 1994 to 11% today. The share of black voters in the electorate has been largely stable over the past 25 years, though it’s slightly higher now than in 1994 (11% today vs. 9% then).
Democrats hold sizable advantage among college-educated voters
Over the past 25 years, there’s been a fundamental shift in the relationship between level of educational attainment and partisanship. The Democratic Party has made significant gains among voters with a college degree or more education – a group that leaned toward the GOP 25 years ago. At the same time, the GOP now runs about even with the Democratic Party among voters without a college degree after trailing among this group at the end of the George W. Bush administration. And the GOP has made clear gains in recent years among voters with the lowest level of formal education, those with no more than a high school diploma.
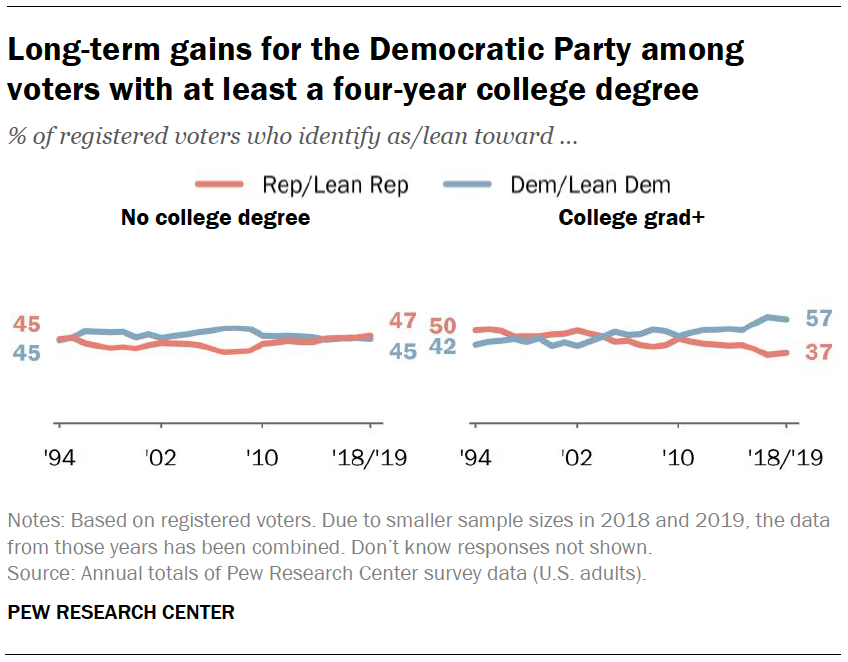 A
majority of registered voters with at least a four-year college degree
(57%) identify with or lean toward the Democratic Party, while 37%
associate with the GOP. The Democratic Party’s advantage with more
highly educated voters has grown over the past decade and is wider than
it was in both 2016 and 2012. In 1994, a greater share of those with at
least a college degree identified with or leaned toward the GOP than the
Democratic Party (50% vs. 42%).
 Among voters who do not have a four-year college degree, 47% say they identify with or lean toward the GOP compared with 45% who identify with or lean toward the Democratic Party. The GOP has gradually made gains among non-college voters since an ebb for the standing of their party in 2007 and 2008.
There are distinctions in party identification among voters who have at least a four-year degree and those who have not completed college.
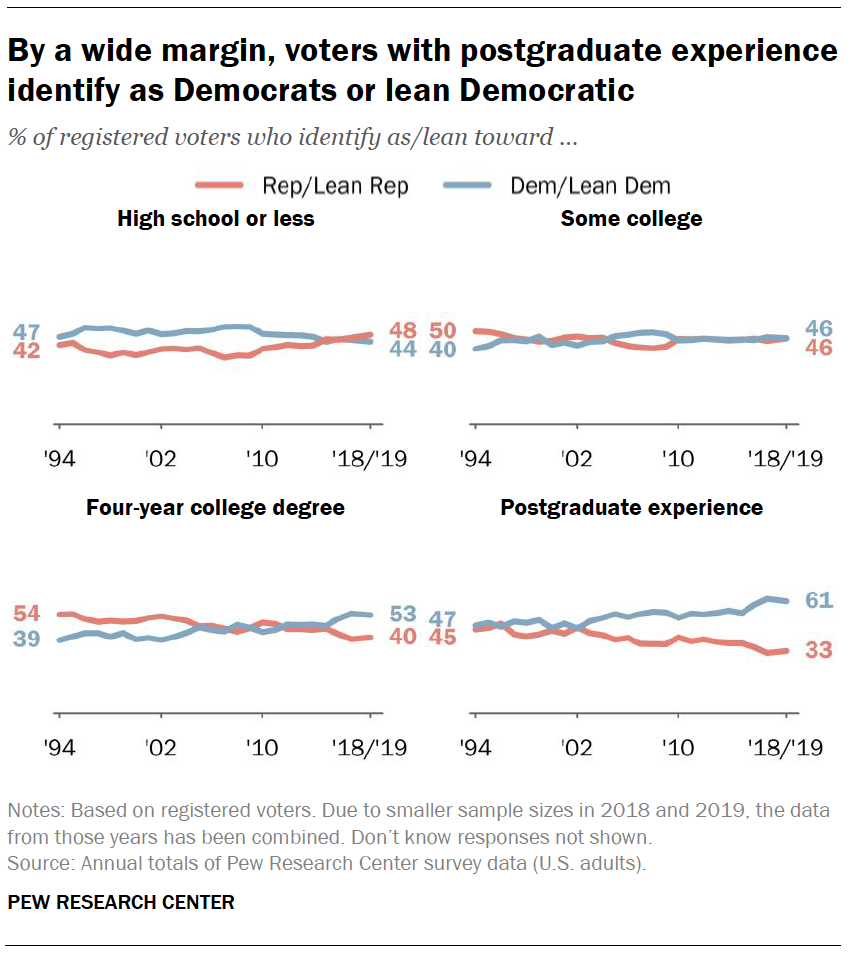 Voters
with some postgraduate experience, in addition to a four-year college
degree, are especially likely to associate with the Democratic Party.
About six-in-ten voters with postgraduate experience (61%) identify with
or lean toward the Democratic Party, while just 33% associate with the
Republican Party.
 The Democratic Party’s advantage over the GOP is somewhat less pronounced among voters with a four-year college degree and no postgraduate experience (53% to 40%). However, both college graduates and postgraduates have seen comparable shifts toward the Democratic Party over the past 25 years.
Republicans hold a slight 48% to 44% edge in leaned party identification among voters with no more than a high school diploma. Among voters with some college experience but no four-year degree, the Republican Party runs about even with the Democratic Party. Both groups have moved toward the GOP over the past decade, though the shift has been slightly more pronounced among those with no more than a high school diploma than those with some college experience.
These shifts in partisan preferences have taken place as the educational makeup of all registered voters has undergone change. The share of all voters with a college degree has grown from 24% in 1994 to 35% today. The share with a high school degree or less education has fallen sharply over the past 25 years, from 48% to 33% of all registered voters. And there’s been a modest increase in the share of all voters with some college experience but no four-year degree (from 27% t0 33%).
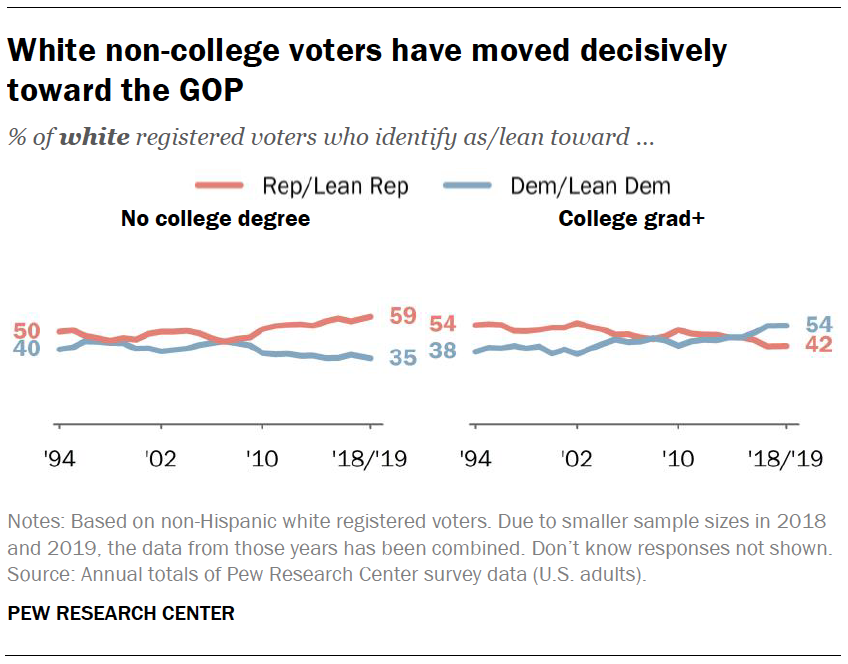 Republican
gains among those without a college degree are especially visible among
white voters. As recently as 2007, white voters without a college
degree were about evenly divided in their leaned party affiliation.
Since then, the GOP has made clear gains among this group and now holds a
59% to 35% advantage over the Democratic Party.
 By contrast, white voters with a college degree have moved decisively toward the Democratic Party, with significant changes occurring in just the last several years. In 2015, college-graduate white voters were equally likely to identify with or lean toward the GOP as the Democratic Party. The Democratic Party opened up a 4-point edge among this group in 2016, and that advantage has grown to 12 points in the current data (54% to 42%). This marks a reversal from 1994, when the GOP held a 54% to 38% advantage in leaned party identification among white voters with a college degree.
As a result of these contrasting trends, there is now a 19-point gap in the shares who identify with or lean toward the Democratic Party between white voters with a college degree and those without one (54% vs. 35%). In 1994, white voters without a college degree were 2 points more likely than those with a degree to associate with the Democratic Party (40% vs. 38%).
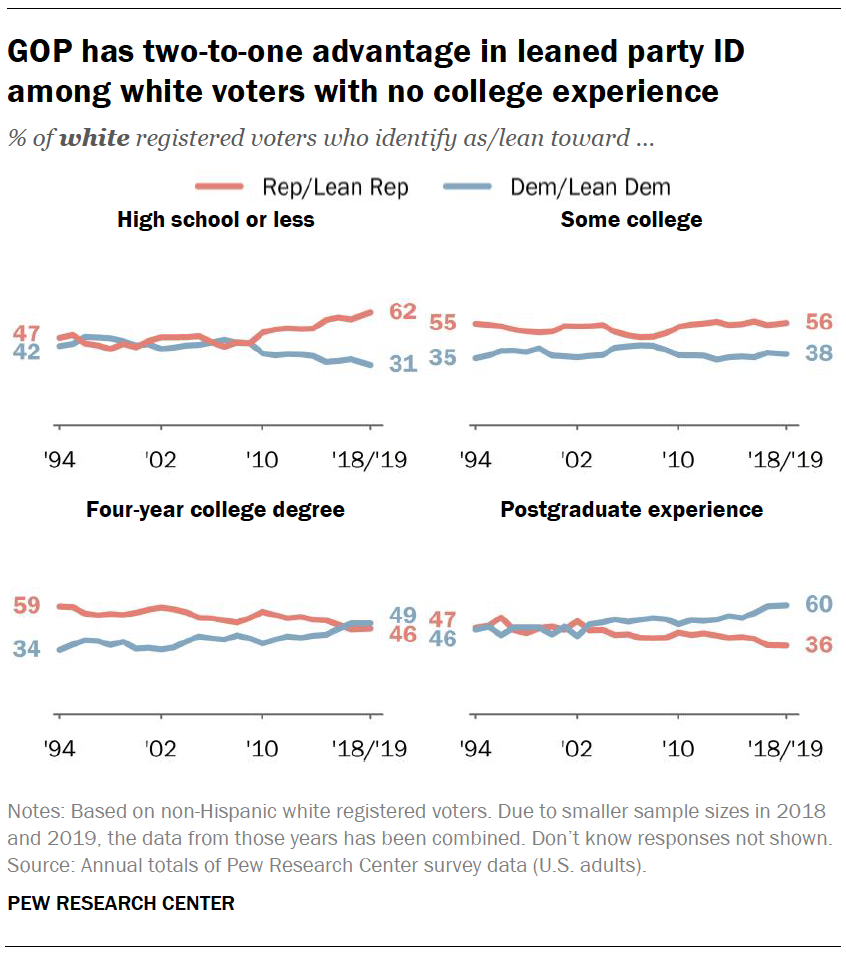 Much
of the movement toward the Republican Party among white voters without a
college degree has been driven by those with the lowest levels of
education – voters with no more than a high school diploma. The GOP now
enjoys a two-to-one advantage over the Democratic Party among white
voters with no more than a high school diploma (62% to 31%). That
represents a dramatic change from the end of the George W. Bush
administration, when this group was about evenly divided in leaned party
identification.
 There has been less change among white voters with some college experience but no four-year degree. This group continues to tilt Republican, and the current balance of leaned party identification (56% to 38%) is similar to other points in the recent past.
Among white voters with a college degree, those with some postgraduate experience stand out for their strong Democratic orientation. Overall, 60% of white voters with postgraduate experience identify with or lean toward the Democratic Party, compared with 36% who identify with or lean toward the GOP. Among white voters with a college degree but no postgraduate experience, 49% identify with or lean toward the Democratic Party, while 46% identify with or lean toward the Republican Party.
Both groups have experienced similar shifts toward the Democratic Party over the past 25 years. In 1994, white voters with at least some postgraduate experience were about evenly divided between the GOP and the Democratic Party, while those with a four-year degree were significantly more Republican than Democratic (59% to 34%). Put another way, in 1994 white voters with postgraduate experience were 12 points more likely than whites with a college degree to associate with the Democratic Party; today that gap remains about the same (11 points).
In the past 10 years, both men and women without a college degree have edged toward the GOP in their leaned party affiliation. However, gender gaps among non-college voters persist: The Republican Party holds an advantage in leaned partisanship among men without a college degree (52% t0 40%), while the Democratic Party holds an edge among women without a college degree (51% to 42%).
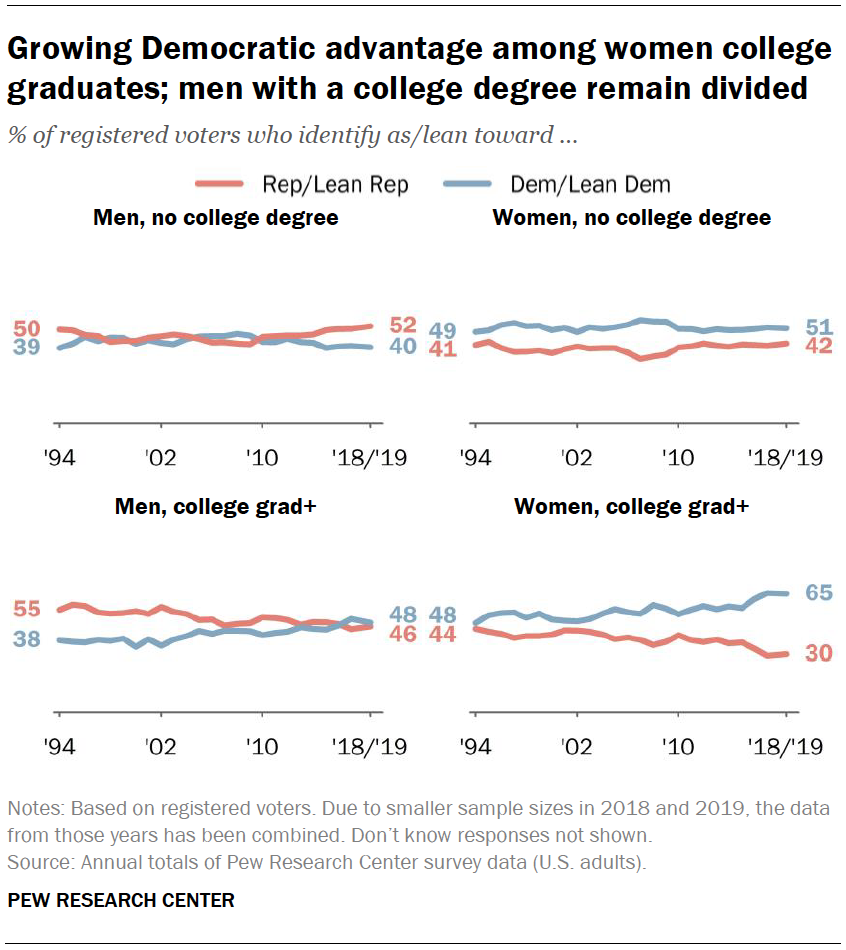 While
the partisan preferences of both men and women without a college degree
have moved toward the GOP over the past decade, this marks a return to
about the same levels of partisanship seen in 1994, as the Republican
Party has regained ground it had lost between the late 1990s and end of
the George W. Bush administration.
 By contrast, men and women with a college degree are significantly more Democratic in their orientation than 25 years ago. Still, a wide gap in leaned party affiliation remains between college-educated men and women.
Among men with a college degree, 48% identify with or lean toward the Democratic Party, while 46% of these voters identify with or lean toward the GOP. Among women with a college degree, the Democratic Party holds a wide 35-point advantage in leaned party affiliation (65% t0 30%).
Both groups are far more Democratic in their partisan preferences than in 1994, though the movement toward the Democratic Party has been slightly greater among women than men. Women voters with a college degree are 17 points more likely to identify with or lean toward the Democratic Party than they were 25 years ago, while there has been a 10-point increase among men with a college degree.
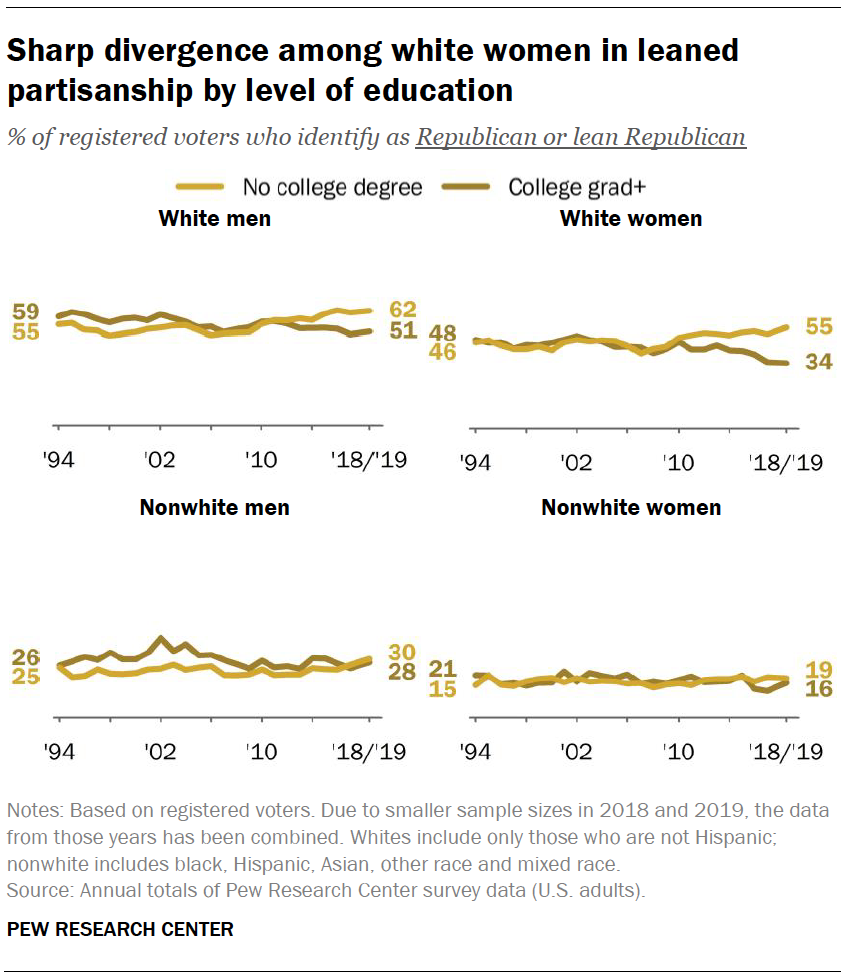 The
broader trends in leaned party affiliation by gender and education can
be seen among white voters. In particular, white women with a college
degree have moved sharply away from the GOP. While white men with a
college degree have also moved away from the GOP, the sharper movement
among college-graduate white women has expanded the partisan gap between
the two groups.
 In 1994, white men with a college degree were somewhat more likely than those without a college education to identify with or lean toward the GOP (59% to 55%). Over the past 25 years, white male voters with a four-year degree have moved away from the GOP, while those without a degree have moved toward the party. As a result, white men without a college degree are now 11 points more likely than those with a degree to associate with the GOP (62% to 51%).
This pattern is even more pronounced among white women. In 1994, white women voters with a college degree were 2 points more likely than those without one to identify with or lean toward the GOP (48% to 46%). Today, a majority of white women without a college degree (55%) identify with or lean to the GOP, compared with just 34% of white women with a four-year college education.
The current 21-point gap in GOP affiliation between white women with and without a college degree is larger than the 11-point education gap among white men.
In addition, the partisan gap between white men and women with a college degree is wide and has grown over time. Among voters with a college degree, white men are 17 points more likely than white women to identify with or lean toward the GOP. This gap was smaller (11 points) in 1994. The current gender gap among white college graduates is much wider than the 7-point difference in GOP affiliation between white men and women without a college degree.
Among nonwhite voters, while there is a gender gap, there is very little difference in the partisanship of either men or women by level of education. Between 1994 and 2010, nonwhite men with a college degree were slightly more Republican in their partisan leanings than those without a degree, but this gap has closed in recent years.
Generational divides in partisanship
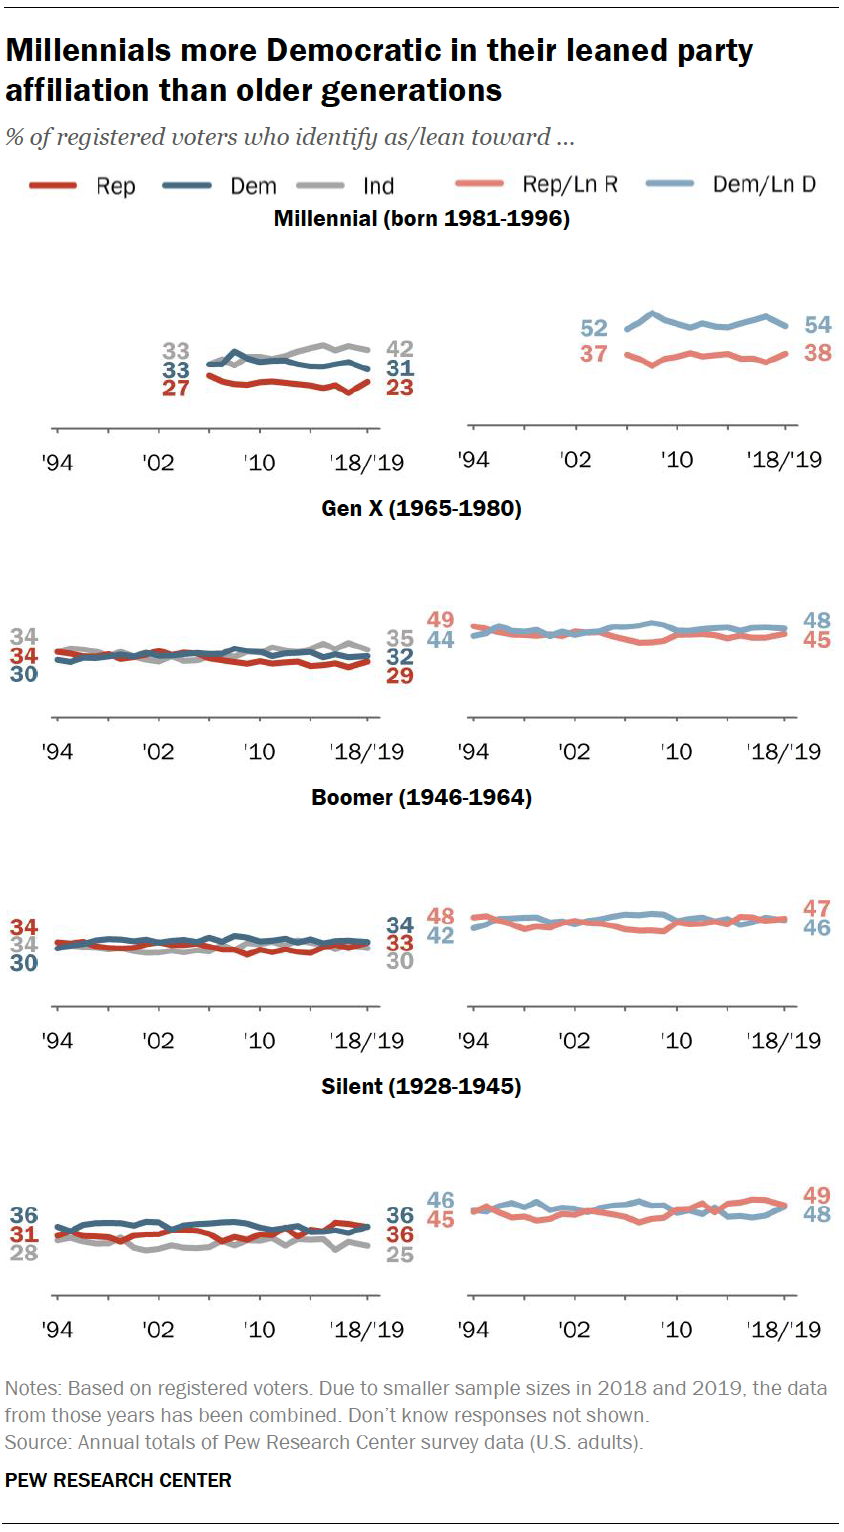 Generation
continues to be a dividing line in American politics, with Millennials
more likely than older generations to associate with the Democratic
Party. However, over the past few years the Democratic Party has lost
some ground among Millennials, even as it has improved its standing
among the oldest cohort of adults, the Silent Generation. Gen Xers and
Baby Boomers have seen less change in their partisan preferences and
remain closely divided between the two major parties. (Note: The
youngest registered voters – those 18 to 23 in 2020 – are now members of Generation Z;
however, due to the relatively small share of this generation in
adulthood, this generational analysis does not include them.)
 Overall, 54% of Millennial registered voters say they identify with or lean toward the Democratic Party, compared with 38% who identify with or lean toward the GOP. In 2017, the Democratic Party held a wider 59% t0 32% advantage among this group. However, the Democratic Party’s standing with Millennials is about the same as it was at earlier points, including 2014.
Voters in the Silent Generation are now about equally likely to identify with or lean toward the GOP as the Democratic Party (49% to 48%). This marks a change from 2017, when the GOP held a 52% to 43% advantage in leaned party identification among the oldest voters. Still, the partisan leanings of Silent voters have fluctuated over the past few decades, and there have been other moments where the two parties ran about even – or the Democratic Party held a narrow advantage – since 1994.
Gen Xers and Baby Boomers are closely divided in their partisan leanings. Among Gen X voters, the Democratic Party holds a narrow 48% to 45% advantage in leaned party affiliation. Among Baby Boomer voters, 47% identify with or lean toward the GOP, while 46% identify with or lean toward the Democratic Party. Both generations have been about evenly split in their partisan leanings for most of the past decade.
When looking at straight party identification – and not taking the partisan leaning of independents into account – younger voters continue to be more likely to identify as independent than older voters. Among Millennials, 42% identify as independents, compared with 35% of Gen Xers, 30% of Baby Boomers and 25% of Silents.
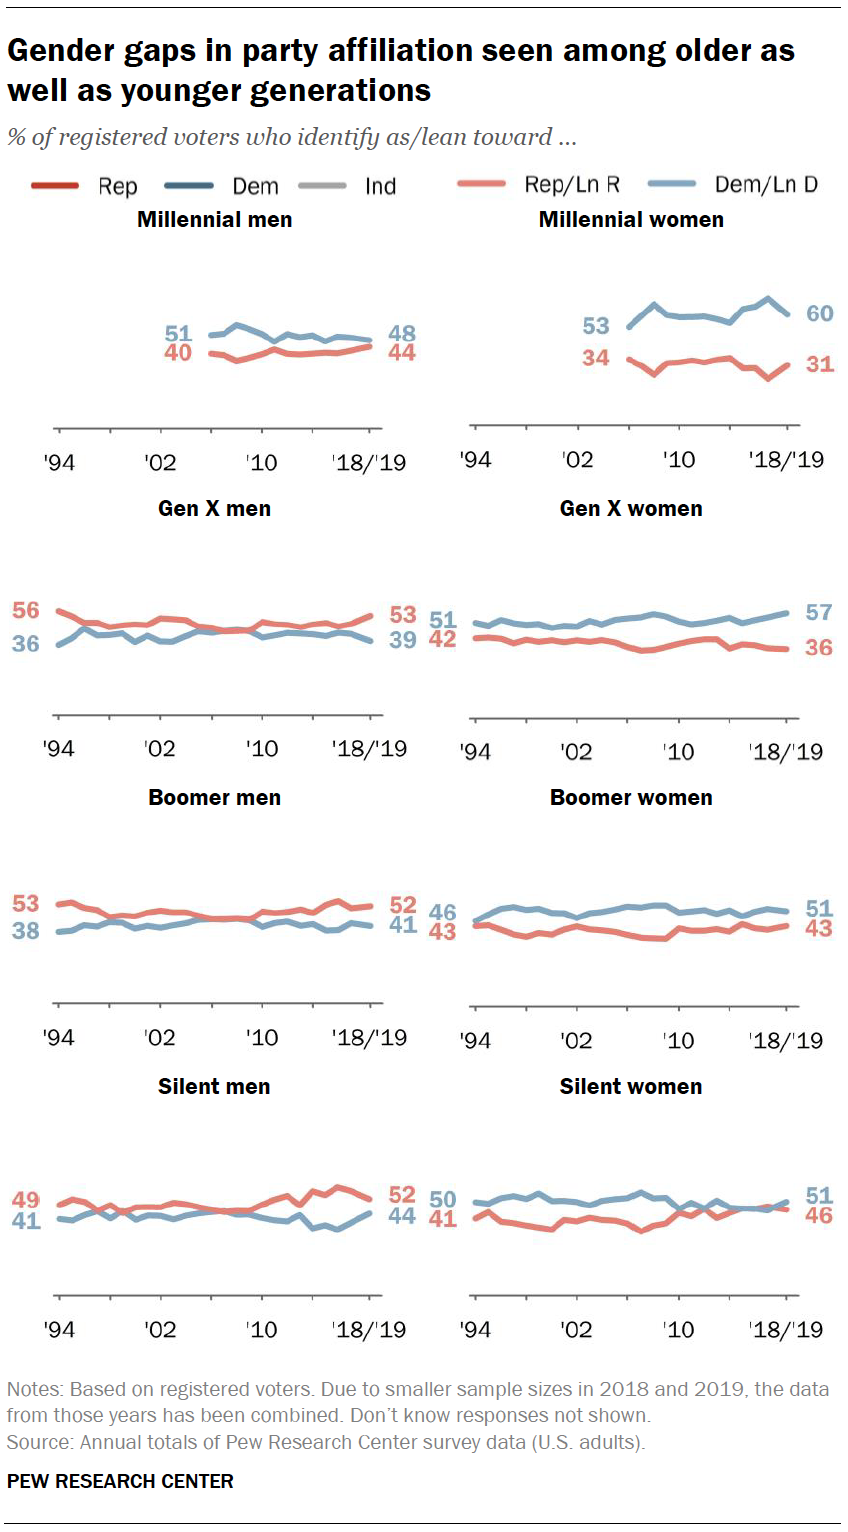 Across all generations, women remain more likely than men to associate with the Democratic Party.
 For instance, among Millennial voters, women are 12 points more likely than men to identify with or lean toward the Democratic Party (60% to 48%). The gap between the shares of women and men who associate with the Democratic Party is 18 points among Gen Xers, 10 points among Baby Boomers and 7 points among Silents.
However, there have been notable shifts in leaned party affiliation within generations by gender in recent years.
Millennial women voters are 10 points less likely to identify with or lean toward the Democratic Party than they were in 2017. While the Democratic Party still holds a wide 60% to 31% advantage among this group, it’s significantly smaller than it was in 2017 (70% to 23%), which was a high-water mark for the party among this group.
Millennial men have edged toward the GOP in recent years, but the shift in their leaned partisanship has been much smaller than among Millennial women.
Among Gen X voters, the partisan leanings of men and women have moved in opposite directions in the past few years. Gen X women are 3 points more likely to identify with or lean toward the Democratic Party than they were in 2017, while Gen X men have become 4 points more likely to associate with the GOP. As a result, the gender gap in leaned Democratic Party affiliation between Gen X men and women has grown from 11 points in 2017 to 18 points in combined 2018-2019 data. And Gen X women are now almost as likely as Millennial women to associate with the Democratic Party (57% to 60%).
There has been little change in the partisan leanings of men and women Baby Boomers in recent years. Among Silent Generation voters, the Democratic Party has improved its standing somewhat with both men and women.
Across all generations, the Democratic Party now holds an edge among women in leaned party affiliation (though the size of their advantage is larger among younger than older generations). Among men, the GOP has an advantage among Gen Xers, Baby Boomers and Silents, but trails the Democratic Party in leaned party affiliation by 4 points among Millennial men.
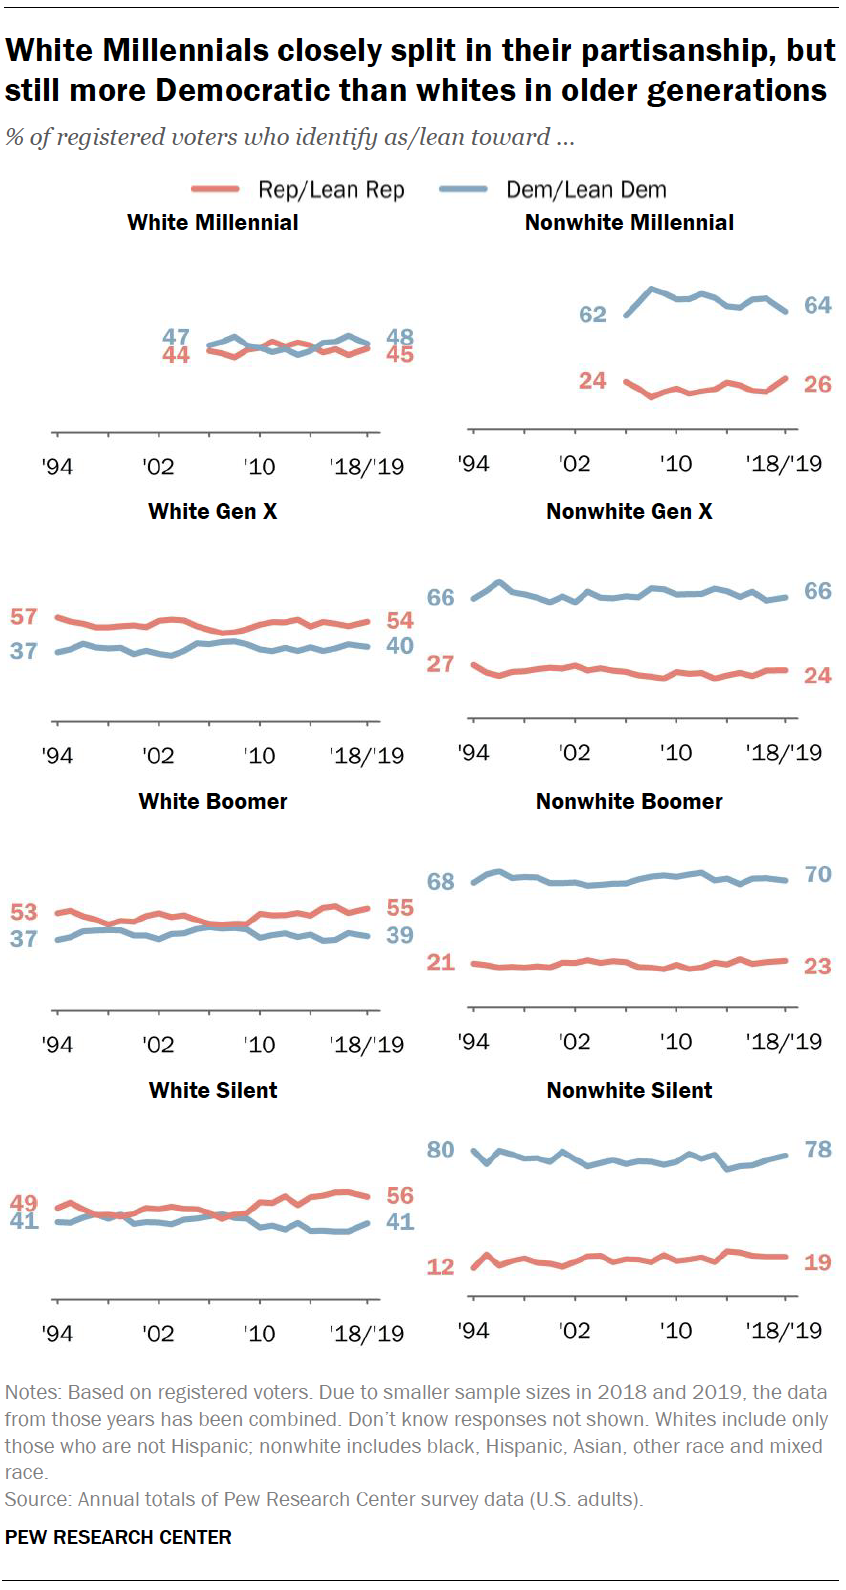 As with voters overall, there are wide divides in leaned partisanship by race and ethnicity across generations.
 White voters in all generations are significantly more likely to identify with or lean to the GOP than nonwhite voters. However, the size of the partisan gap by race and ethnicity is wider among older generations than among younger ones.
Among white Millennial voters, the Democratic Party holds a narrow 48% to 45% advantage in leaned party identification. A clear majority of nonwhite Millennials (64%) identify with or lean to the Democratic Party; just 26% identify with or lean to the GOP.
The Republican Party holds an advantage among white voters in older generations. Comparable majorities of white Gen X (54%), Baby Boomer (55%) and Silent (56%) voters identify with or lean toward the GOP.
Among nonwhite voters, about two-thirds or more identify with or lean to the Democratic Party. The size of the majority associating with the Democratic Party tends to be larger among older nonwhite generations than younger ones: 78% of Silents, 70% of Baby Boomers, 66% of Gen Xers and 64% of Millennials identify with or lean toward the Democratic Party.
As a result of these patterns, the gap in Democratic affiliation between white and nonwhite voters is 16 points among Millennial voters, but rises to 26 points among Gen Xers, 31 points among Baby Boomers and 37 points among Silents.
Religious divides in partisanship
Partisanship has become increasingly tied to religious identification over the past quarter century.
White evangelical Protestants have seen one of the largest moves toward the GOP over the past 25 years. In 1994, 61% of white evangelical Protestant voters leaned toward or identified with the Republican Party, while 31% leaned toward or identified with the Democratic Party. Today, the GOP has opened up an overwhelming 78% to 17% advantage in leaned partisanship among white evangelicals, making them the most solidly Republican major religious grouping in the country.
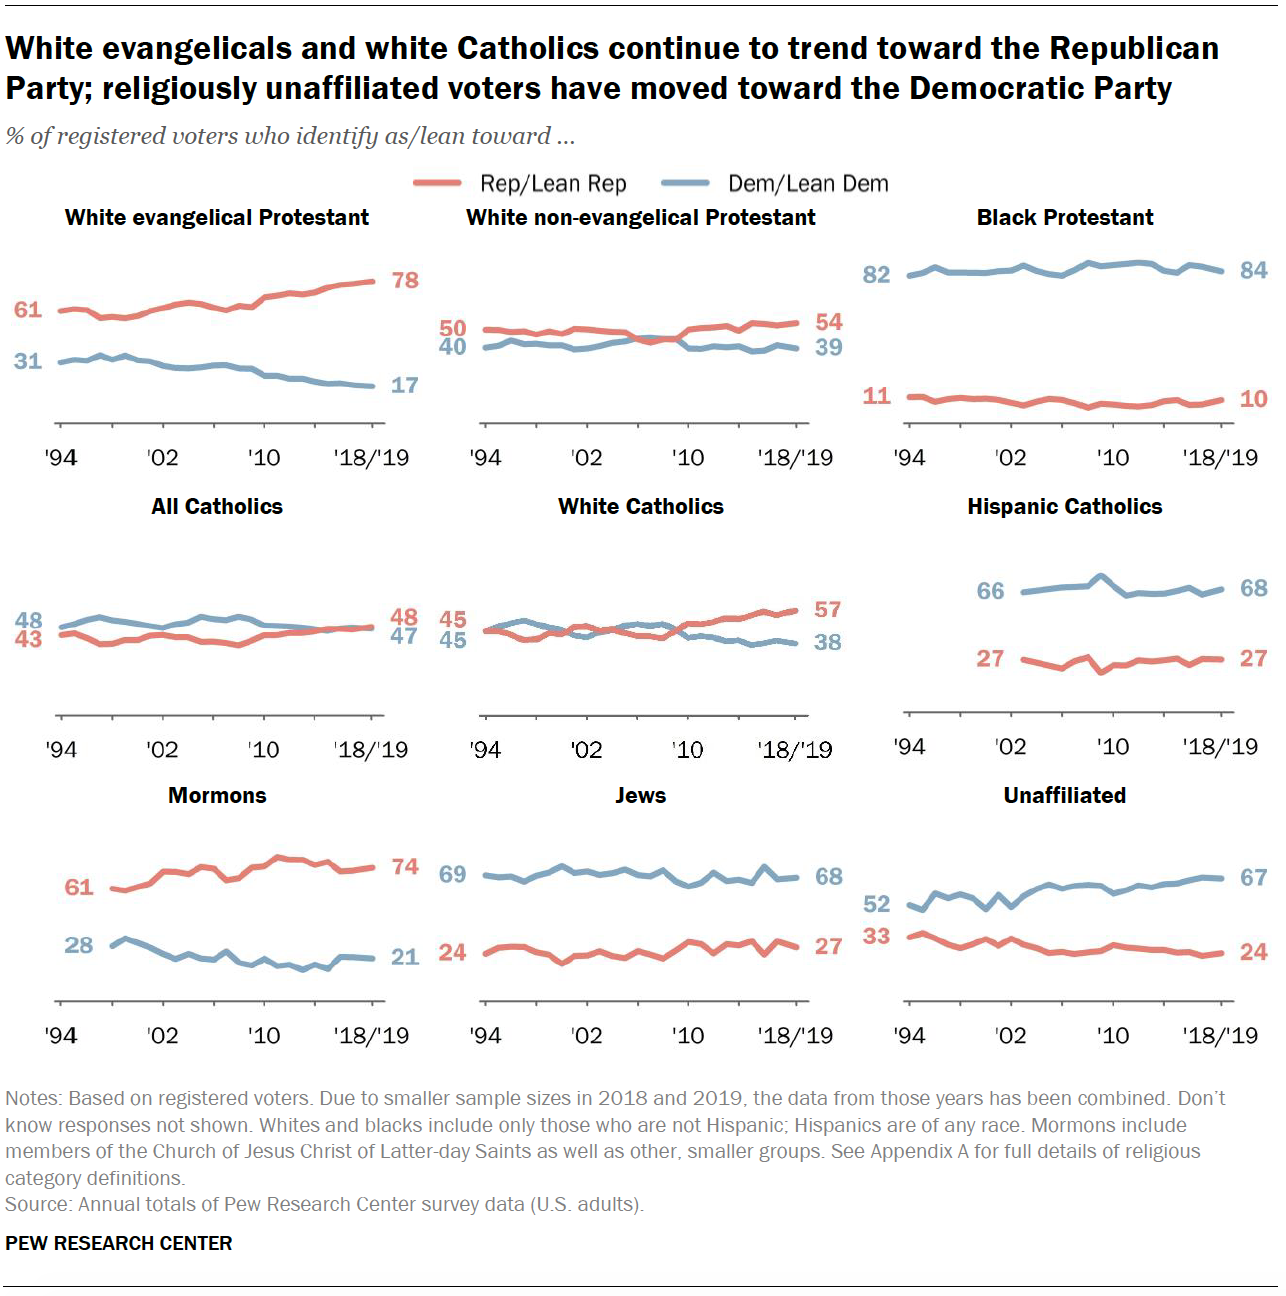
The GOP holds somewhat narrower advantages in leaned party identification among white non-evangelical Protestants (54% to 39%) and white Catholics (57% to 38%). Both groups of voters have moved toward the Republican Party over time, though the shift has been more pronounced among white Catholics.
Hispanic Catholics stand out from their white counterparts in their association with the Democratic Party. Roughly two-thirds of Hispanic Catholics (68%) identify with or lean toward the Democratic Party. The partisan leanings of Hispanic Catholics have not changed much in recent years.
Among those who do not affiliate with an organized religion, 67% identify with or lean to the Democratic Party, compared with just 24% who identify or lean toward the GOP. Religiously unaffiliated voters have been trending steadily toward the Democratic Party over the past few decades and represent a growing share of all registered voters (See Chapter 2 for more on the changing profile of the electorate).
Voters who attend religious services more frequently are generally more likely than those who attend less often to identify with or lean toward the Republican Party. This gap is especially pronounced among Jewish voters.
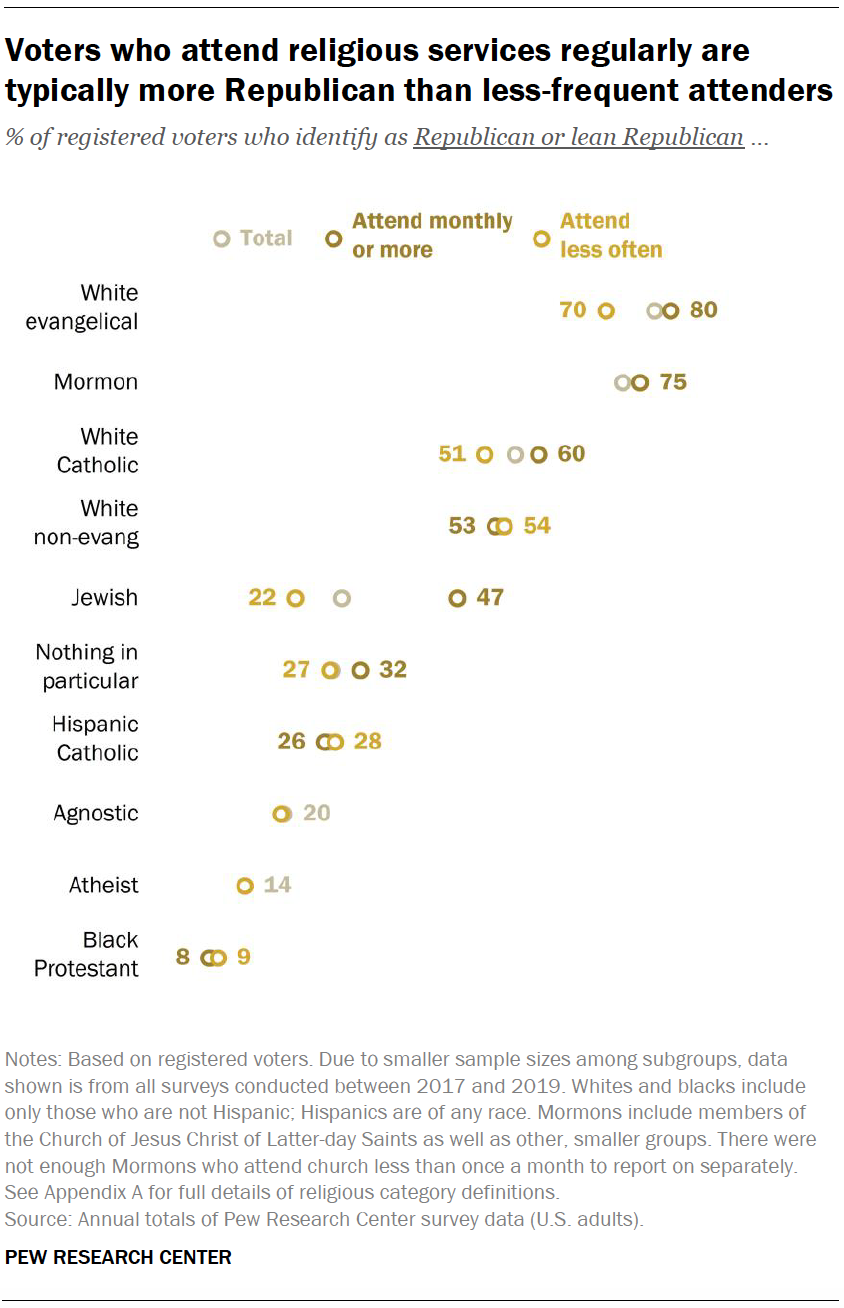 Overall,
the Democratic Party holds a 68% to 27% advantage in leaned party
identification over the GOP among all Jewish voters. However, nearly
half (47%) of Jewish voters who attend religious services at least a few
times a month identify with or lean toward the Republican Party,
compared with a much smaller share (22%) of those who attend services
less often.
 This same pattern is seen among several other religious groups, including white evangelicals, though it is not as pronounced as among Jewish voters.
Eight-in-ten white evangelicals who attend religious services at least a few times a month associate with the GOP, compared with 70% of those who attend services less often. A similar sized gap exists among white Catholics.
Among other religious groups, there is little relationship between religious attendance and partisanship. Among both white non-evangelical Protestants and black Protestants, there are only small differences in partisanship between those who attend church monthly and those who attend less frequently.
Geographic divisions in partisanship
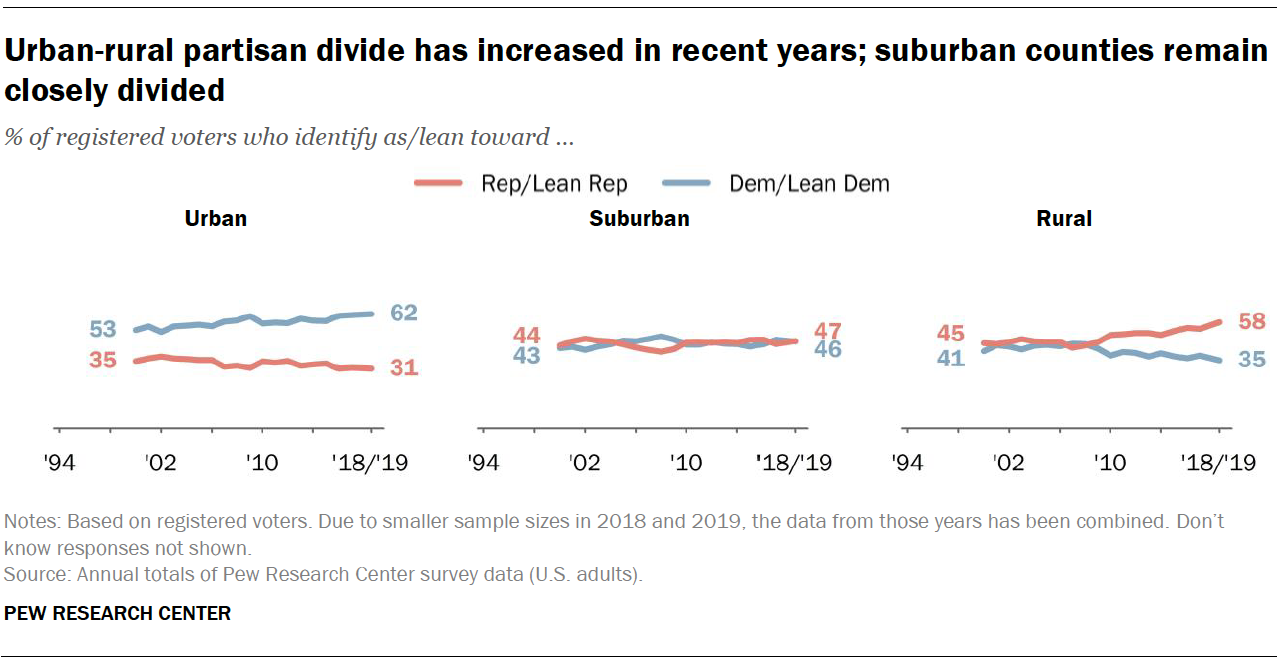
Voters living in urban counties and those living in rural counties have grown further apart in their partisan preferences over the last few decades.
Among voters living in urban counties, the Democratic Party holds a tw0-to-one advantage in leaned party identification (62% to 31%). By contrast, 58% of voters living in rural counties identify with or lean toward the GOP; 35% identify with or lean toward the Democratic Party.
In 1999, the first year for which Pew Research Center surveys have county-level data, rural counties were about evenly divided in their partisanship. Since then, GOP affiliation among voters in rural counties has increased 13 points, with much of this movement occurring over the past 10 years or so. Voters in urban counties already tilted Democratic in 1999 (53% to 35%); still, the Democratic Party’s standing among these voters has increased 9 points over the past two decades.
Voters in suburban counties are about evenly divided in their leaned party affiliation, as they have been for much of the past 20 years.
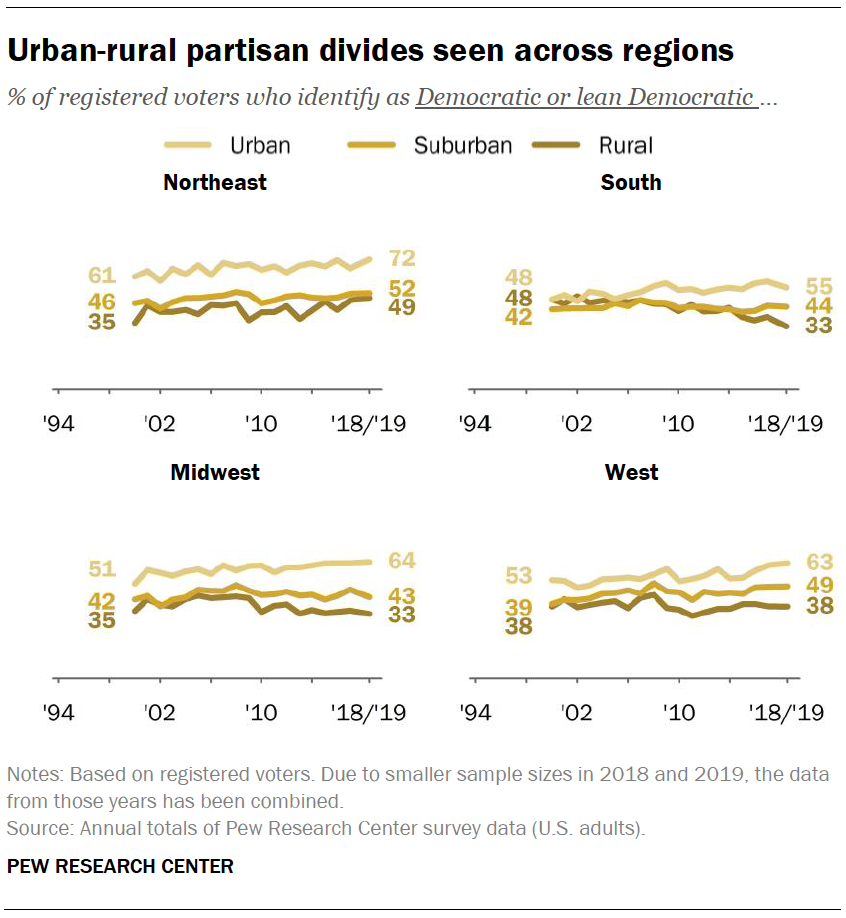 Across
different regions of the country, voters living in urban counties are
substantially more likely than those living in rural counties to
identify with or lean toward the Democratic Party.
 For example, 72% of voters in the Northeast who live in urban counties associate with the Democratic Party, compared with 49% of Northeastern voters who live in rural counties.
Southern voters in urban counties are less likely than their Northeastern counterparts to identify with or lean toward the Democratic Party (55% vs. 72%). Still, urban voters in the South are much more likely than rural Southern voters to align with the Democratic Party (55% vs. 33%).
While there is an urban-rural gap in leaned partisanship across regions, the trajectory of changes over time varies. For instance, the current gap in the South is far larger than it was 20 years ago and has been driven by a sharp move away from the Democratic Party among rural voters. In the Northeast, the urban-rural gap is roughly the same size as it has been for most of the past two decades, and rural voters there have become more likely to identify with or lean toward the Democratic Party over time.
The changing composition of the electorate and partisan coalitions
The demographic profile of voters has changed in important ways over the past two decades. Overall, the electorate is getting older, and this is seen more among Republican voters than among Democrats.
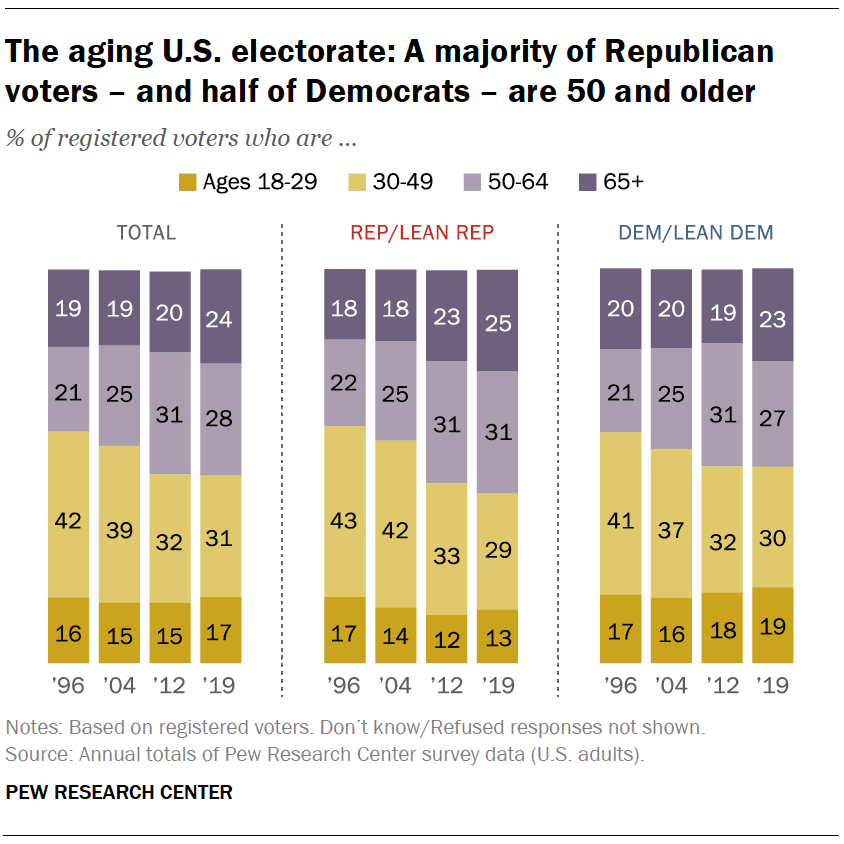 In
addition, the electorate, like the U.S. population, has become much
more racially and ethnically diverse. This shift is reflected much more
in the demographic profile of Democratic voters than among Republicans.
 A majority of all registered voters (52%) are ages 50 and older. This is little changed from 2012 (51%), though is much higher than in 2004 (44%) or 1996 (41%).
The shares of both parties’ voters who are ages 50 and older have increased over the past two decades.
However, while a majority of Republican and Republican-leaning registered voters are ages 50 and older (56%), a smaller share of Democratic and Democratic-leaning voters are in that age group (50%). In 1996, the age composition of the two parties looked more similar. Roughly four-in-ten voters in both parties were at least 50 years old (41% of Democrats, 39% of Republicans).
Nearly a quarter of voters (24%) are ages 65 and older, up from 20% eight years ago; by comparison, the share of voters who are under age 30 has remained relatively stable (17% currently). Voters who are 65 and older make up larger shares in both parties than do voters under age 30. However, the difference is much larger among Republican voters (25% are 65 and older, while 13% are under 30) than among Democrats (23% and 19%, respectively).
Over the past two decades, the median age of all voters has increased, from 44 in 1996 to 50 in 2019. Among Republicans, the median age has increased by nine years, from 43 to 52, while the median age of Democrats has risen from 45 to 49.
Electorate has become more ethnically diverse, better educated
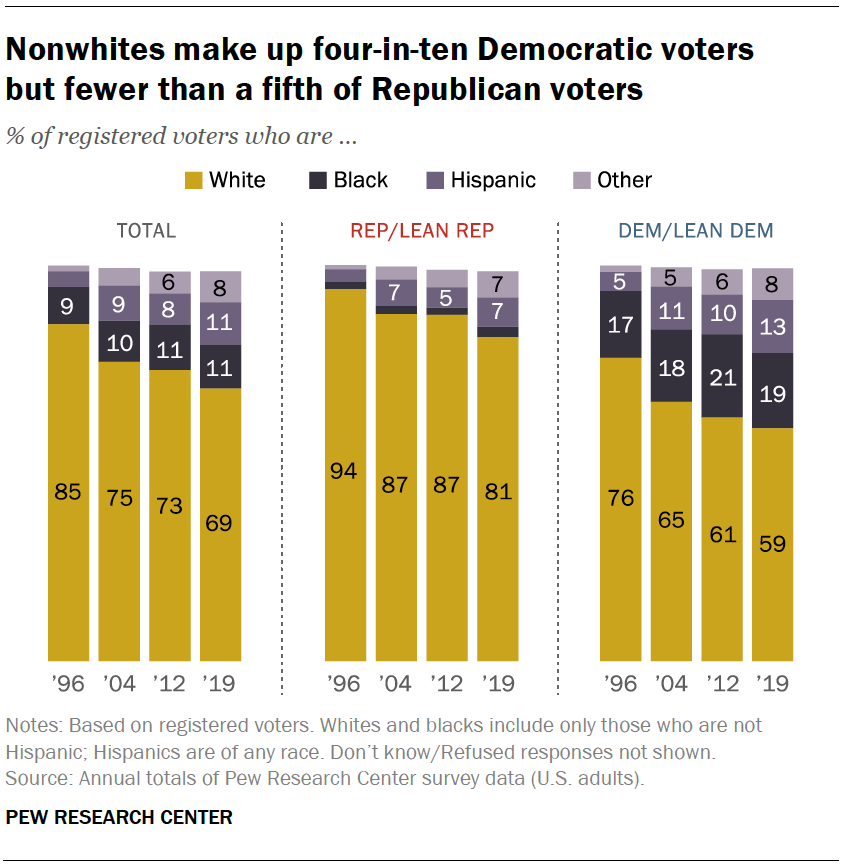 Non-Hispanic
white voters make up a steadily decreasing share of the electorate. In
1996, white non-Hispanics constituted an overwhelming majority (85%) of
registered voters. Today, 69% of voters are non-Hispanic white. Over
this period, the share of voters who are black, Hispanic or another race
has risen from 15% to 30%.
 Hispanic voters have nearly tripled since 1996 as a share of the electorate, and they make up 11% of all registered voters today, compared with 4% in 1996. Voters who describe their race as “other” have also become a larger share of the electorate, making up 8% of voters today, compared with just 1% of voters in 1996.
Black Americans make up 11% of registered voters, a similar share to 1996, when they were 9% of all registered voters.
The growing racial and ethnic diversity has changed the composition of both parties, but the change has been starker among Democrats.
While white registered voters make up a majority of the Democratic Party, their share has declined. In 1996, white voters constituted 76% of all Democratic and Democratic-leaning voters; today, they make up 59%. Four-in-ten Democratic voters are nonwhite, an increase from nearly one-in-four in 1996.
An overwhelming majority of Republican and Republican-leaning voters continue to be white. Today, whites make up roughly eight-in-ten (81%) Republican voters, down from 94% in 1996. Still, the share of nonwhite voters in the Republican Party has more than doubled in that time (6% in 1996, 17% in 2019).
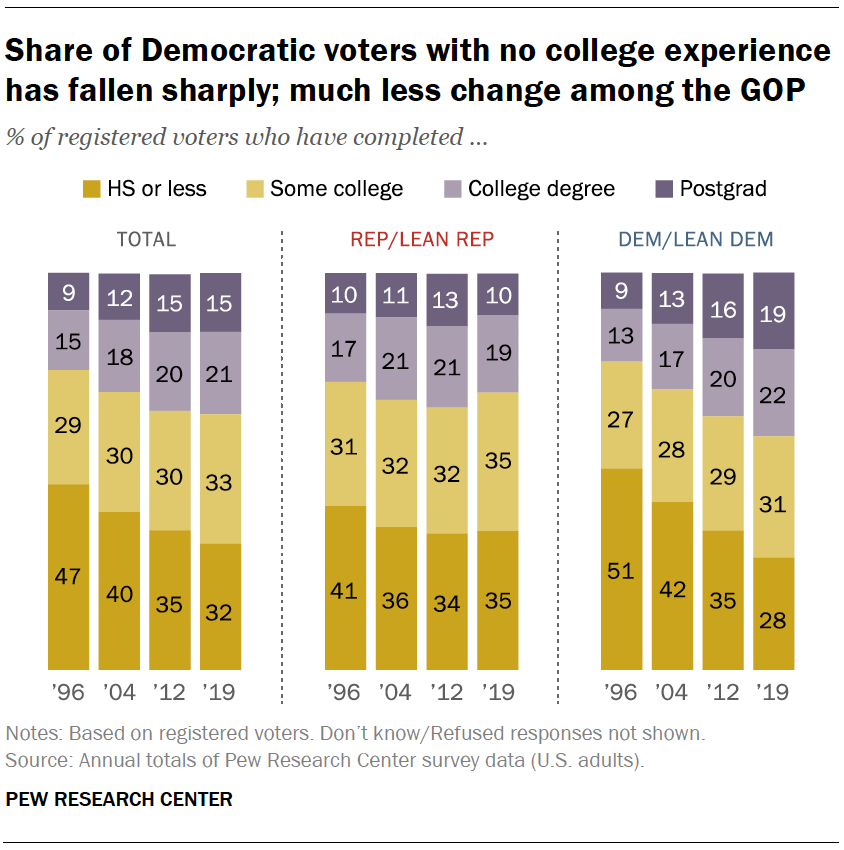 The
educational landscape of the U.S. has changed dramatically since 1996,
when Bill Clinton was seeking his second term as president.
 At that time, nearly half of registered voters (47%) had never attended college; another three-in-ten (29%) had some college experience but no four-year degree, and roughly a quarter (24%) had at least a four-year college degree.
Today, only 32% have never attended college, while another third have some college experience and no degree and 36% have at least a four-year degree.
The educational profile of Democratic voters has changed dramatically since 1996. At that time, voters with no college experience made up about half of Democratic voters (51%); today, just 28% have not attended college. The share of Democratic voters with at least a four-year degree has increased from 22% to 41%.
During the same period, the share of Republican voters with a four-year college degree is mostly unchanged (27% then to 30% today) and is down from 2012, when 34% of Republicans had a four-year college degree.
As a result, college graduates make up a much larger share of Democratic than Republican voters (41% vs. 30%). In 1996, Republican voters were more likely than Democrats to have at least a four-year degree (27% vs. 22%).
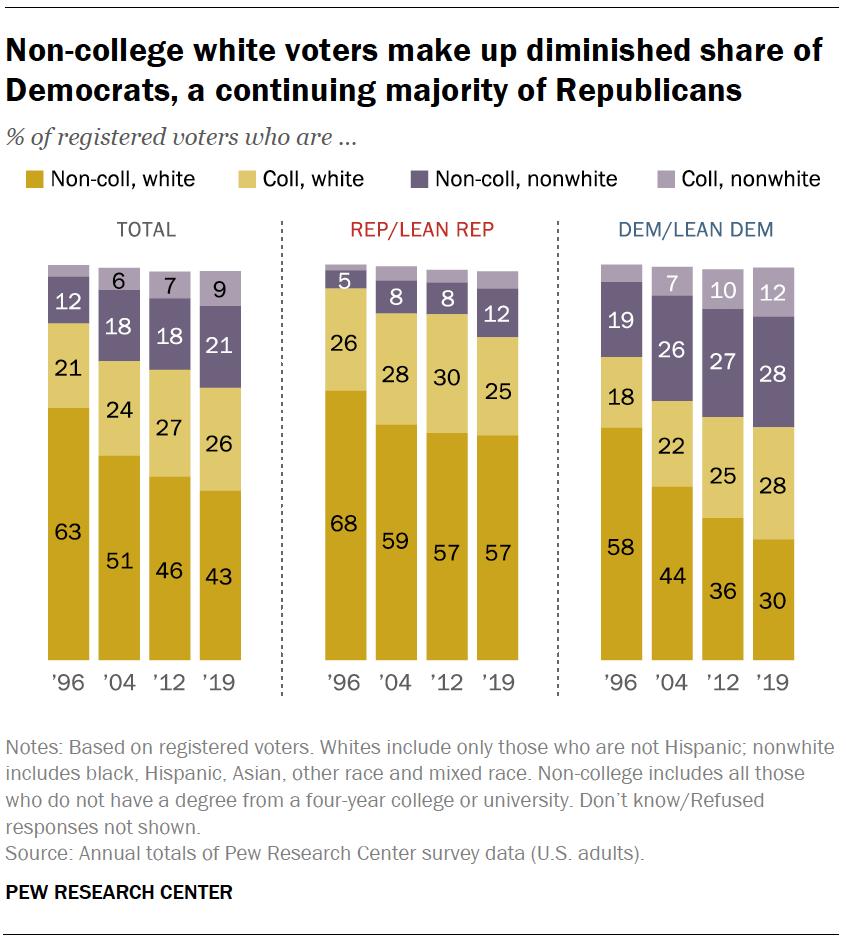 The
rise in educational attainment among voters, combined with the growing
ethnic diversity of the electorate, has had very different impacts on
the Democratic and Republican coalitions.
 In 1996, 63% of all registered voters, including majorities of Republicans (68%) and Democrats (58%), were whites who did not have a four-year college degree.
Since then, the share of non-college white voters has declined 20 percentage points. But while this group still constitutes a 57% majority of Republican voters – a share that has changed little since 2004 – non-college whites only make up 30% of Democratic voters.
The Democratic coalition is now a mix of non-college whites, whites with at least a four-year college degree (28%), nonwhites who have not completed college (also 28%) and nonwhites with at least a four-year degree (12%). The largest share of Republican voters are non-college whites (57%), followed by whites with a college degree (25%), nonwhites who do not have a degree (12%) and those who have completed college (4%).
Fewer voters identify as Christians as share who are religiously unaffiliated grows
The religious landscape of the United States has undergone major changes since 2008. As the share of registered voters who are religiously unaffiliated has increased, the share who identify as Christian has declined. More than one-quarter (28%) of voters identify as religiously unaffiliated today, up from 15% in 2008; those who identify as Christian decreased from 79% to 64% in that same period. (Data on religious affiliation dates to 2008; prior to that, Pew Research Center asked a different question about religious affiliation that is not directly comparable to its current measure.)
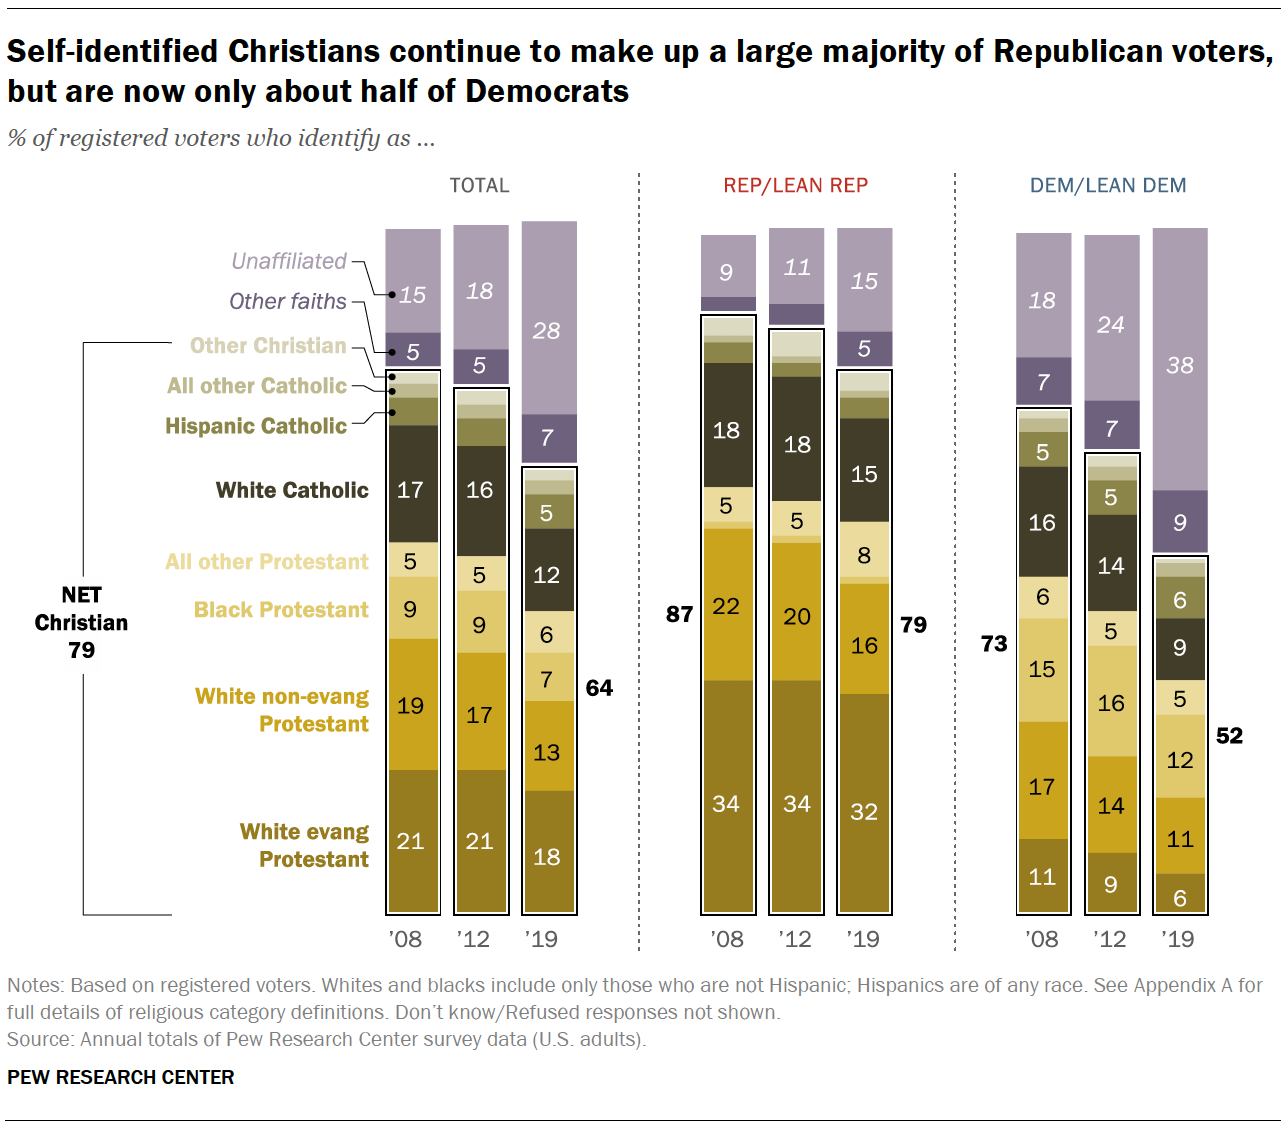
The largest declines among Christian voters have come from among white Christians. The shares of voters who are white evangelical Protestants (21% in 2008 vs. 18% today), white non-evangelical Protestants (19% vs. 13%) and white Catholics (17% vs. 12%) have all declined.
Religiously unaffiliated voters make up 38% of Democratic voters. This has roughly doubled since 2008, when this group made up 18% of Democrats. Over this period, the share of Democratic voters who are Christians has declined from 74% to 52%. White non-evangelical Protestants accounted for 17% of Democratic voters in 2008 but 11% today. There have also been similar declines in the shares of Democrats who are white evangelical Protestants, black Protestants and white Catholics.
White Christians continue to make up a large majority of Republican voters. White evangelical Protestants are about a third (32%) of Republican voters, unchanged from 2008. However, the shares who are white non-evangelical Protestants (22% in 2008 vs. 16% today) and white Catholics (18% vs. 15%) have decreased.
While religiously unaffiliated voters do not make up as large a share of Republicans as Democrats, they do make up a growing share of GOP voters. Today 15% of Republican voters do not identify with a religion, up from 9% in 2008.


