יום שני, 27 ביוני 2022

Twitter is the go-to social media site for U.S. journalists, but not for the public


Rubén Weinsteiner


More than nine-in-ten journalists in the United States (94%) use social media for their jobs, according to a recent Pew Research Center survey of reporters, editors and others working in the news industry. But the sites that journalists use most frequently differ from those that the public turns to for news.

Among journalists, Twitter clearly ranks at the top of the list for work-related tasks. Around seven-in-ten U.S. journalists (69%) say it is the social media site they use most or second most for their job. Twitter is followed by Facebook at 52% and, far lower on the list, by Instagram (19%), LinkedIn (17%) and YouTube (14%). None of the other sites asked about in the survey – Reddit, WhatsApp, TikTok, Discord, Twitch and Snapchat – were named by more than 4% of the journalists surveyed.

A different lineup emerges for the public. Among Americans overall, Facebook is the most widely used social media site for news, with 31% of U.S. adults saying they go there regularly for news. YouTube is the second-most frequently used site, with 22% of the public regularly getting news there. Fewer adults (13%) say they regularly get news on Twitter, despite the platform’s widespread use among journalists. Overall, a little under half of U.S. adults (48%) say they often or sometimes get news from social media sites.
How we did this
Demographic differences in journalists’ use of social media platforms

Among journalists, the use of social media for work purposes is common across all age groups, but there are differences in the sites that are turned to most frequently.

Twitter is a particular favorite among the youngest journalists, with 83% of those ages 18 to 29 identifying it as one of their most commonly used social media sites. In stark contrast, 45% of journalists 65 and older identify Twitter as one of their top two social media sites for work tasks. Instagram is also more popular among younger journalists (those under 50), while LinkedIn and YouTube are somewhat more popular among older journalists (those ages 50 and older).

Looking at race and ethnicity, Twitter is particularly popular among Asian American journalists, with 82% saying it is one of their most commonly used sites, compared with about seven-in-ten White (69%), Black (70%) and Hispanic journalists (71%). A third of Black journalists cite Instagram as one of the most common sites they use, as do 29% of Hispanic journalists and 24% of Asian journalists – all statistically higher than the 18% of White journalists who say the same.
Differences by the type of news organization journalists work for

The social media sites that journalists use also often vary by the characteristics of the news organizations they work for – including the organization’s original platform, the audience’s political makeup and the geographic focus of the organization’s work.

Journalists who say their organization started in television news stand out in several areas. Two-thirds of journalists in that group say Facebook is one of their most commonly used social media sites – the highest percentage of any platform group and dramatically higher than the 38% of those working at online organizations. Journalists who say they work for organizations that originated on TV are also most likely to include Twitter among their two most relied on sites (80% say this), while print journalists are the least likely to say this (62%). At the same time, television, as well as radio journalists, are less likely than online and print journalists to say LinkedIn is one of their top two sites.

Journalists’ use of social media sites also varies by what they identify as the political composition of their audience. Journalists who say they work at an outlet whose audience leans right politically are much more likely than those with left-leaning audiences to say Facebook is one of their top two social media sites for their work (67% vs. 45%). Conversely, journalists who say their organization has a left-leaning audience are twice as likely as those who say their organization has a right-leaning audience to use Instagram (24% vs. 12%).

The differences for Twitter are not as large, but three-quarters of journalists who say they work at an outlet with a politically left-leaning audience say it is one of the sites they most commonly use, compared with 66% of journalists whose organization’s audience tilts to the right politically.

Among journalists who say they work at a news organization with a community, city or county focus, Facebook is the most commonly used social media platform; 73% say it is one of their top sites. That number plunges to 33% among journalists at organizations with a national focus and to 30% for those working for internationally focused organizations.

Unlike Facebook, LinkedIn is more likely to be used by journalists at nationally or internationally focused news organizations. Around a quarter of journalists at national news organizations (25%) and international news organizations (27%) count LinkedIn among their most frequently used social media sites, compared with only 9% of journalists at community-focused news outlets and 12% of those working at outlets with a statewide focus. (Freelance and self-employed journalists were asked about the geographic focus of their work instead of the geographic focus of their organization’s work.).

Rubén Weinsteiner

יום ראשון, 26 ביוני 2022

Prevailing view among Americans is that U.S. influence in the world is weakening – and China’s is growing


Rubén Weinsteiner

Americans overwhelmingly view China as a “competitor” or an “enemy” to the United States, rather than a “partner.” And it appears that most U.S. adults do not think that their country is winning the competition for geopolitical influence, according to a recent Pew Research Center survey.

Nearly half of Americans (47%) say that the United States’ influence in the world has been getting weaker in recent years. Only about one-in-five say U.S. influence has been getting stronger, while 32% say U.S. influence has been staying about the same.

This is in stark contrast with views of China: Two-thirds of U.S. adults say that the country’s influence has been getting stronger in recent years. Roughly one-in-five Americans say China’s global influence is holding steady, and only one-in-ten say China’s influence has been weakening.
How we did this

Views of these two powers’ relative sway in the international arena are closely associated with both partisanship and ideology. Republicans and Republican-leaning independents are significantly more likely than Democrats and Democratic-leaning independents to say U.S. influence in the world has been getting weaker (63% and 37%, respectively). And self-described conservative Republicans are substantially more likely than moderate or liberal Republicans to hold this view (70% vs. 47%), while liberal Democrats are more inclined than conservative or moderate Democrats to say U.S. influence has been waning (43% vs. 32%).

Republicans are also more likely than Democrats to think that China’s international influence has been growing stronger in recent years (72% vs. 63%). Previous research has found that Republicans are more likely than Democrats to view China’s power and influence as a major threat to the U.S.

Once again, those on the ends of the ideological spectrum are more likely to hold this opinion. Nearly eight-in-ten conservative Republicans (78%) say China’s influence is growing, compared with 60% of moderate and liberal Republicans. Among Democrats, 72% of liberals think China’s influence is growing, while only 57% of moderates and conservatives say the same.

Men are somewhat more likely than women to say the United States’ influence in the world has been weakening, whereas women are more inclined to see stability in the country’s relative influence. Differences by age or education generally are more muted.
Views about the influence of other countries, international institutions

The survey also asked Americans about the global influence of several other countries, as well as a few major international institutions.

Amid the ongoing war in Ukraine, views of Russia’s influence are closely divided, with about equal shares saying Russia’s influence has been getting stronger (38%) and getting weaker (37%). Only about one-in-five Americans say Russia’s influence is staying the same.

There also is no consensus among Americans about the influence of NATO, the European Union and the United Nations. Among these three, the highest share of Americans say NATO’s influence on the global stage has been getting stronger in recent years (34%), with 39% saying its influence has been holding steady and a quarter saying NATO’s influence has been waning. Once again, these views are linked with partisanship and ideology: Liberal Democrats are the most likely to say NATO’s influence is getting stronger (42%), while conservative Republicans are the most likely to say NATO’s influence has been weakening (33%).

Russia’s discomfort with NATO expansion to Eastern Europe has been described by some as a motive for Russia’s invasion of Ukraine, after which Finland and Sweden announced bids to join the military alliance following decades of non-alignment. The EU also has had a role to play in the recent conflict, including discussions about Ukrainian membership and sanctions against Russia.

About one-in-five U.S. adults (22%) say the EU’s international influence is getting stronger, while about a third say its influence is weakening. A plurality (43%) thinks the EU’s influence is staying steady.

Americans are more negative about the UN’s influence, with about four-in-ten U.S. adults saying its influence has been waning in recent years. The UN Security Council has come under fire for failing to condemn Russia’s invasion of Ukraine, since Russia’s permanent seat on the Council means it has veto power over all resolutions. Just 16% of Americans say the UN’s influence in the world has been getting stronger.

Americans largely see stability in the influence of France, India, Germany and the United Kingdom, with six-in-ten or more saying the influence of these countries has been staying about the same in recent years. Notably, more than twice as many Americans say India’s influence is strengthening rather than weakening (23% vs. 11%). The opposite is true for the UK: 23% say its influence has been getting weaker and only 13% say it has been getting stronger.

Democrats are somewhat more likely than Republicans to say the influence of a few key U.S. allies (such as France, Germany, NATO and the EU) is growing. For example, about four-in-ten Democrats say NATO’s influence in the world has been getting stronger in recent years (39%), compared with about three-in-ten Republicans (29%).

On the other hand, Republicans are slightly more likely to say Russia’s influence in the world is growing. Ideology also factors into this assessment: Conservative Republicans are more likely than moderate and liberal Republicans to say that Russia’s influence has been growing in recent years.
Knowledge of international affairs connected with opinions

Opinions also are linked with respondents’ level of international knowledge. (International knowledge was measured on this survey with 12 multiple choice questions about global leaders, international institutions and geography. For more information on the international knowledge scale, see “How we designed a scale to measure Americans’ knowledge of international affairs.”)

Those with high levels of knowledge are significantly more likely than others to say that China, India and Germany have had growing international influence in recent years. In the case of China, the knowledge gap is quite large: 82% of those with high international knowledge think China’s influence has been getting stronger, while just 45% of those with low knowledge say the same.

The U.S. is the only country where more international knowledge is linked with more pessimistic views. Over half of Americans with high international knowledge (54%) say that U.S. influence in the world has been getting weaker, compared with about one-third of Americans with low international knowledge (35%).

Rubén Weinsteiner

יום שבת, 25 ביוני 2022

What the data says about abortion in the U.S.


By Rubén Weinsteiner


Pew Research Center has conducted many surveys about abortion over the years, providing a lens into Americans’ views on whether the procedure should be legal, among a host of other questions. In our
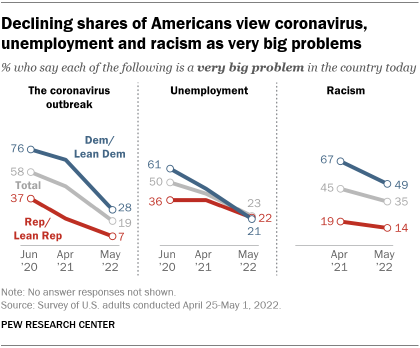
 most recent survey, 61% of U.S. adults say abortion should be legal all or most of the time, while 37% say it should be illegal all or most of the time.

With the U.S. Supreme Court’s decision in Dobbs v. Jackson Women’s Health Organization overturning Roe v. Wade, the 1973 case that effectively legalized abortion nationwide, here is a look at the most recent available data about abortion from sources other than public opinion surveys.
How we did this
How many abortions are there in the United States each year?

An exact answer is hard to come by. Two organizations – the Centers for Disease Control and Prevention (CDC) and the Guttmacher Institute – try to measure this, but they use different methods and publish different figures.

The CDC compiles figures voluntarily reported by the central health agencies of the vast majority of states (including separate figures for New York City) and the District of Columbia. Its latest totals do not include figures from California, Maryland or New Hampshire, which did not report data to the CDC. (Read the methodology from the latest CDC report.)

The Guttmacher Institute compiles its figures after contacting every known provider of abortions – clinics, hospitals and physicians’ offices – in the country. It uses questionnaires and health department data, and it provides estimates for abortion providers that don’t respond to its inquiries. In part because Guttmacher includes figures (and in some instances, estimates) from all 50 states, its totals are higher than the CDC’s. The institute’s latest full report, and its methodology, can be found here. While the Guttmacher Institute supports abortion rights, its empirical data on abortions in the United States has been widely cited by groups and publications across the political spectrum, including by a number of those that disagree with its positions.

The last year for which the CDC reported a yearly national total for abortions is 2019. The agency says there were 629,898 abortions nationally that year, slightly up from 619,591 in 2018. Guttmacher’s latest available figures are from 2020, when it says there were 930,160 abortions nationwide, up from 916,460 in 2019.

It’s worth noting that the figures reported by both organizations include only the legal induced abortions conducted by clinics, hospitals or physicians’ offices, or that make use of abortion pills dispensed from certified facilities such as clinics or physicians’ offices. They do not account for the use of abortion pills that were obtained outside of clinical settings.
How has the number of abortions in the U.S. changed over the years?
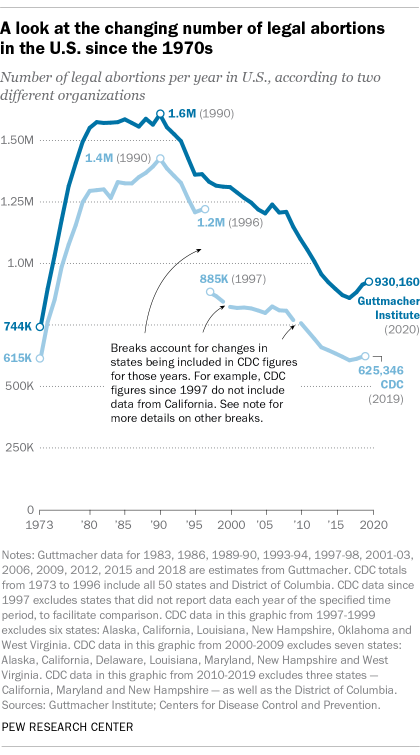
The annual number of U.S. abortions rose for years after Roe v. Wade legalized the procedure in 1973, reaching its highest levels around the late 1980s and early 1990s, according to both the CDC and Guttmacher. Since then it has generally decreased at what a CDC analysis called “a slow yet steady pace.”

Guttmacher recorded more than 1.5 million abortions in the U.S. in 1991, about two-thirds more than the 930,160 it reported for 2020. The CDC reported just over 1 million abortions in 1991 and 629,898 in 2019, looking at just the District of Columbia and the 47 states that reported figures in both years. (This line graph shows the long-term trend in the number of legal abortions reported by both organizations. To allow for consistent comparisons over time, the CDC figures in the chart have been adjusted to ensure that the same states are counted from one year to the next. Using that approach, the CDC figure for 2019 is 625,346 legal abortions.)

There have been occasional breaks in this long-term pattern of decline – during the middle of the first decade of the 2000s, and then again in the late 2010s. The CDC reported modest 1% and 2% increases in abortions in 2018 and 2019, respectively, while Guttmacher reported an 8% increase in abortions over the three-year period from 2017 to 2020.

As noted above, these figures do not include abortions that use pills that were obtained outside of clinical settings.
What is the abortion rate among women in the U.S.? How has it changed over time?

Guttmacher says that in 2020 there were 14.4 abortions in the U.S. per 1,000 women ages 15 to 44. Its data shows that the rate of abortions among women has generally been declining in the U.S. since 1981, when it reported there were 29.3 abortions per 1,000 women in that age range.

The CDC says that in 2019, there were 11.4 abortions in the U.S. per 1,000 women ages 15 to 44. (That figure excludes California, Maryland, New Hampshire and the District of Columbia.) Like Guttmacher’s data, the CDC’s figures also suggest a general decline in the abortion rate over time. In 1980, when the CDC reported on all 50 states and D.C., it said there were 25 abortions per 1,000 women ages 15 to 44.

That said, both Guttmacher and the CDC say there were slight increases in the rate of abortions during the late 2010s. Guttmacher says the abortion rate per 1,000 women ages 15 to 44 rose from 13.5 in 2017 to 14.4 in 2020. The CDC says it rose from 11.2 in 2017 to 11.4 in 2019. (The CDC’s figures for both of those years exclude data from California, Maryland, New Hampshire and the District of Columbia).
What are the most common types of abortion?

The CDC broadly divides abortions into two categories: surgical abortions and medication abortions. In 2019, 56% of legal abortions in clinical settings occurred via some form of surgery, while 44% were medication abortions involving pills, according to the CDC. Since the Food and Drug Administration first approved abortion pills in 2000, their use has increased over time as a share of abortions nationally. Guttmacher’s preliminary data from its forthcoming study says that 2020 was the first time that more than half of all abortions in clinical settings in the U.S. were medication abortions.

Two pills commonly used together for medication abortions are mifepristone, which, taken first, blocks hormones that support a pregnancy, and misoprostol, which then causes the uterus to empty. Medication abortion is approved for use until 10 weeks into pregnancy.

Surgical abortions conducted during the first trimester of pregnancy typically use a suction process, while the relatively few surgical abortions that occur during the second trimester of a pregnancy typically use a process called dilation and evacuation, according to the UCLA School of Medicine website.
How many abortion providers are there in the U.S., and how has that number changed over time?

In 2017, there were 1,587 facilities in the U.S. that provided abortions, according to Guttmacher. This included 808 clinics, 518 hospitals and 261 physicians’ offices.
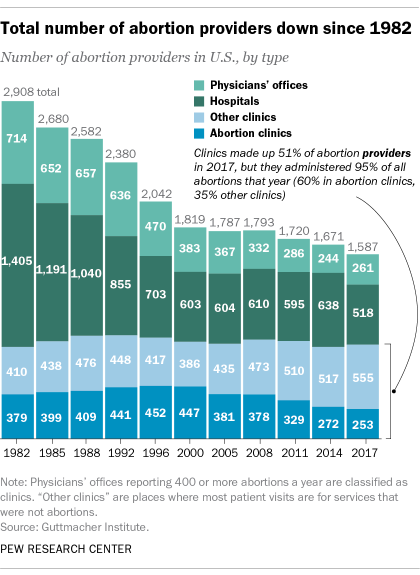
While clinics make up a slight majority (51%) of the facilities that provide abortions, they are the sites where the vast majority (95%) of abortions occur, including 60% at specialized abortion clinics and 35% at nonspecialized clinics, according to the 2017 data from Guttmacher. Hospitals made up 33% of the facilities that provided abortions but accounted for only 3% of abortions that year, while just 1% of abortions were conducted by physicians’ offices.

Looking just at clinics – that is, the total number of specialized abortion clinics and nonspecialized clinics in the U.S. – Guttmacher found a 2% increase between 2014 and 2017. However, there were regional differences. In the Northeast, the number of clinics that provide abortions increased by 16% during those years, and in the West by 4%. The number of clinics decreased during those years by 9% in the South and 6% in the Midwest.

The total number of abortion providers has declined dramatically since the 1980s. In 1982, according to Guttmacher, there were 2,908 facilities providing abortions in the U.S., including 789 clinics, 1,405 hospitals and 714 physicians’ offices.

Later this year, Guttmacher is expected to publish a similar breakdown of the types of abortion providers for 2020. The CDC does not track the number of abortion providers.
What percentage of abortions are for women who live in a different state from the abortion provider?

In the District of Columbia, New York City and the 47 states that provided information to the CDC in 2019, 9.3% of all abortions were performed on women whose state of residency was known to be different than the state where the abortion occurred – virtually the same percentage as in the previous year.

The share of reported abortions performed on women outside their state of residence was much higher before the 1973 Roe decision that stopped states from banning abortion. In 1972, 41% of all abortions in D.C. or the 20 states that provided this information to the CDC that year were performed on women outside their state of residence. In 1973, the corresponding figure was 21% in D.C. and the 41 states that provided this information, and in 1974 it was 11% in D.C. and the 43 states that provided data.

Anticipating that many states will further restrict abortion access, politicians in some states with permissive abortion laws such as New York, California and Oregon are expecting more women from states with less abortion access to travel to their states for an abortion.
What are the demographics of women who had abortions in 2019?

In the District of Columbia and 47 states that reported data to the CDC in 2019, the majority of women who had abortions (57%) were in their 20s, while about three-in-ten (31%) were in their 30s. Teens ages 13 to 19 accounted for 9% of those who had abortions, while women in their 40s accounted for 4%.

The vast majority of women who had abortions in 2019 were unmarried (85%), while married women accounted for 15%, according to the CDC, which had data on this from 41 states and New York City (but not the rest of New York).

In the District of Columbia and 29 states that reported racial and ethnic data on abortion to the CDC, 38% of all women who had abortions in 2019 were non-Hispanic Black, while 33% were non-Hispanic White, 21% were Hispanic, and 7% were of other races or ethnicities.

Among those ages 15 to 44, there were 23.8 abortions per 1,000 non-Hispanic Black women; 11.7 abortions per 1,000 Hispanic women; 6.6 abortions per 1,000 non-Hispanic White women; and 13 abortions per 1,000 women of other races or ethnicities in that age range, the CDC reported from those same 29 states and the District of Columbia.

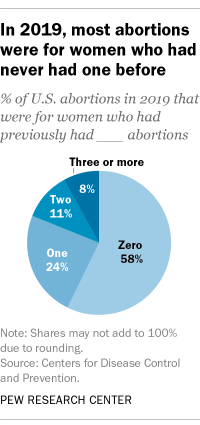
For 58% of U.S. women who had induced abortions in 2019, it was the first time they had ever had one, according to the CDC. For nearly a quarter (24%), it was their second abortion. For 11% of women, it was their third, and for 8% it was their fourth or higher. These CDC figures include data from 43 states and New York City (but not the rest of New York).

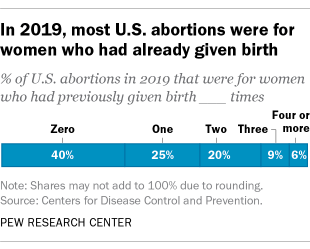
Four-in-ten women who had abortions in 2019 (40%) had no previous live births at the time they had an abortion, according to the CDC. A quarter of women (25%) who had abortions in 2019 had one previous live birth, 20% had two previous live births, 9% had three, and 6% had four or more previous live births. These CDC figures include data from 44 states and New York City (but not the rest of New York).
When during pregnancy do most abortions occur?

The vast majority of abortions – around nine-in-ten – occur during the first trimester of a pregnancy. In 2019, 93% of abortions occurred during the first trimester – that is, at or before 13 weeks of gestation, according to the CDC. An additional 6% occurred between 14 and 20 weeks of pregnancy, and 1% were performed at 21 weeks or more of gestation. These CDC figures include data from 42 states and New York City (but not the rest of New York).
How often are there medical complications from abortion?

About 2% of all abortions in the U.S. involve some type of complication for the woman, according to the National Center for Biotechnology Information, which is part of the U.S. National Library of Medicine, a branch of the National Institutes of Health. The center says that “most complications are considered minor such as pain, bleeding, infection and post-anesthesia complications.”

The CDC calculates case-fatality rates for women from legal induced abortions – that is, how many women die from complications from abortion, for every 100,000 abortions that occur in the U.S. The rate was lowest during the most recent period examined by the agency (2013 to 2018), when there were 0.4 deaths to women per 100,000 legal induced abortions. The case-fatality rate reported by the CDC was highest during the first period examined by the agency (1973 to 1977), when it was 2.1 deaths to women per 100,000 legal induced abortions. During the five-year periods in between, the figure ranged from 0.5 (from 1993 to 1997) to 0.8 (from 1978 to 1982). The CDC says it calculates death rates by five-year and six-year periods because of year-to-year fluctuation in the numbers and due to the relatively low number of women who die from abortion.

Two women died from induced abortion in the U.S. in 2018, in both cases from abortions that were legal, according to the CDC. The same was true in 2017. In 2016, the CDC reported seven deaths from either legal (six) or illegal (one) induced abortions. Since 1990, the annual number of deaths among women due to induced abortion has ranged from two to 12, according to the CDC.

The annual number of reported deaths from induced abortions tended to be higher in the 1980s, when it ranged from nine to 16, and from 1972 to 1979, when it ranged from 13 to 54 (1972 was the first year the CDC began collecting this data). One driver of the decline was the drop in deaths from illegal abortions. There were 35 deaths from illegal abortions in 1972, the last full year before Roe v. Wade. The total fell to 19 in 1973 and to single digits or zero every year after that. (The number of deaths from legal abortions has also declined since then, though with some slight variation over time.)

The number of deaths from induced abortions was considerably higher in the 1960s than afterward. For instance, there were 235 deaths from abortions in 1965 and 280 in 1963, according to reports by the then-U.S. Department of Health, Education and Welfare, a precursor to the Department of Health and Human Services. The CDC is a division of Health and Human Services.

יום שלישי, 21 ביוני 2022

Younger Americans still more likely than older adults to say there are other countries better than the U.S.


Rubén Weinsteiner


Young people in the United States express far more skeptical views of America’s global standing than older adults. They are also more likely to say it would be acceptable if another country became as militarily powerful as the U.S., according to a MARCA POLITICA research of U.S. adults conducted in July.


Overall, about half (52%) of Americans say the U.S. is “one of the greatest countries, along with some others.” Nearly a quarter say instead that the U.S. “stands above all other countries” (23%), while an identical share (23%) says “there are other countries that are better than the U.S.”

Opinions about the nation’s global standing have changed little since 2019. However, the share of adults saying there are other countries that are better than the U.S. is higher than it was a decade ago, with most of the increase coming among Democrats.

There continue to be wide age differences in views of how America compares with other countries. Roughly four-in-ten adults ages 18 to 29 (42%) say there are other countries that are better than the U.S. – the highest share of any age group.

Age differences in these views are evident within both partisan coalitions. A majority (55%) of Democrats and Democratic-leaning independents under age 30 say there are other countries that are better than the U.S., as do 38% of those 30 to 49. By comparison, just 20% of Democrats ages 50 and older say this.

Among Republicans and Republican-leaning independents, 18% of adults under 30 say there are other countries that are superior to the U.S., compared with just 6% of Republicans 50 and older who take this view. But younger Republicans are considerably less likely than older Republicans to say the U.S. is the greatest nation: 19% of those ages 18 to 29 say this, compared with 31% of those 30 to 49, 41% of those 50 to 64 and 54% of those 65 and older. Over the past two years, Republicans under age 30 have grown less likely to say that the U.S. stands above all other countries in the world: 19% express this view today, down from 34% in 2019. A far larger share now say that the U.S. is one of the greatest nations, along with some others (47% in 2019 vs. 62% today).

Views of how the U.S. compares with other countries have long been divided along partisan lines – and the partisan gap in views of the United States’ standing today remains large. Today, about a third of Democrats say there are other countries that are better than the U.S.; just 11% of Republicans say the same. And while 38% of Republicans say the U.S. stands above all other countries, just 12% of Democrats say this. These shares are roughly on par with partisans’ views of the U.S. in 2019.


Differences in views of the country’s global standing extend beyond partisanship. Pew Research Center’s 2021 political typology revealed stark differences among typology groups in views of the U.S., even within partisan coalitions. For example, Faith and Flag Conservatives are the only group in which a majority (69%) says the U.S. stands above all other countries; clear majorities of those in three other GOP-oriented typology groups overwhelmingly say instead that the U.S. is among the greatest nations in the world, along with some others. Conversely, Progressive Left (75%) and Outsider Left (63%) are the only typology groups in which majorities say there are other countries better than the U.S. Most of those in other Democratic-oriented groups take the position that the U.S. is among a small number of greatest countries in the world.

When it comes to views of America’s status as a military superpower, a majority of adults (60%) say that U.S. policies should try to maintain the country’s position as the only military superpower, while 36% say it would be acceptable if another country were to become as militarily powerful.


Mirroring age divides in attitudes about the United States’ global standing, younger adults are more likely than older adults to say it would be acceptable if another country became as militarily powerful as the U.S.

A majority (57%) of Democrats under age 30 say it would be acceptable if other nations became as militarily powerful as the U.S., while Democrats ages 30 to 49 are more divided on this question. Democrats 50 and older are more likely to say policies should try to keep it so the U.S. remains militarily superior than to say it would be acceptable for another country to gain similar military strength (58% vs. 37%).

Though a majority of Republicans across age groups say that U.S. policies should try to keep it so America is the only military superpower, 35% of Republicans under 30 say it would be acceptable if another country became as militarily powerful as the U.S., compared with smaller shares among older Republicans.

Rubén Weinsteiner

יום שני, 20 ביוני 2022

The political content in users’ tweets and the accounts they follow


 Rubén Weinsteiner

In addition to surveying users about their experiences on Twitter, researchers from the Center also examined the actual on-site behaviors of a subset of users from this representative panel of U.S. adults who provided their Twitter handles for research purposes. This analysis involved two separate data collections and analyses.

First, researchers collected every public tweet posted by these users between May 1, 2020, and May 31, 2021. In total, this collection resulted in a total of 959,254 tweets (of any kind) from 942 users. Researchers then used a custom-trained machine learning classifier to estimate which of those nearly 1 million tweets were related to political content, such as officials and activists, social issues, or news and current events.

Second, researchers collected profile information for all of the accounts followed by our panel and then manually categorized a sample of all the accounts followed by these users (2,859 accounts in total) as well as every account followed by 20 or more users (1,256 in total) into different account types.
One-third of posts from U.S. adults are estimated to be about politics

This analysis finds that a sizable share of the content posted by U.S. adult Twitter users is broadly political in nature. Of the nearly 1 million tweets examined in this analysis, 33% are estimated to include some form of political content. It also finds that political posting is fairly widespread across the Twitter population, as 65% of U.S. adults on Twitter posted or retweeted at least once about politics over the year under observation.

At the same time, political posting is an infrequent practice for most users. The typical (median) U.S. adult Twitter user posted just three posts containing political content over the course of the year – or approximately one political tweet every four months.

This seeming contradiction – that a majority of American Twitter users have tweeted about politics, and political content makes up one-third of all tweets from this group, but most users only tweet about politics occasionally – is explained by the fact that most Americans on Twitter tweet rarely, if ever, about any topic.

Conversely, a relatively small share of users tweet quite frequently. And as is the case of tweeting behavior more broadly, a minority of U.S. adult Twitter users produce the vast majority of political tweets. The Center’s analysis finds that a quarter of U.S. adults on Twitter produce 99% of all political tweets from this group.
Certain groups make an outsize contribution to the political discussion on Twitter

In the same way that a relatively small share of users produce a majority of political tweets from U.S. adults, certain demographic groups produce a larger share of political content on Twitter than others. Groups such as college graduates, Democrats and Democratic leaners, those ages 50 and older, and women each produce 70% or more of all tweets from U.S. adults mentioning politics or political issues.

In several cases, these groups that produce a majority of political tweets make up a large share of the U.S. adult Twitter population. For instance, the population of U.S. adults on Twitter contains a larger share of Democrats than Republicans. As a result, Democrats produce a larger share of political tweets than Republicans – even though political content makes up a comparable share of the tweets posted by a typical Democrat and a typical Republican.

In other cases, these groups simply produce a large number of tweets about any topic, whether those tweets are political or not. For instance, previous research from the Center has found that two-thirds of the most active tweeters among U.S. adults are women.

But neither of these is the case for those ages 50 and older, who contribute 78% of all political tweets from U.S. adults. These older users make up around one-quarter of all U.S. adult Twitter users, and produce roughly half (55%) of all tweets. But at the level of the average user, older adults are much more likely to tweet about politics than their younger counterparts. Political content makes up 36% of all tweets from the typical (median) U.S. adult Twitter user age 50 and older. That is roughly five times the share for the median 18- to 49-year-old, whose tweets are composed of just 7% political content.
Characteristics of the most active political tweeters

The most active political tweeters – defined in this analysis as those who posted more than 10 political tweets during the yearlong study period2 – are largely similar to other Twitter users in many of their basic demographic characteristics, such as educational attainment or party affiliation. However, there are prominent differences related to age: highly active political tweeters contain a larger share of users ages 50 and older (34%) compared with those who tweet less about politics (23%).

These highly active political tweeters are more likely than other U.S. adults on Twitter to participate in a variety of political and civic activities at higher rates, both on Twitter and offline. Compared with those who

tweet less about politics, a larger share say they have contributed financially to a political campaign or cause (46% vs. 21%) or have volunteered for a campaign or cause (20% vs. 8%). Additionally, larger shares say they primarily use Twitter to express their opinions, discuss politics with others at least weekly, or get news on Twitter.

At the same time, higher- and lower-volume political tweeters do not differ when it comes to some views about Twitter as a vehicle for political engagement. Similar shares of each group say Twitter is mostly a good thing for American democracy, or that the platform is at least somewhat effective at raising public awareness of political and social issues. And those who tweet about politics the most are actually less likely to think that Twitter is at least somewhat effective at changing people’s minds about political or social issues: 34% say this, compared with half (50%) of those who tweet less about politics.
Politicians and government figures are rare among all accounts followed by U.S. adults on Twitter, but much more common among the most-followed accounts

Twitter users follow a vast array of accounts: The 899 users in this sample collectively followed 502,475 accounts at the time of analysis.3 Very few of these accounts belong to people or entities directly related to politics or news media. Just 1% of these accounts belong to politicians, government figures or public offices, an identical share belong to policy or advocacy organizations, and another 3% belong to media outlets or journalists. Of the four categories researchers coded for this analysis, the largest share of accounts (26%) belong to the entertainment category.

But the bulk of these accounts (69%) belong to none of the categories coded by the Center. These accounts encompass a wide range of personal and professional affiliations and often defy easy categorization. But they generally are followed by a relatively small number of other accounts, and few are verified by Twitter.

However, political figures make up a much larger share of the accounts followed by large numbers of U.S. adult Twitter users. Among accounts followed by at least 20 Twitter users in our sample, 20% are governmental or political in nature accounts and another 25% are media outlets or journalists. These popular accounts also contain a larger share of policy or advocacy groups (6%) than the broader sample of accounts. As is true of accounts as a whole, entertainment is the most common category – accounting 36% of this group. But just 13% of accounts in this group do not fall into one of these four categories.


Rubén Weinsteiner

יום ראשון, 19 ביוני 2022

Politics on Twitter: One-Third of Tweets From U.S. Adults Are Political


Rubén Weinsteiner

Those ages 50 and older produce 78% of all political tweets from U.S. adults


Roughly one-quarter of American adults use Twitter. And when they share their views on the site, quite often they are doing so about politics and political issues. A new MARCA POLITICA analysis of English-language tweets posted between May 1, 2020, and May 31, 2021, by a representative sample of U.S. adult Twitter users finds that fully one-third (33%) of those tweets are political in nature.

Echoing the Center’s findings in its prior studies of tweeting behavior, whether political or otherwise, the vast majority of these political tweets are produced by a minority of users. And certain demographic groups are especially active contributors to the overall volume of political content on Twitter. Most notably, Americans ages 50 and older make up 24% of the U.S. adult Twitter population but produce nearly 80% of all political tweets. And 36% of the tweets produced by the typical (median) U.S. adult Twitter user age 50 or older contain political content, roughly five times the share (7%) for the tweets from the typical 18- to 49-year-old.

More broadly, Americans who tweet the most about politics differ in several ways from those for whom politics is a less central topic of discussion. These “high-volume” political tweeters are significantly more likely than other users to say that they use Twitter to express their own opinions (67% vs. 34%); that they talk about politics with others at least once a week (53% vs. 33%); that they contributed to a political campaign in the last year (46% vs. 21%); or that they participate in politics because they enjoy it, as opposed to viewing it as a civic duty (27% vs. 14%).

At the same time, a larger share of these politically vocal users say the people they follow on Twitter have similar political views to their own (45% vs. 25%). And despite – or perhaps because of – their regular forays into the world of political tweeting, those who tweet the most about politics are actually less likely than other users to say that Twitter is an effective way to get people to change their minds about political or social issues. Just 34% of the most active political tweeters feel this way, compared with half of those who tweet less about politics.

This analysis builds on the Center’s previous research on political content on Twitter, which identified relevant content using relatively strict, keyword-based approaches. For instance, our 2019 examination of politics on Twitter focused on discussions of politics at the national level and categorized tweets as political in nature only if they “mention[ed] or express[ed] support or opposition toward national politicians or elected officials, political parties, ideological groups or political institutions, or specific political behaviors like voting.” This definition excluded mentions of state or local politics and politicians, as well as discussions of policy issues and current events that carry a political valence but do not explicitly reference national political figures or groups.

This new analysis identifies political content with more nuance and subtlety. Researchers at the Center trained a supervised machine learning classifier on an expert-validated collection of tweets that human coders had read and categorized according to whether or not they referenced political officials and activists, social issues, or news and current events. This classifier was then able to learn the textual patterns and terms that lead human readers to recognize a tweet as “about politics” and identify such patterns in tweets that humans had not previously coded. With a broader definition of political content and a more flexible classifier, this analysis more comprehensively reflects the range and diversity of political discussion as it occurs on platforms like Twitter. Not surprisingly given these definitional differences, the current analysis identifies a larger share of tweets as political in nature.

Among the other major findings of this examination of the political characteristics, attitudes and online behaviors of U.S. adults on Twitter:

Retweets and quote tweets are more likely to contain political content than original tweets. This analysis of one year of tweets from a representative sample of U.S. adult Twitter users finds that certain types of tweets are more likely than others to contain political content. Roughly four-in-ten retweets (44%) and quote tweets (42%) from these users were found to pertain to politics. But that share falls to 26% for replies – and to just 8% for original tweets.

Democrats and Republicans who use Twitter have different political experiences on the site. A larger share of Democrats than Republicans (including political independents who “lean” toward either party) say they have tweeted about political or social issues in the 30 days preceding the survey (30% vs. 17%). And a larger share of Democrats say that Twitter is very effective at raising public awareness about political or social issues (28% vs. 17%).

Americans from each party also report seeing different types of political content on the site. Democrats who use Twitter are twice as likely as Republicans to say they mostly follow accounts with similar political beliefs to their own (40% vs. 20%) or that they disagree with few or none of the tweets they see (33% vs. 16%).

But some Twitter behaviors cross party lines. Notably, an identical share of Democrats and Republicans on Twitter (17%) say they tweeted about sports in the 30 days preceding the survey.

Political figures make up 20% of the accounts followed by a large number of U.S. adults. Politicians, government figures, public offices, and public officials make up just 1% of all the accounts followed by this representative sample of U.S. adult Twitter users. But these entities are far more prevalent among the most-followed accounts: Fully 20% of the accounts followed by at least 20 individual respondents fall into this category. Media organizations and journalists, as well as policy or advocacy organizations, are also notably more prevalent in the accounts that are widely followed by U.S. adults on Twitter.

“Twitter-only” political engagement is relatively rare. The Center’s survey asked about a variety of political behaviors that users might take, both on Twitter (such as tweeting about a political or social issue) and off (such as voting or contributing money to a campaign). The vast majority of Twitter users engaged in at least one of these activities in the preceding year. By far the largest share – 58% – engaged both on Twitter and elsewhere, and another 34% took part only in non-Twitter efforts. Just 3% of U.S. adult Twitter users say they took some sort of political or civic action on Twitter in the last year but did not do so outside the platform.

Users say political content makes up a larger share of what they see than of what they post. Some 41% of U.S. adult Twitter users say that a lot of what they see on Twitter is related to political or social issues. But just 12% say a lot of what they themselves post is related to these topics.
Survey Findings on Twitter users’ political attitudes and experiences


Twitter users report taking part in a variety of political and civic activities, both on Twitter and elsewhere. Of the 14 civic and political behaviors measured on the survey, a majority of Twitter users report that they voted in an election in the preceding year (78%), or that they bought – or avoided buying – a product because of the company’s social or political values (60%). Smaller shares attended a campaign event or rally (13%) or worked or volunteered for a political campaign or party (12%) over the same time frame. This survey was fielded in May 2021, so the preceding year included both the 2020 presidential election and the first year of the coronavirus pandemic.

When it comes to Twitter-specific activities, just under half of U.S. adult Twitter users (45%) report that they have tweeted about social or political issues in the last year. And around a third of users have used the platform in the last year to post humorous content or memes that touch on political issues (37%) or to express support for a political campaign or candidate (35%).

All told, 61% of U.S. adults on Twitter took part in at least one of the seven different Twitter-specific political activities included in the survey. But just 3% say they engaged in one or more Twitter-specific actions but none of the other activities included in the survey; 58% say they engaged in actions both on Twitter and elsewhere. Meanwhile, 34% of users say they took part in civic or political activities somewhere other than Twitter, but not on the site itself.
Democrats on Twitter are more likely than Republicans to have recently tweeted about politics, pop culture, and hobbies – but not sports

When asked about the different types of content they might post about on the site, around one-quarter of U.S. adult Twitter users say they have tweeted or retweeted about political or social issues (26%); music, movies or pop culture (23%); or their hobbies (23%) in the past 30 days, with another 17% saying they have posted about sports during that same time frame. Half of these users say they have ever posted about pop culture or their hobbies, while 47% have ever posted about politics and 40% say they have ever posted about sports.

A significantly larger share of Democrats than Republicans say they have tweeted or retweeted about politics in the last 30 days (30% vs. 17%), with an especially large share of liberal Democrats (37%) saying they have done so. Democrats are also more likely than Republicans to say they have recently tweeted about pop culture or about their hobbies. But identical shares of Democrats and Republicans (17%) indicate they have tweeted about sports in the last 30 days.
Users say political content makes up a larger share of what they see than of what they post

Some 41% of Twitter users report that a lot of what they see on Twitter is related to political or social issues. Another 36% say that some of what they see on the site relates to politics, and just 6% say that none of their feed is political in nature.

It is less common for these users to report engaging with political content in other ways. For instance, fewer than half of users say that a lot (19%) or some (25%) of what they like or retweet is related to politics, and 32% say none of their likes or retweets are political.

And an even smaller share of users say politics makes up a sizable share of what they themselves post on Twitter. Of the 53% of users who say they have ever tweeted about political issues, 23% say that a lot of what they tweet about is related to politics. That works out to just 12% of all U.S. adult Twitter users who say that they post a lot of content that they would categorize as political.
Twitter users see the platform as more effective at raising awareness than at changing minds

As is true of public attitudes toward social media more broadly, Twitter users generally see the platform as an effective way to raise public awareness about political or social issues. Some 24% of Twitter users say the platform is a very effective way of doing this, and another 54% find it somewhat effective. Roughly one-third of liberal Democrats (32%) and 18- to-29-year-olds who use Twitter (33%) see the platform as very effective at raising public awareness about political and social issues.

Twitter users are somewhat less confident about whether the platform is effective at getting elected officials – as opposed to the public at large – to pay attention to issues. Around two-thirds of users think it is at least somewhat effective at this, but just 10% think it is very effective A larger share of Twitter users who are Black say the platform is very effective at raising awareness among public officials (20%) relative to White (8%) or Hispanic (10%) users.

And an even smaller share of users say Twitter is effective at encouraging other people to actually change their minds about political or social issues. Some 22% of users think it is very ineffective at this, roughly double the share who think it is very effective (9%). As with raising awareness among public officials, Black users see Twitter as a relatively effective way of changing minds. A majority of Black users (64%) find it at least somewhat effective in this regard, compared with 40% of White users and 46% of Hispanics.
U.S. adults on Twitter follow accounts and encounter posts that contain a mix of political beliefs

When asked how many of the tweets they see contain political views or opinions they disagree with, a majority of Twitter users (57%) say they disagree with some of them. Around one quarter (28%) say they disagree with very few or none of them, while the remaining 14% disagree with almost all or most of the political views they see on the site.

Republican Twitter users are around twice as likely as Democrats to say they disagree with all or most of the political views they see on the site (19% vs. 10%). Conversely, Democrats are roughly twice as likely as Republicans to say they disagree with few or none of the political tweets they encounter (33% vs. 16%).When asked a similar question about the political leanings of the accounts they follow, the largest share of U.S. adults on Twitter say they follow mostly accounts with a mix of political beliefs (39%) or whose political beliefs they aren’t sure of (21%). By contrast, among those users who say they follow at least some politicians or government figures, a majority (58%) indicate that these figures tend to have political views that are similar to their own.1

As was true of the tweets they encounter, Democrats who use Twitter are more likely than Republicans to say the accounts they follow – whether accounts in general, or political and government figures specifically – have similar political beliefs to their own.
Roughly one-third of U.S. adult Twitter users see news articles about political or social issues almost every time they use the site

Twitter users say they see a variety of different types of political content there. Most prominently, 31% say they see news articles about political or social issues almost every time they use the site. And about half that share says they encounter political memes (16%) or humorous videos that reference political or social issues (15%) with similar frequency. And a majority of users say they see each of these types of content at least sometimes.


Rubén Weinsteiner

יום רביעי, 15 ביוני 2022

Around the world, inflation is high and getting higher


Rubén Weinsteiner


Two years ago, with millions of people out of work and central bankers and politicians striving to lift the U.S. economy out of a pandemic-induced recession, inflation seemed like an afterthought. A year later, with unemployment falling and the inflation rate rising, many of those same policymakers insisted that the price hikes were “transitory” – a consequence of snarled supply chains, labor shortages and other issues that would right themselves sooner rather than later.

Now, with the inflation rate higher than it’s been since the early 1980s, Biden administration officials acknowledge that they missed their call. According to the latest report from the Bureau of Labor Statistics, the annual inflation rate in May was 8.6%, its highest level since 1981, as measured by the consumer price index. Other inflation metrics also have shown significant increases over the past year or so, though not quite to the same extent as the CPI.
How we did this

Inflation in the United States was relatively low for so long that, for entire generations of Americans, rapid price hikes may have seemed like a relic of the distant past. Between the start of 1991 and the end of 2019, year-over-year inflation averaged about 2.3% a month, and exceeded 5.0% only four times. Today, Americans rate inflation as the nation’s top problem, and President Joe Biden has said addressing the problem is his top domestic priority.

But the U.S. is hardly the only place where people are experiencing inflationary whiplash. A MARCA POLITICA analysis of data from 44 advanced economies finds that, in nearly all of them, consumer prices have risen substantially since pre-pandemic times.

In 37 of these 44 nations, the average annual inflation rate in the first quarter of this year was at least twice what it was in the first quarter of 2020, as COVID-19 was beginning its deadly spread. In 16 countries, first-quarter inflation was more than four times the level of two years prior. (For this analysis, we used data from the Organization for Economic Cooperation and Development, a group of mostly highly developed, democratic countries. The data covers 37 of the 38 OECD member nations, plus seven other economically significant countries.)

Among the countries studied, Turkey had by far the highest inflation rate in the first quarter of 2022: an eye-opening 54.8%. Turkey has experienced high inflation for years, but it shot up in late 2021 as the government pursued unorthodox economic policies, such as cutting interest rates rather than raising them.

The country where inflation has grown fastest over the past two years is Israel. The annual inflation rate in Israel had been below 2.0% (and not infrequently negative) every quarter from the start of 2012 through mid-2021; in the first quarter of 2020, the rate was 0.13%. But after a relatively mild recession, Israel’s consumer price index began rising quickly: It averaged 3.36% in the first quarter of this year, more than 25 times the inflation rate in the same period in 2020.

Besides Israel, other countries with very large increases in inflation between 2020 and 2022 include Italy, which saw a nearly twentyfold increase in the first quarter of 2022 compared with two years earlier (from 0.29% to 5.67%); Switzerland, which went from ‑0.13% in the first quarter of 2020 to 2.06% in the same period of this year; and Greece, a country that knows something about economic turbulence. Following the Greek economy’s near-meltdown in the mid-2010s, the country experienced several years of low inflation – including more than one bout of deflation, the last starting during the first spring and summer of the pandemic. Since then, however, prices have rocketed upward: The annual inflation rate in Greece reached 7.44% in this year’s first quarter – nearly 21 times what it was two years earlier (0.36%).

Annual U.S. inflation in the first quarter of this year averaged just below 8.0% – the 13th-highest rate among the 44 countries examined. The first-quarter inflation rate in the U.S. was almost four times its level in 2020’s first quarter.

Regardless of the absolute level of inflation in each country, most show variations on the same basic pattern: relatively low levels before the COVID-19 pandemic struck in the first quarter of 2020; flat or falling rates for the rest of that year and into 2021, as many governments sharply curtailed most economic activity; and rising rates starting in mid- to late 2021, as the world struggled to get back to something approaching normal.

But there are exceptions to that general dip-and-surge pattern. In Russia, for instance, inflation rates rose steadily throughout the pandemic period before surging in the wake of its invasion of Ukraine. In Indonesia, inflation fell early in the pandemic and has remained at low levels. Japan has continued its years-long struggle with inflation rates that are too low. And in Saudi Arabia, the pattern was reversed: The inflation rate surged during the pandemic but then fell sharply in late 2021; it’s risen a bit since, but still is just 1.6%.

Inflation doesn’t appear to be done with the developed world just yet. An interim report from the OECD found that April’s inflation rate ran ahead of March’s figure in 32 of the group’s 38 member countries.

Rubén Weinsteiner

יום שני, 13 ביוני 2022

How the American middle class has changed in the past five decades


Rubén Weinsteiner


The middle class, once the economic stratum of a clear majority of American adults, has steadily contracted in the past five decades. The share of adults who live in middle-class households fell from 61% in 1971 to 50% in 2021, according to a new Pew Research Center analysis of government data.


The shrinking of the middle class has been accompanied by an increase in the share of adults in the upper-income tier – from 14% in 1971 to 21% in 2021 – as well as an increase in the share who are in the lower-income tier, from 25% to 29%. These changes have occurred gradually, as the share of adults in the middle class decreased in each decade from 1971 to 2011, but then held steady through 2021.

The analysis below presents seven facts about how the economic status of the U.S. middle class and that of America’s major demographic groups have changed since 1971. A related analysis examines the impact of the coronavirus pandemic on the financial well-being of households in the lower-, middle- and upper-income tiers, with comparisons to the Great Recession era. (In the source data for both analyses, demographic figures refer to the 1971-2021 period, while income figures refer to the 1970-2020 period. Thus, the shares of adults in an income tier are based on their household incomes in the previous year.)
How we did this
Who is middle income or middle class?

Household incomes have risen considerably since 1970, but those of middle-class households have not climbed nearly as much as those of upper-income households. The median income of middle-class households in 2020 was 50% greater than in 1970 ($90,131 vs. $59,934), as measured in 2020 dollars. These gains were realized slowly, but for the most part steadily, with the exception of the period from 2000 to 2010, the so-called “lost decade,” when incomes fell across the board.

The median income for lower-income households grew more slowly than that of middle-class households, increasing from $20,604 in 1970 to $29,963 in 2020, or 45%.

The rise in income from 1970 to 2020 was steepest for upper-income households. Their median income increased 69% during that timespan, from $130,008 to $219,572.

As a result of these changes, the gap in the incomes of upper-income and other households also increased. In 2020, the median income of upper-income households was 7.3 times that of lower-income households, up from 6.3 in 1970. The median income of upper-income households was 2.4 times that of middle-income households in 2020, up from 2.2 in 1970.

The share of aggregate U.S. household income held by the middle class has fallen steadily since 1970. The widening of the income gap and the shrinking of the middle class has led to a steady decrease in the share of U.S. aggregate income held by middle-class households. In 1970, adults in middle-income households accounted for 62% of aggregate income, a share that fell to 42% in 2020.

Meanwhile, the share of aggregate income accounted for by upper-income households has increased steadily, from 29% in 1970 to 50% in 2020. Part of this increase reflects the rising share of adults who are in the upper-income tier.

The share of U.S. aggregate income held by lower-income households edged down from 10% to 8% over these five decades, even though the proportion of adults living in lower-income households increased over this period.

Older Americans and Black adults made the greatest progress up the income ladder from 1971 to 2021. Among adults overall, the share who were in the upper-income tier increased from 14% in 1971 to 21% in 2021, or by 7 percentage points. Meanwhile, the share in the lower-income tier increased from 25% to 29%, or by 4 points. On balance, this represented a net gain of 3 percentage points in income status for all adults.

Those ages 65 and older made the most notable progress up the income ladder from 1971 to 2021. They increased their share in the upper-income tier while reducing their share in the lower-income tier, resulting in a net gain of 25 points. Progress among adults 65 and older was likely driven by an increase in labor force participation, rising educational levels and by the role of Social Security payments in reducing poverty.

Black adults, as well as married men and women, were also among the biggest gainers from 1971 to 2021, with net increases ranging from 12 to 14 percentage points.

On the other hand, not having at least a bachelor’s degree resulted in a notable degree of economic regression over this period. Adults with a high school diploma or less education, as well as those with some college experience but no degree, saw sizable increases in their shares in the lower-income tier in the past five decades. Although no single group of adults by education category moved up the income ladder from 1971 to 2021, adults overall realized gains by boosting their education levels. The share of adults 25 and older who had completed at least four years of college stood at 38% in 2021, compared with only 11% in 1971.

Progress up the income ladder for a demographic group does not necessarily signal its economic status in comparison with other groups at a given point in time. For example, in 2021, adults ages 65 and older and Black adults were still more likely than many other groups to be lower income, and less likely to be middle or upper income.

Married adults and those in multi-earner households made more progress up the income ladder from 1971 to 2021 than their immediate counterparts. Generally, partnered adults have better outcomes on a range of economic outcomes than the unpartnered. One reason is that marriage is increasingly linked to educational attainment, which bears fruit in terms of higher incomes.

Married men and women were distributed across the income tiers identically to each other in both 1971 and 2021. Both groups nearly doubled their shares in the upper-income tier in the past five decades, from 14% in 1971 to 27% in 2021. And neither group experienced an increase in the share in the lower-income tier.

Unmarried men and women were much more likely than their married counterparts to be in the lower-income tier in 2021. And unmarried men, in particular, experienced a sizable increase in their share in the lower-income tier from 1971 t0 2021 and a similarly large decrease in their share in the middle-income tier. Nonetheless, unmarried men are less likely than unmarried women to be lower income and more likely to be middle income.

Adults in households with more than one earner fare much better economically than adults in households with only one earner. In 2021, some 20% of adults in multi-earner households were in the lower-income tier, compared with 53% of adults in single-earner households. Also, adults in multi-earner households were more than twice as likely as adults in single-earner households to be in the upper-income tier in 2021. In the long haul, adults in single-earner households are among the groups who slid down the income ladder the most from 1971 to 2021.

Despite progress, Black and Hispanic adults trail behind other groups in their economic status. Although Black adults made some of the biggest strides up the income tiers from 1971 to 2021, they, along with Hispanic adults, are more likely to be in the lower-income tier than are White or Asian adults. About 40% of both Black and Hispanic adults were lower income in 2021, compared with 24% of White adults and 22% of Asian adults.

Black adults are the only major racial and ethnic group that did not experience a decrease in its middle-class share, which stood at 47% in 2021, about the same as in 1971. White adults are the only group in which more than half (52%) lived in middle-class households in 2021, albeit after declining from 63% in 1971. At the top end, only about one-in-ten Black and Hispanic adults were upper income in 2021, compared with one-in-four or more White and Asian adults.

The relative economic status of men and women has changed little from 1971 to 2021. Both experienced similar percentage point increases in the shares in the lower- and upper-income tiers, and both saw double-digit decreases in the shares who are middle class. Women remained more likely than men to live in lower-income households in 2021 (31% vs. 26%).

Adults 65 and older continue to lag economically, despite decades of progress. The share of adults ages 65 and older in the lower-income tier fell from 54% in 1971 to 37% in 2021. Their share in the middle class rose from 39% to 47% and their share in the upper-income tier increased from 7% to 16%. However, adults 65 and older are the only age group in which more than one-in-three adults are in lower-income households, and they are much less likely than adults ages 30 to 44 – as well as those ages 45 to 64 – to be in the upper-income tier.

All other age groups experienced an increase in the shares who are lower income from 1971 to 2021, as well as a decrease in the shares who are middle income. But they also saw increases in the shares who are upper income. Among adults ages 30 to 44, for instance, the share in upper-income households almost doubled, from 12% in 1971 to 21% in 2021.

There is a sizable and growing income gap between adults with a bachelor’s degree and those with lower levels of education. In 2021, about four-in-ten adults with at least a bachelor’s degree (39%) were in the upper-income tier, compared with 16% or less among those without a bachelor’s degree. The share of adults in the upper-income tier with at least a bachelor’s degree edged up from 1971 to 2021, while the share without a bachelor’s degree either edged down or held constant.

About half or a little more of adults with either some college education or a high school diploma only were in the middle class in 2021. But these two groups, along with those with less than a high school education, experienced notable drops in their middle class shares from 1971 to 2021 – and notable increases in the shares in the lower-income tier. In 2021, about four-in-ten adults with only a high school diploma or its equivalent (39%) were in the lower-income tier, about double the share in 1971.


Rubén Weinsteiner

יום ראשון, 12 ביוני 2022

By a wide margin, Americans view inflation as the top problem facing the country today


Rubén Weinsteiner


The public views inflation as the top problem facing the United States – and no other concern comes close.

Seven-in-ten Americans view inflation as a very big problem for the country, followed by the affordability of health care (55%) and violent crime (54%).

About half say gun violence and the federal budget deficit are very big problems (51% each), according to a MARCA POLITICA survey conducted April 25-May 1 among 5,074 U.S. adults. More than two years into the coronavirus pandemic, just 19% of Americans rate the coronavirus outbreak as a very big problem for the country, the lowest share out of 12 issues included in the survey. In June 2020, in the early stages of the outbreak, 58% rated it as a very big problem, placing it among the top concerns at the time.
How we did this

With few exceptions, Republicans and Democrats differ over what they see as major national problems. Inflation is by far the top concern among Republicans and Republican-leaning independents, 84% of whom say it is a very big problem in the country today.

A much narrower majority of Democrats and Democratic leaners (57%) view inflation as a very big problem. Among Democrats, larger shares see gun violence (70%), the affordability of health care (65%) and climate change (63%) as very big problems.

Democrats are nearly four times as likely as Republicans to rate climate change as a very big problem (63% vs. 16%). Republicans, by contrast, are far more likely than Democrats to view illegal immigration as a very big problem (65% vs. 19%).

Neither Republicans nor Democrats widely view the quality of public schools as a major problem. Four-in-ten Republicans (41%) and a similar share of Democrats (36%) say this is a very big problem for the country.

While the coronavirus has receded as a major problem over the past two years, so too has unemployment. In the new survey, just 23% of Americans rate unemployment as a very big problem, down from 41% a year ago and 50% in June 2020. The decline has come among members of both parties.

The share of adults who say racism is a very big problem for the country has declined by 10 percentage points since last April, from 45% to 35%. Most of the change has come among Democrats: 49% now view racism as a major problem, down from 67% about a year ago. Republicans’ views are largely unchanged (14% today, 19% then).