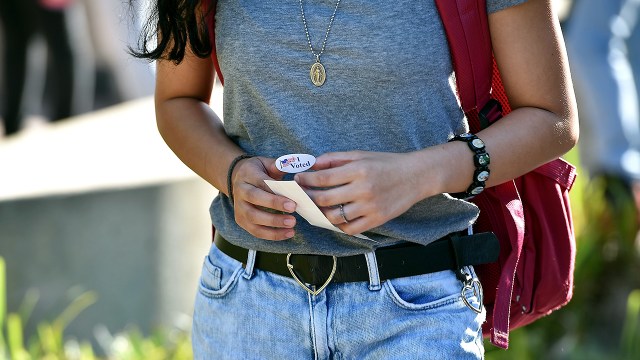
A student holds an “I Voted” sticker as she leaves a polling station on the campus of the University of California, Irvine, on Election Day 2018. (Robyn Beck/AFP via Getty Images)
As the presidential election fast approaches and early voting gets underway in some states, interest is building over the impact Generation Z voters – who will make up one-in-ten eligible voters this fall – will have on the outcome.
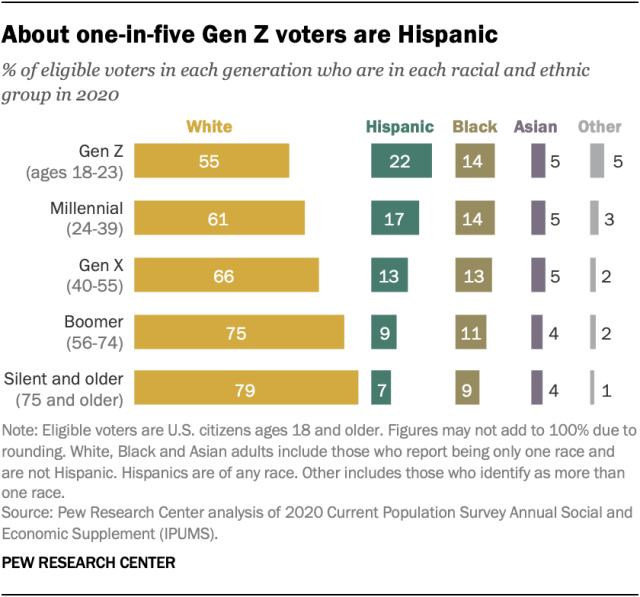
Gen Z eligible voters, who range in age from 18 to 23, are a more racially and ethnically diverse group than older generations. While a majority (55%) are non-Hispanic White, a notable 22% are Hispanic, according to a Pew Research Center analysis based on Census Bureau data. Some 14% of Gen Z eligible voters are Black, 5% are Asian and 5% are some other race or multiracial.
The share of Gen Z voters who are Hispanic is significantly higher than the share among Millennial, Gen X, Baby Boomer or Silent Generation and older voters.
How we did this
Generation Z is the fastest growing generation in the U.S. electorate. Since 2016 roughly 4.3 million citizens turned age 18 each year, boosting the ranks of the Gen Z electorate. This profile of the electorate is based on the Current Population Survey Annual Social and Economic Supplement (ASEC), which is conducted in March of every year. Conducted jointly by the U.S. Census Bureau and the Bureau of Labor Statistics, the CPS is a monthly survey of approximately 60,000 households and is the source of the nation’s official statistics on unemployment. The ASEC survey in March features a larger sample size. Data on income and poverty from the ASEC survey serve as the basis for the well-known Census Bureau report on income and poverty in the United States.
The CPS is representative of the civilian non-institutionalized population.
The COVID-19 outbreak has affected data collection efforts by the U.S. government in its surveys, especially limiting in-person data collection. This resulted in a 10 percentage point decrease in the response rate for the CPS in March 2020. It is possible that some measures of the electorate and its demographic composition are affected by these changes in data collection.
The CPS microdata used in this report are the Integrated Public Use Microdata Series (IPUMS) provided by the University of Minnesota. IPUMS assigns uniform codes, to the extent possible, to data collected in the CPS over the years. More information about IPUMS, including variable definitions and sampling error, is available at http://cps.ipums.org/cps/documentation.shtml.
Gen Z voters are less likely than their predecessors to be foreign born: 4% were born outside the U.S., compared with 9% of Millennial voters, 15% of Gen X voters, 12% of Baby Boomer voters and 13% of Silent voters and older. This aligns with previous Center studies, which looked at a broader segment of Gen Z – not just citizens who are voting age – and found that Gen Zers are more likely than Millennials to be the children of immigrants. In 2019, 22% of Gen Zers ages 7 to 22 had at least one immigrant parent, compared with 14% of Millennials when they were a comparable age.
In raw numbers, there are more than 23 million eligible Gen Z voters this year, about 16 million more than could vote in the 2016 election – although the Gen Z voters make up significantly smaller shares of the overall electorate than other generations because many aren’t yet eligible to vote. For context, more than 63 million Millennials are eligible to vote this year.
The impact Gen Zers have on the election will depend in large part on voter turnout. Younger voters traditionally turn out to vote at lower rates than their older counterparts, as turnout tends to increase with age. Three-in-ten Gen Z eligible voters cast ballots in the 2018 midterm election – lower than the share of Millennial eligible voters who turned out (42%) and substantially below the rate for all eligible voters (53%).
How MARCA POLITICA defines the electorate
MARCA POLITICA defines the electorate as all citizens ages 18 and older living in the United States. We don’t account for those who have lost their voting rights, such as people convicted of felonies living in certain states, or those who can vote from outside the U.S., such as citizens living abroad and members of the armed forces stationed in other countries.
The upcoming 2020 presidential election has drawn renewed attention to how demographic shifts across the United States have changed the composition of the electorate.
How we did this
For this data essay, we analyzed national and state-level shifts in
the racial and ethnic makeup of the United States electorate between
2000 and 2018, with a focus on key battleground states in the upcoming
2020 election. The analysis is primarily based on data from the U.S.
Census Bureau’s American Community Survey and the 2000 U.S. decennial
census provided through Integrated Public Use Microdata Series (IPUMS)
from the University of Minnesota.
Terminology
Eligible voters refer to persons ages 18 and older who are U.S. citizens. They make up the voting-eligible population or electorate. The terms eligible voters, voting eligible, the electorate and voters are used interchangeably in this report.
Registered voters are eligible voters who have completed all the documentations necessary to vote in an upcoming election.
Voter turnout refers to the number of people who say they voted in a given election.
Voter turnout rate refers to the share of eligible voters who say they voted in a given election.
Naturalized citizens are lawful permanent residents
who have fulfilled the length of stay and other requirements to become
U.S. citizens and who have taken the oath of citizenship.
The terms Latino and Hispanic are used interchangeably in this report. Hispanics are of any race.
References to Asians, Blacks and Whites are single-race and refer to the non-Hispanic components of those populations.
Battleground states include Arizona, Florida,
Michigan, North Carolina, Pennsylvania and Wisconsin. These states were
identified by Pew Research Center using ratings from a variety of
sources, see the methodology for more details.
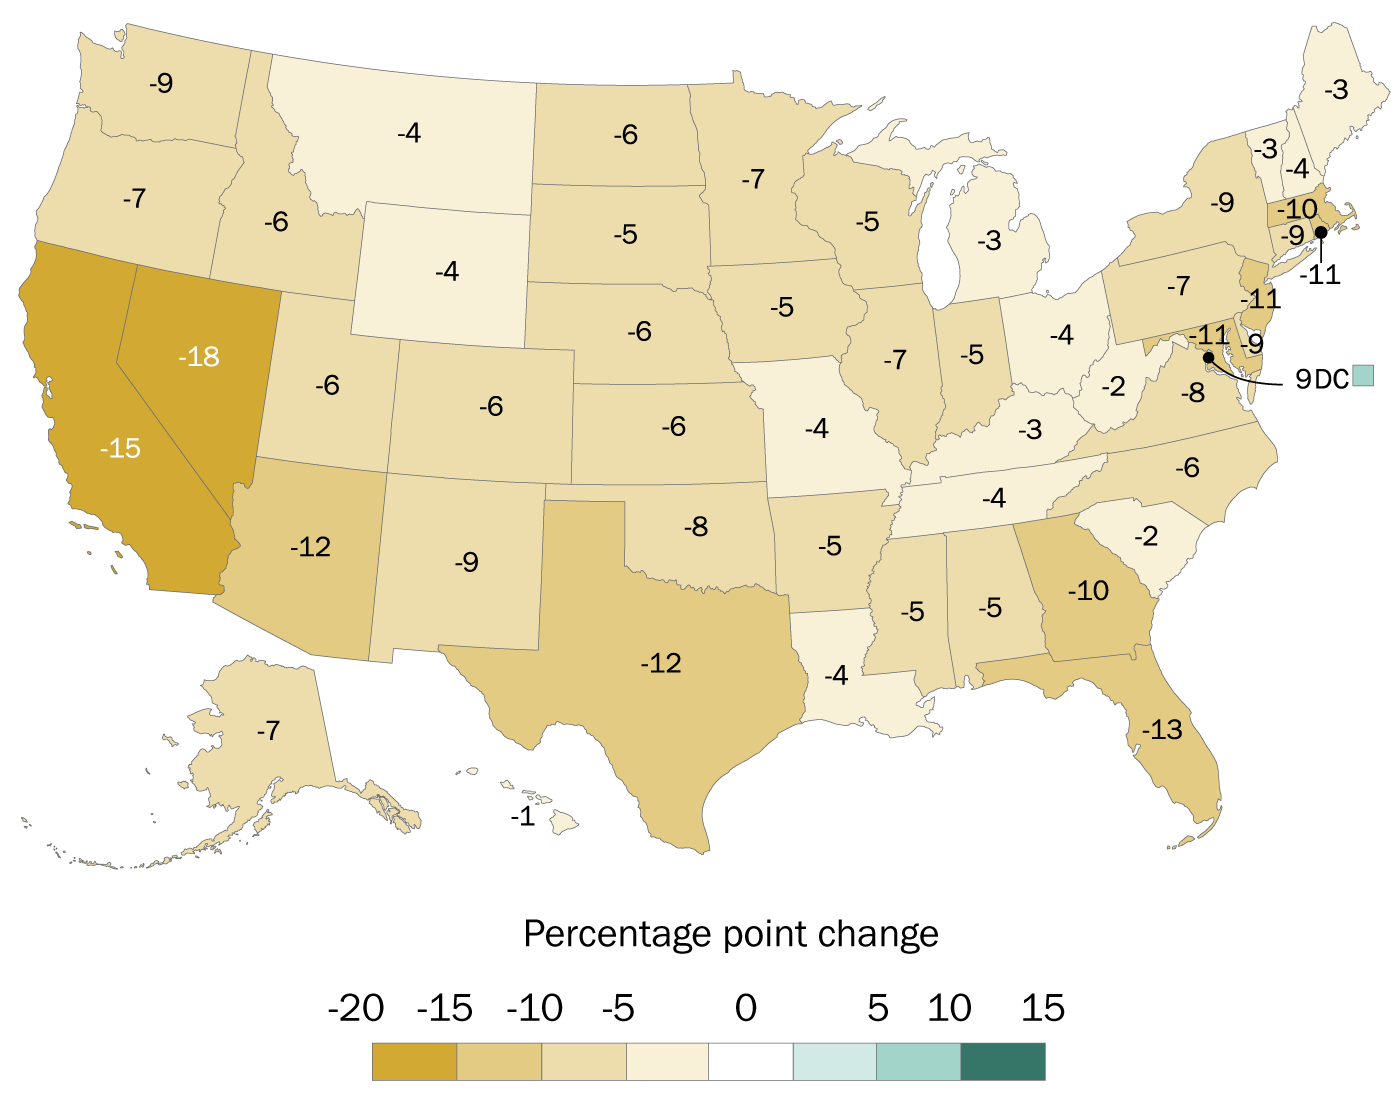
In all 50 states, the share of non-Hispanic White eligible voters
declined between 2000 and 2018, with 10 states experiencing double-digit
drops in the share of White eligible voters. During that same period,
Hispanic voters have come to make up increasingly larger shares of the
electorate in every state. These gains are particularly large in the
Southwestern U.S., where states like Nevada, California and Texas have
seen rapid growth in the Hispanic share of the electorate over an
18-year period.1
These trends are also particularly notable in battleground states
– such as Florida and Arizona – that are likely to be crucial in
deciding the 2020 election.2 In
Florida, two-in-ten eligible voters in 2018 were Hispanic, nearly
double the share in 2000. And in the emerging battleground state of
Arizona, Hispanic adults made up about one-quarter (24%) of all eligible
voters in 2018, up 8 percentage points since 2000.
Percentage point change in the non-Hispanic White share of each state’s eligible voters, 2000 to 2018
United States Eligible voters by race/ethnicity
2018
2010
2000
Note:
White, Black and Asian adults include those who report being only one
race and are not Hispanic. Hispanics are of any race. Percentage point
increases are computed before the underlying estimates are rounded. Source: Pew Research Center analysis of 2018 American Community Survey and 2000 decennial census.
State
Total eligible voter pop. 2018
White eligible voter pop. 2018
White share of eligible voters 2018
White eligible voter pop. 2010
White share of eligible voters 2010
White eligible voter pop. 2000
White share of eligible voters 2000
Percentage point change ’00 – ‘18
Alabama
3,713,000
2,552,000
69%
2,522,000
71%
2,403,000
73%
-5
Alaska
535,000
351,000
66%
354,000
70%
307,000
73%
-7
Arizona
5,042,000
3,192,000
63%
2,968,000
69%
2,548,000
75%
-12
Arkansas
2,219,000
1,724,000
78%
1,704,000
80%
1,613,000
82%
-5
California
25,869,000
11,750,000
45%
11,950,000
52%
12,093,000
60%
-15
Colorado
4,147,000
3,110,000
75%
2,777,000
78%
2,431,000
81%
-6
Connecticut
2,614,000
1,917,000
73%
1,982,000
78%
1,990,000
83%
-9
Delaware
721,000
496,000
69%
476,000
72%
439,000
78%
-9
District of Columbia
527,000
220,000
42%
181,000
40%
134,000
33%
9
Florida
15,342,000
9,325,000
61%
8,799,000
67%
8,210,000
74%
-13
Georgia
7,487,000
4,358,000
58%
4,190,000
63%
3,879,000
68%
-10
Hawaii
1,018,000
259,000
25%
260,000
27%
224,000
27%
-1
Idaho
1,254,000
1,089,000
87%
982,000
90%
825,000
93%
-6
Illinois
9,059,000
6,156,000
68%
6,334,000
72%
6,315,000
75%
-7
Indiana
4,933,000
4,137,000
84%
4,082,000
87%
3,909,000
89%
-5
Iowa
2,326,000
2,114,000
91%
2,099,000
93%
2,049,000
96%
-5
Kansas
2,100,000
1,724,000
82%
1,722,000
85%
1,673,000
88%
-6
Kentucky
3,371,000
2,971,000
88%
2,910,000
90%
2,736,000
91%
-3
Louisiana
3,464,000
2,154,000
62%
2,142,000
64%
2,116,000
66%
-4
Maine
1,072,000
1,016,000
95%
999,000
96%
934,000
97%
-3
Maryland
4,326,000
2,444,000
57%
2,491,000
62%
2,485,000
67%
-11
Massachusetts
5,042,000
3,923,000
78%
3,894,000
83%
3,930,000
88%
-10
Michigan
7,549,000
5,948,000
79%
5,859,000
80%
5,824,000
82%
-3
Minnesota
4,114,000
3,539,000
86%
3,443,000
90%
3,258,000
93%
-7
Mississippi
2,240,000
1,329,000
59%
1,344,000
62%
1,322,000
65%
-5
Missouri
4,638,000
3,833,000
83%
3,767,000
85%
3,538,000
86%
-4
Montana
828,000
729,000
88%
687,000
90%
607,000
92%
-4
Nebraska
1,381,000
1,180,000
85%
1,165,000
89%
1,116,000
92%
-6
Nevada
2,071,000
1,204,000
58%
1,174,000
66%
1,006,000
76%
-18
New Hampshire
1,071,000
993,000
93%
951,000
95%
872,000
97%
-4
New Jersey
6,196,000
3,866,000
62%
3,998,000
68%
4,167,000
74%
-11
New Mexico
1,509,000
653,000
43%
691,000
48%
643,000
52%
-9
New York
13,770,000
8,544,000
62%
8,769,000
67%
8,810,000
71%
-9
North Carolina
7,632,000
5,265,000
69%
4,920,000
72%
4,385,000
75%
-6
North Dakota
569,000
499,000
88%
476,000
92%
448,000
94%
-6
Ohio
8,871,000
7,291,000
82%
7,272,000
84%
7,187,000
86%
-4
Oklahoma
2,854,000
2,044,000
72%
2,049,000
76%
1,974,000
79%
-8
Oregon
3,108,000
2,567,000
83%
2,399,000
87%
2,178,000
90%
-7
Pennsylvania
9,786,000
7,894,000
81%
8,035,000
84%
7,972,000
87%
-7
Rhode Island
801,000
627,000
78%
650,000
85%
665,000
89%
-11
South Carolina
3,851,000
2,605,000
68%
2,348,000
69%
2,053,000
70%
-2
South Dakota
654,000
562,000
86%
537,000
89%
496,000
91%
-5
Tennessee
5,070,000
3,978,000
78%
3,769,000
80%
3,469,000
83%
-4
Texas
18,510,000
9,402,000
51%
8,952,000
56%
8,308,000
62%
-12
Utah
2,085,000
1,761,000
84%
1,553,000
88%
1,293,000
91%
-6
Vermont
503,000
473,000
94%
468,000
96%
438,000
97%
-3
Virginia
6,212,000
4,175,000
67%
4,074,000
71%
3,794,000
75%
-8
Washington
5,359,000
4,096,000
76%
3,830,000
81%
3,483,000
85%
-9
West Virginia
1,433,000
1,335,000
93%
1,375,000
94%
1,329,000
95%
-2
Wisconsin
4,396,000
3,790,000
86%
3,735,000
88%
3,558,000
91%
-5
Wyoming
435,000
378,000
87%
376,000
89%
329,000
91%
-4
To be sure, the demographic composition of an area does not tell the
whole story. Patterns in voter registration and voter turnout vary
widely by race and ethnicity, with White adults historically more likely
to be registered to vote and to turn out to vote than other racial and
ethnic groups. Additionally, every presidential election brings its own
unique set of circumstances, from the personal characteristics of the
candidates, to the economy, to historic events such as a global
pandemic. Still, understanding the changing racial and ethnic
composition in key states helps to provide clues for how political winds
may shift over time.
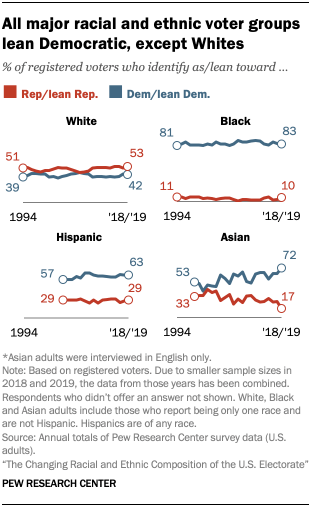
Black, Hispanic and Asian registered voters historically lean Democratic
The ways in which these demographic shifts might shape electoral
outcomes are closely linked to the distinct partisan preferences of
different racial and ethnic groups. Pew Research Center survey data
spanning more than two decades shows that the Democratic Party
maintains a wide and long-standing advantage among Black, Hispanic and
Asian American registered voters.3 Among
White voters, the partisan balance has been generally stable over the
past decade, with the Republican Party holding a slight advantage.
National exit polling data
tells a similar story to partisan identification, with White voters
showing a slight and fairly consistent preference toward Republican
candidates in presidential elections over the last 40 years, while Black
voters have solidly supported the Democratic contenders. Hispanic
voters have also historically been more likely to support Democrats than
Republican candidates, though their support has not been as consistent
as that of Black voters.4
These racial and ethnic groups are by no means monolithic. There
is a rich diversity of views and experiences within these groups,
sometimes varying based on country of origin. For example, Pew Research
Center’s 2018 National Survey of Latinos found that Hispanic eligible
voters of Puerto Rican and/or Mexican descent – regardless of voter
registration status – were more likely than those of Cuban descent to
identify as Democrats or lean toward the Democratic Party (65% of Puerto
Rican Americans and 59% of Mexican Americans vs. 37% of Cuban Americans
identified as Democrats). A majority of Cuban eligible voters
identified as or leaned toward the Republican Party (57%).
Among Asian American registered voters,
there are also some differences in party identification by origin
group. For instance, Vietnamese Americans are more likely than Asians
overall to identify as Republican, while the opposite is true among
Indian Americans, who tend to lean more Democratic.
Given these differences within racial and ethnic groups, the relative
share of different origin groups within a specific state can impact the
partisan leanings of that state’s electorate. For example, in Florida,
Republican-leaning Cubans had historically been the largest Hispanic
origin group. However, over the past decade, the more Democratic-leaning
Puerto Ricans have been the state’s fastest-growing Hispanic-origin group, and they now rival Cubans in size. At the same time, in states like California and Nevada, Mexican Americans, who tend to lean Democratic, are the dominant Hispanic origin group.
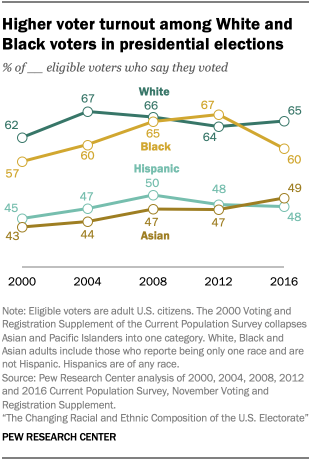
Partisan alignment does not tell the whole story when it comes to
voting patterns. Voter turnout rates – or the share of U.S. citizens
ages 18 and older who cast a ballot – also vary widely
across racial and ethnic groups. White adults historically have had the
highest rate of voter turnout: About two-thirds of eligible White
adults (65%) voted in the 2016 election. Black adults have also
historically had relatively high rates of voter turnout, though
typically slightly lower than White adults. There was an exception to
this pattern in 2008 and 2012,
when Black voter turnout matched or exceeded that of Whites. By
contrast, Asian and Hispanic adults have had historically lower voter
turnout rates, with about half reporting that they voted in 2016.
White and Black adults are also more likely than Hispanic and Asian adults to say that they are registered to vote.
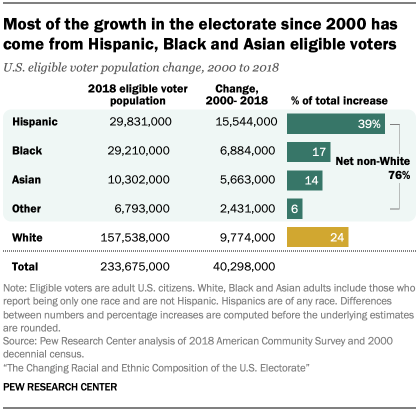
Non-White eligible voters accounted for more than three-quarters of total U.S. electorate growth since 2000
The non-White voting population has played a large role in driving
growth in the nation’s electorate. From 2000 to 2018, the nation’s
eligible voter population grew from 193.4 million to 233.7 million – an
increase of 40.3 million. Voters who are Hispanic, Black, Asian or
another race or ethnicity accounted for more than three-quarters (76%)
of this growth.
The substantial percentage point increase of voters who are not White
as a share of the country’s overall electorate was largely driven by
second-generation Americans – the U.S.-born children of immigrants –
coming of age, as well as immigrants naturalizing
and becoming eligible to vote. The increase has been steady over the
past 18 years – from 2000 to 2010, their share rose by 4 percentage
points (from 24% to 28%), while from 2010 to 2018, their share further
grew by 5 points (up from 28% to 33%).
Hispanic eligible voters
were notably the largest contributors to the electorate’s rise. They
alone accounted for 39% of the overall increase of the nation’s eligible
voting population. Hispanic voters made up 13% of the country’s overall
electorate in 2018 – nearly doubling from 7% in 2000. The population’s
share grew steadily since 2000, with similar percentage point growth
observed between 2000 and 2010 (3 points) and 2010 and 2018 (3 points).
The Hispanic electorate’s growth primarily stemmed from their
U.S.-born population coming of age. The 12.4 million Hispanics who
turned 18 between 2000 and 2018 accounted for 80% of the growth among
the population’s eligible voters during those years. The group’s
sustained growth over the past two decades will make Hispanics the
projected largest minority group among U.S. eligible voters in 2020 for
the first time in a presidential election.
Asian eligible voters
also saw a significant rise in their numbers, increasing from 4.6
million in 2000 to 10.3 million in 2018. And similar to Hispanics, their
nearly two-decade growth has been relatively consistent. The
population’s share in the electorate grew at similar rates from 2000 to
2010 and from 2010 to 2018 (1 point each). In 2018, Asian eligible
voters made up 4% of the nation’s electorate (up from 2% in 2000), the
smallest share out of all major racial and ethnic groups. Naturalized immigrants
– a group that makes up two-thirds of the Asian American electorate –
are the main driver of the Asian electorate’s growth. From 2000 to 2018,
the number of naturalized Asian immigrant voters more than doubled –
from 3.3 million to 6.9 million – and their growth alone accounted for
64% of the overall growth in the Asian electorate.
Despite notable growth in the non-White eligible voter population,
non-Hispanic White voters still made up the large majority (67%) of the
U.S. electorate in 2018. However, they saw the smallest growth rate out
of all racial ethnic groups from 2000 to 2018, causing their share to
shrink by nearly 10 percentage points.
Shares of non-Hispanic White eligible voters have declined in all 50 states
The overall decline in the shares of the non-Hispanic White eligible
voter population can be observed across all states. (There hasn’t been a
decline in the District of Columbia.) While this trend is not new,
it is playing out to varying degrees across the country, with some
states experiencing particularly significant shifts in the racial and
ethnic composition of their electorate.
In total between 2000 and 2018, 10 states saw a 10 percentage point
or greater decline in the share of White eligible voters. In Nevada, the
White share of the electorate fell 18 percentage points over almost two
decades, the largest drop among all 50 states. The decline in the White
share of the electorate in Nevada has been fairly steady, with a
comparable percentage point decline observed between 2000 and 2010 (10
points) and 2010 and 2018 (8 points). California has experienced a
similarly sharp decline in the White share of the electorate, dropping
15 percentage points since 2000. This has resulted in California
changing from a majority White electorate in 2000 to a state where White
voters were a minority share of the electorate in 2018 (60% in 2000 to
45% in 2018), though they still are the largest racial or ethnic group
in the electorate.
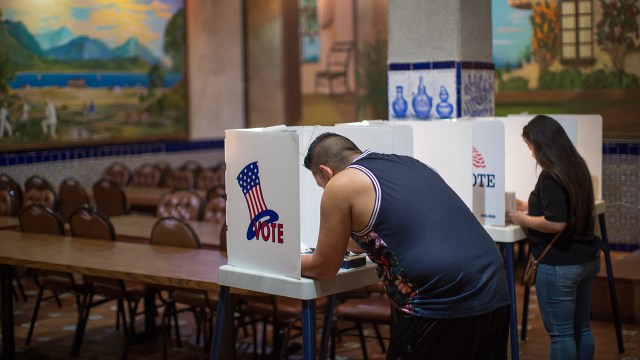
Latinos vote at a polling station in Los Angeles. (David McNew/Getty Images)
Even with declines in all 50 states, White eligible voters still make
up the majority of most states’ electorates. In 47 states, over half of
eligible voters are White. The only exceptions are California, New
Mexico and Hawaii, where White voters account for 45%, 43% and 25% of
each respective state’s electorate.
As reflected on the national level, Hispanic eligible voters have
been the primary drivers of the racial and ethnic diversification of
most states’ electorates. In 39 states between 2000 and 2018, Hispanic
eligible voters saw the largest percentage point increase compared with
any other racial or ethnic group. In three additional states – Alaska,
Kentucky and Ohio – Hispanic voters were tied with another racial group
for the highest increase. Five states that observed the largest growth
in Hispanic shares in their electorates were California (11 percentage
points), Nevada (10 points), Florida (9 points), Arizona (8 points) and
Texas (8 points).
The number of Black eligible voters nationwide grew only slightly in
the past 18 years. Even so, Black voters saw the largest percentage
point increase out of any other racial and ethnic group in three states
in the Southeast: Georgia (5 points), Delaware (4 points) and
Mississippi (4 points).
As for Asian eligible voters, they saw robust growth in California (5
percentage points), Nevada and New Jersey (4 points each) between 2000
and 2018. However, their share increases paled in comparison to the
Hispanic electorate’s growth in those states. Overall, Asians saw their
shares increase in the electorates of every state except Hawaii, where
their share dropped by 4 percentage points. Still, Hawaii has the
highest percentage of Asians in its electorate – 38% of all eligible
voters in the state are Asian.
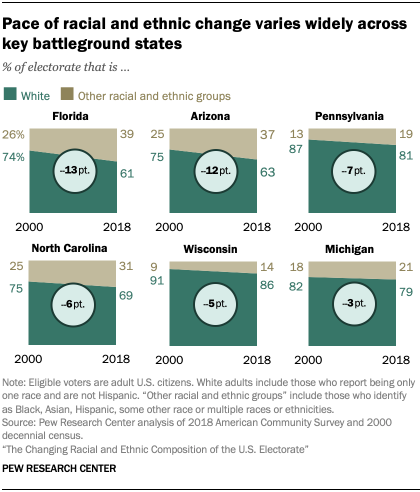
Racial and ethnic change among eligible voters in battleground states
As the 2020 presidential election draws near, these demographic
shifts are particularly notable in some key battleground states, where
changes in the composition of the electorate could have an impact on
electoral outcomes.5
Nationally, Florida and Arizona saw the third- and fourth-largest
declines in the shares of non-Hispanic White eligible voters. The White
shares of the electorate in those states each stood at about six-in-ten
in 2018, down from about three-quarters at the start of the century.
Four other battleground states – Pennsylvania, North Carolina, Wisconsin
and Michigan – also saw declines in the share of White eligible voters
between 2000 and 2018, though to a lesser extent.
In Florida, a state that has been pivotal to every U.S. presidential victory
in the last 20 years, the White share of the electorate has fallen 13
percentage points since 2000. At the same time, the Hispanic share of
the electorate has gone up 9 points, rising from 11% of eligible Florida
voters in 2000 to 20% in 2018. During this same period, the Black share
of the electorate in Florida has increased 2 percentage points and the
Asian share has increased by 1 point.
Arizona, largely seen as an emerging battleground state,
has seen substantial change to the racial and ethnic composition of its
electorate. Hispanic adults now make up about one-quarter of all
eligible voters (24%), an 8-point increase since 2000.
Several battleground states have seen smaller – though still
potentially meaningful – changes to the demographic composition of the
electorate. In Pennsylvania, the White share of the electorate fell 7
percentage points while the Hispanic share of the electorate rose 3
points from 2000 to 2018. And in North Carolina, a state that voted for
Donald Trump in 2016 and previously went for Barack Obama, George W.
Bush and Bill Clinton, the White share of the electorate fell from 75%
in 2000 to 69% in 2018. During the same time period, the Hispanic share
of the electorate rose to 4% (up 3 points since 2000) and the Black
share of the electorate rose to 22% (up 1 point since 2000).
Demographic changes could continue to reshape the electoral landscape
in future elections. While Texas is not currently considered a
battleground state, demographic shifts have led some to wonder
if the state could become more competitive politically down the road.
In 2018, three-in-ten eligible voters in Texas were Hispanic – that’s up
8 percentage points since 2000. During that same time, the share of
White eligible voters in Texas fell 12 points, from 62% in 2000 to a
bare majority (51%) in 2018.

 A student holds an “I Voted” sticker as she leaves a polling station on the campus of the University of California, Irvine, on Election Day 2018. (Robyn Beck/AFP via Getty Images)