
The media landscape was upended more than a decade ago when the video-sharing site YouTube was launched. The volume and variety of content posted on the site is staggering. The site’s popularity makes it a launchpad for performers, businesses and commentators on every conceivable subject. And like many platforms in the modern digital ecosystem, YouTube has in recent years become a flashpoint in ongoing debates over issues such as online harassment, misinformation and the impact of technology on children.
 Amid
this growing focus, and in an effort to continue demystifying the
content of this popular source of information, Pew Research Center used
its own custom mapping technique
to assemble a list of popular YouTube channels (those with at least
250,000 subscribers) that existed as of late 2018, then conducted a
large-scale analysis of the videos those channels produced in the first
week of 2019. The Center identified a total of 43,770 of these
high-subscriber channels using a process similar to the one used in our study of the YouTube recommendation algorithm. This data collection produced a variety of insights into the nature of content on the platform:
Amid
this growing focus, and in an effort to continue demystifying the
content of this popular source of information, Pew Research Center used
its own custom mapping technique
to assemble a list of popular YouTube channels (those with at least
250,000 subscribers) that existed as of late 2018, then conducted a
large-scale analysis of the videos those channels produced in the first
week of 2019. The Center identified a total of 43,770 of these
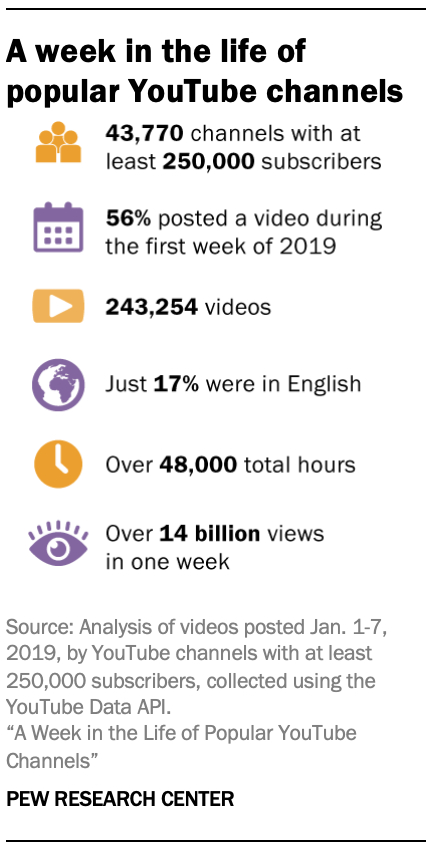
high-subscriber channels using a process similar to the one used in our study of the YouTube recommendation algorithm. This data collection produced a variety of insights into the nature of content on the platform: The YouTube ecosystem produces a vast quantity of content. These popular channels alone posted nearly a quarter-million videos in the first seven days of 2019, totaling 48,486 hours of content. To put this figure in context, a single person watching videos for eight hours a day (with no breaks or days off) would need more than 16 years to watch all the content posted by just the most popular channels on the platform during a single week. The average video posted by these channels during this time period was roughly 12 minutes long and received 58,358 views during its first week on the site.
Altogether, these videos were viewed over 14.2 billion times in their first seven days on the platform.1
 YouTube
is a global phenomenon, and its most popular channels posted a
substantial amount of content in languages other than English. Using a
combination of hand-labeling and machine learning, the Center
categorized videos based on whether or not they contained any text or
audio in a language other than English. The results of this analysis
illustrate the global nature of the YouTube platform. Just over half of
these channels (56%) posted a video during the first week of 2019, and
the majority of these active channels (72%) posted at least one video
that was partially or completely in a language other than English.
Overall, just 17% of the nearly quarter-million videos included in this
analysis were fully in English.
YouTube
is a global phenomenon, and its most popular channels posted a
substantial amount of content in languages other than English. Using a
combination of hand-labeling and machine learning, the Center
categorized videos based on whether or not they contained any text or
audio in a language other than English. The results of this analysis
illustrate the global nature of the YouTube platform. Just over half of
these channels (56%) posted a video during the first week of 2019, and
the majority of these active channels (72%) posted at least one video
that was partially or completely in a language other than English.
Overall, just 17% of the nearly quarter-million videos included in this
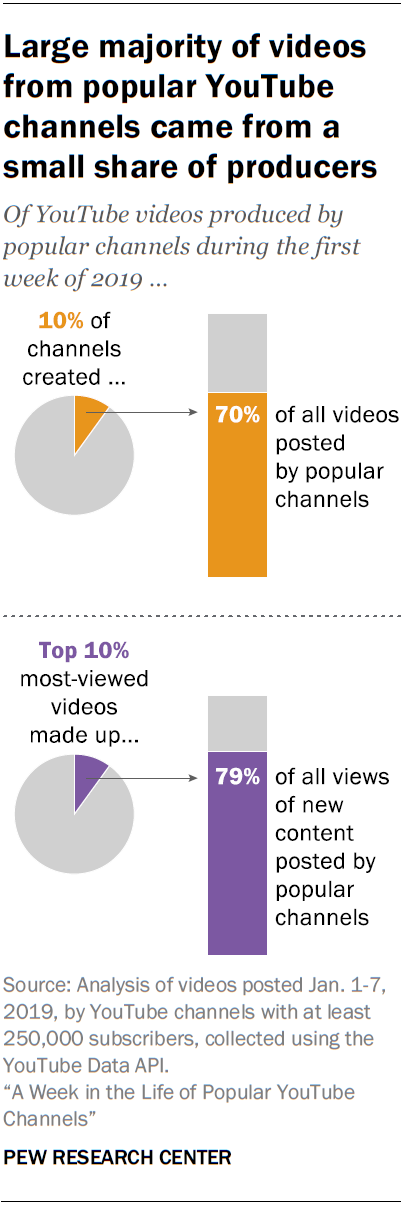
analysis were fully in English. A small share of highly active creators produced a majority of the content posted by these popular channels. As is the case with many online platforms (such as Twitter) a relatively small share of channels were responsible for a majority of the content posted during the study period. Just 10% of the popular channels identified in the Center’s mapping produced 70% of all the videos posted by these channels during the first week of 2019. Similarly, the 10% of popular-channel videos that had the most views in this period were responsible for 79% of all the views that went to new content posted by these channels.
The total number of high-subscriber channels increased dramatically in the second half of 2018. The Center’s mapping process identified 9,689 channels that crossed the 250,000-subscriber threshold between July 2018, when the Center last conducted an analysis of YouTube data, and December 2018, when the data was updated for this analysis. That represents a 32% increase in the total number of popular channels over that period. By the same token, the number of subscribers to existing popular channels that had already been identified as of July 2018 increased by an average of 27% over the same period.
In addition to this broader data collection, Pew Research Center also conducted a separate content analysis of the English-language videos posted by these popular channels over the first week of 2019 (in total, 37,079 videos met this description). The Center used human coders to identify the primary category or theme of each video (such as video games, consumer technology or current events and politics), and also examined the keywords used in video titles and descriptions to identify words that were widely used and associated with higher view counts relative to other videos. Some of the key findings from this analysis include:
Videos aimed at children were highly popular, as were those that featured children under the age of 13 – regardless of their intended audience. Only a small share of English-language videos posted by these popular channels during the study period were explicitly intended for children (based on a consensus of human coders). But those that were tended to be longer, received more views, and came from channels with a larger number of subscribers relative to general-audience videos. More broadly, videos featuring a child or children who appeared to be under the age of 13 – regardless of whether the video in question was aimed exclusively at children or not – received nearly three times as many views on average as other types of videos. And the very small subset of videos that were directly aimed at a young audience and also featured a child under the age of 13 were more popular than any other type of content identified in this analysis as measured by view counts.
It should be noted that YouTube explicitly states that the platform is not intended for children under the age of 13. YouTube provides a YouTube Kids platform with enhanced parental controls and curated video playlists, but the analysis in this report focuses on YouTube as a whole.
English-language videos related to current events or politics posted by these popular channels tended to have an international (rather than U.S.) focus. Videos explicitly related to current events or politics were relatively common, comprising 16% of all English-language videos uploaded during the study period. However, the majority of these videos were international in focus and did not mention events, issues or opinions related to the United States. While channels that posted one or more U.S. current events or politics videos were particularly active – posting an average of 63 total videos during the week – U.S. current events or politics videos comprised just 4% of all of the videos that were posted by popular channels overall.

Content involving video games was a fixture of popular channels on YouTube. Meanwhile, some 18% of English-language videos posted by popular channels during the study period related to video games or gaming. Content about video games was one of the most popular genres of content as measured by total views during the seven days of the study period, and these videos also tended to be much longer than other types of videos.
Certain video title keywords were associated with increased view counts. An analysis of the titles of English-language videos finds that certain keywords were associated with much higher view counts relative to other videos over the course of the study period. Some of these point to the platform’s orientation toward entertainment. For instance, videos mentioning words like “Fortnite,” “prank” or “worst” received more than five times as many views at the median as videos not mentioning those words. Others were more substantive in nature. For example, the use of the word “Trump” in video titles was associated with a significant increase in median views among videos about American current events or politics. Indeed, some 36% of videos about American current events or politics posted by these popular channels during the study period mentioned the words “president” or “Trump” in their titles.
Cross-promotion of videos with other social media channels was both widespread and associated with an increase in views. Seven-in-ten of these videos mentioned other prominent social media platforms such as Instagram or Twitter in their description (either in links or in the text itself), and those that did received more views than videos that did not link to other platforms.
The above findings are based on an analysis of YouTube channels with at least 250,000 subscribers and the videos they posted over the week of Jan. 1-7, 2019, building on the Center’s previous study of the YouTube recommendation algorithm. Using several recursive and randomized methods, we traversed millions of video recommendations made available through the YouTube API and identified as many unique channels as possible. As of January 2019, 1,525,690 total channels had been found, 43,770 of which had at least 250,000 subscribers. For the purposes of this study, these are defined as “popular channels.” Using this list of popular channels, researchers collected every video published on these channels during the first week of 2019 and tracked each of them for the seven days following their publication.
Popular YouTube channels produced a vast amount of content, much of it in languages other than English
YouTube is vast and constantly changing. In order to craft a manageable and meaningful research project, Pew Research Center limited the scope of data collection to only the most popular channels on the site. These popular channels alone produced a total of 243,254 videos during the first week of 2019, totaling 48,486 hours of content. The average video was 12 minutes long, although the length of videos posted during this period varied widely: Some 3% of the videos lasted longer than 60 minutes.
These findings also hint at the scale of how many hours people around the globe watch videos on the platform. Collectively, the videos produced by these popular channels were viewed over 14.2 billion times worldwide after one week on the site. Of course, these views were spread across a vast number of videos – each individual video received an average of 58,358 views in its first week, although 50% received fewer than 3,860 views. Conversely, a small fraction of these videos received substantial engagement: The 10% most-viewed videos were responsible for 79% of all the views that went to new content posted by popular channels during the week.
Videos generally received the most engagement during their first day on the platform, with engagement tapering off over the course of the week following their publication. Collectively, two-thirds (64%) of the total views that these videos received in their first week on the platform came on the day they were posted – as did 79% of their likes, 73% of their dislikes and 80% of their comments.
A majority of channels that posted a video in the first week of 2019 did so in a language other than English, and a small number of channels produced the majority of videos
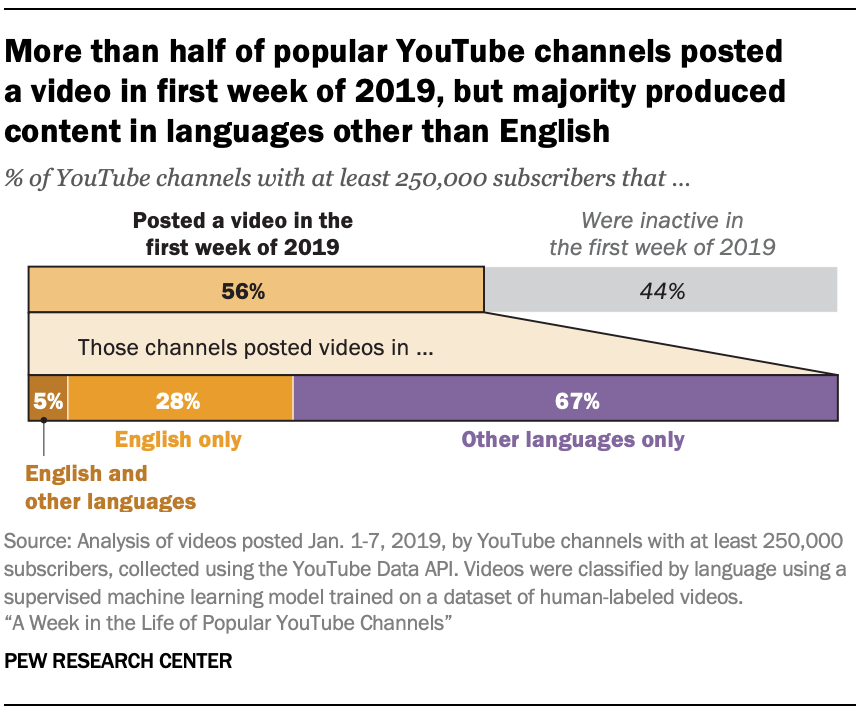
Just over half of the popular channels on YouTube posted at least one video on the platform during the first week of 2019, and a majority of them posted content that contained segments in a language other than English.2 Of the 43,770 popular channels that the Center identified as of December 2018, 56% posted a video in the first week of the new year. And within this subset of active channels, 28% posted videos exclusively in English. Meanwhile, 67% posted videos exclusively in languages other than English, and 5% posted videos in multiple languages including English.
“Active” channels (those that posted at least one video in the first week of 2019) ranged widely in the quantity of content they produced during the first week of 2019. Three-in-ten (31%) of these active popular channels posted exactly one video, while 55% posted more than one video but fewer than 10. Just 14% posted 10 or more videos during the study period, but this subset of channels was responsible for publishing 75% of all of the videos uploaded by popular channels during the week.
Channels that posted in both English and another language were especially likely to be part of this highly active group. Just 7% of English-only channels posted 10 or more videos, but that share increased to 16% among channels that posted exclusively in other languages, and to 36% among channels that posted videos in both English and other languages.
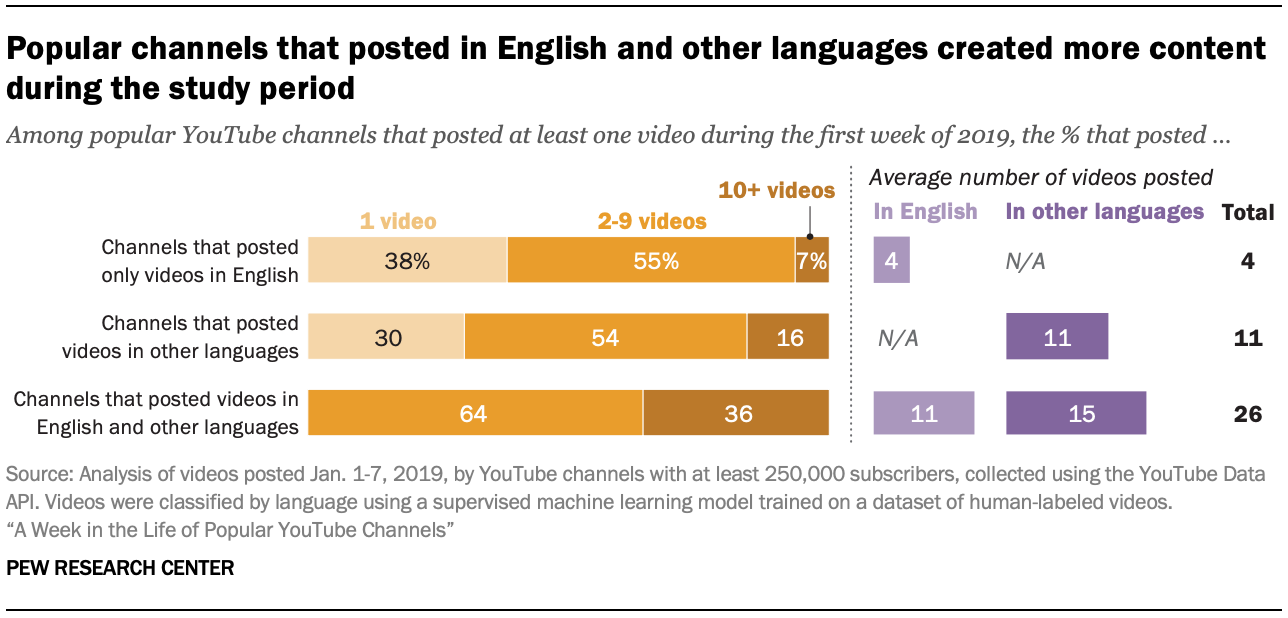
To some extent, high levels of activity among channels that posted in both English and other languages are to be expected, because these channels by definition had to post at least two videos (one in English and one in another language) in order to belong to this group. At the same time, channels that posted in English and other languages posted more non-English videos than did channels that posted exclusively in other languages (15 videos in other languages vs. 11, on average), and also posted more English-language videos (an average of 11) than did channels that posted exclusively in English (average of 4).
Across all three groups (channels that posted exclusively in English, those that posted exclusively in languages other than English, and those that posted a mix of English and other languages) the 10 individual channels that posted the largest number of videos during the week were dominated by those offering news and sports content. For lists of the 10 most-active channels in each of these groups, see Appendix A.
Fewer than one-in-five videos from popular YouTube channels were in English, but these videos received more views than videos in other languages
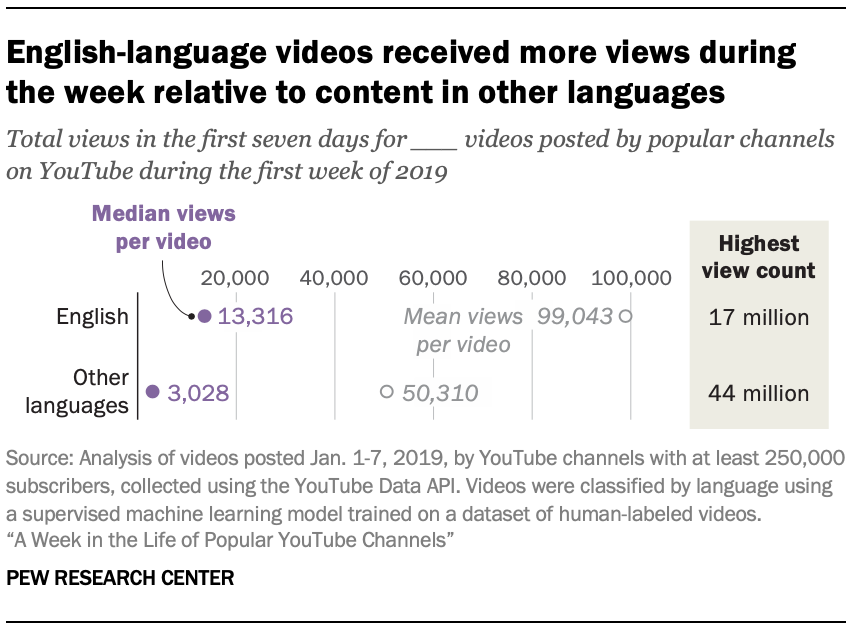
Thanks to these high levels of posting activity by non-English and multilingual channels, the majority of the individual videos posted by all popular channels were in a language other than English. This analysis finds that more than four out of every five videos uploaded to the site during the week contained content in a language other than English, while 17% of all the videos posted by popular channels during the week were in English. But despite being less common than videos in other languages, English-language videos tended to be more popular, generating a median of 13,316 views (99,043 on average) in their first week, compared with a median of just 3,028 (50,310 on average) for videos in other languages.
 Put
differently, English-language videos comprised just 17% of the videos
that were published by popular channels during the week, but they
received 28% of all of the views received by popular-channel videos
during their first week after being published. English-language videos
also received more likes (298 median vs. 42), dislikes (16 median vs. 5)
and comments (47 median vs. 6) and were longer than videos with content
in other languages (a median of 7 minutes vs. 4).
Put
differently, English-language videos comprised just 17% of the videos
that were published by popular channels during the week, but they
received 28% of all of the views received by popular-channel videos
during their first week after being published. English-language videos
also received more likes (298 median vs. 42), dislikes (16 median vs. 5)
and comments (47 median vs. 6) and were longer than videos with content
in other languages (a median of 7 minutes vs. 4).Children’s content, content featuring children and video games were among the most-viewed video genres
Along with examining the number of videos posted and languages used by these popular channels, this analysis also sought to gain a deeper understanding of the actual content of the videos these channels produce. However, there are limits to how much information can be gleaned from the categories and descriptions attached to YouTube videos themselves. The YouTube Data API provides topic tags for videos and channels, but these topics are often too general (“TV shows”) or too specific (“Music of Latin America”) to be useful for a broad analysis of video content. These topic tags have also not been validated for accuracy, and in some cases were not available: 8% of the videos and 3% of the channels included in this analysis did not have any topic tags assigned to them.
To address these limitations and more fully categorize the English-language content produced by popular YouTube channels, Pew Research Center commissioned human coders on Amazon’s Mechanical Turk crowdsourcing platform to watch these videos and categorize them into topical areas. After accounting for videos that had been removed or deleted at the time the coding took place, as well as videos that had been misclassified as being in English by our automatic language detection software, a total of 37,079 videos were included in this analysis.3
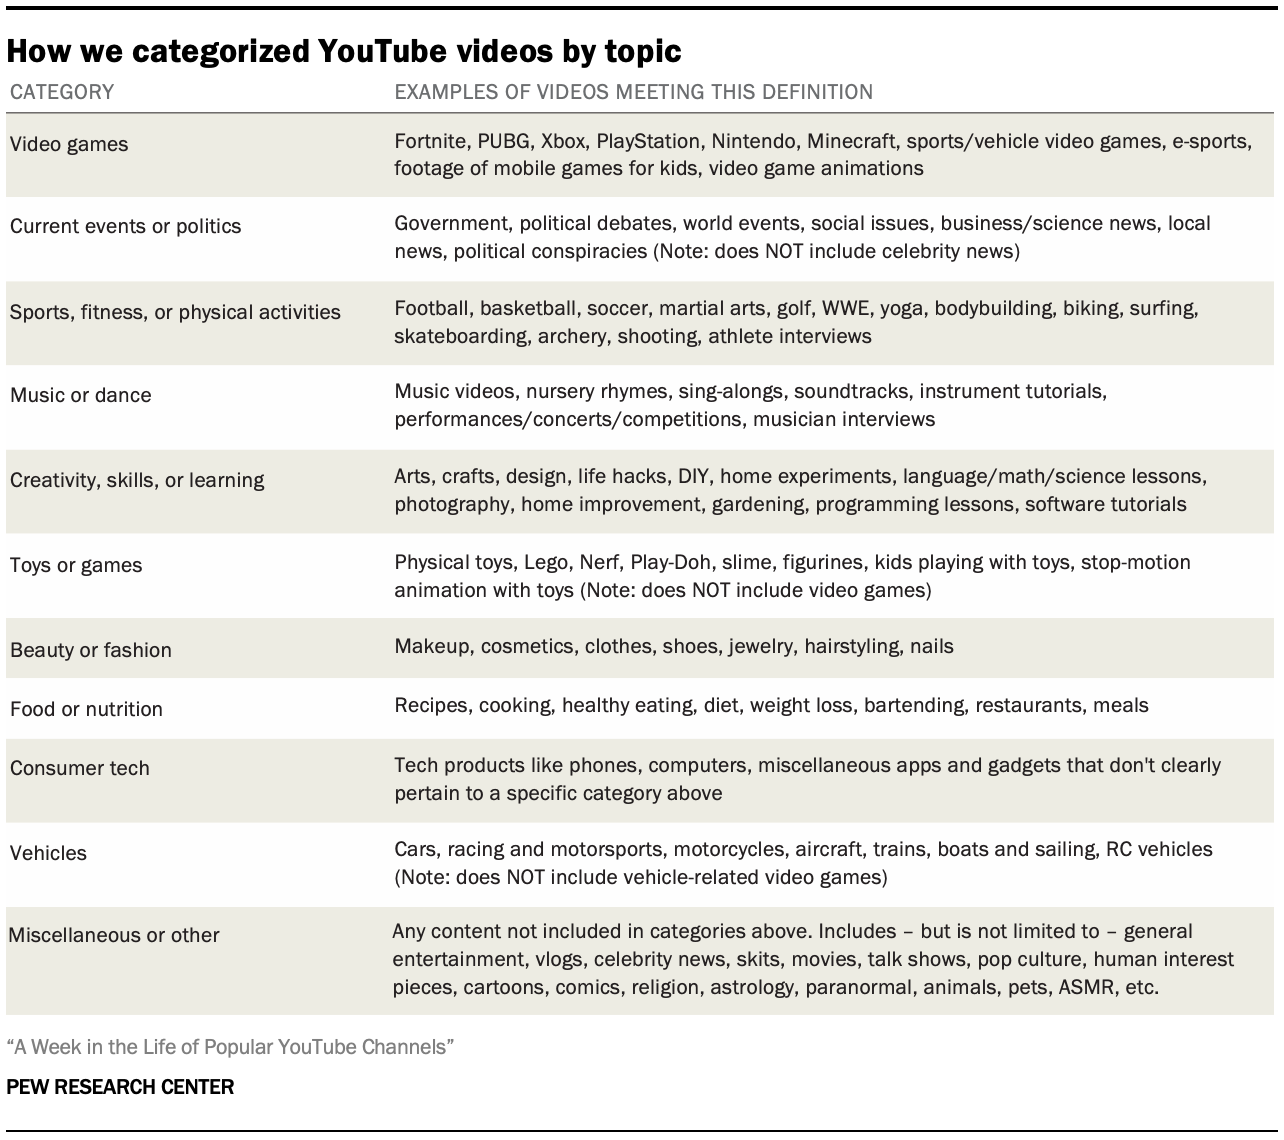
The human coders were instructed to classify videos into 11 broad categories. These categories, along with examples of the specific types of content that might be included in each, are highlighted in the table below:
Along with coding videos into these general topical categories, the Center also coded videos along three other metrics:
Videos with content about politics or current events were further subdivided based on whether the video mentioned issues pertaining to the United States.
Coders were instructed to identify content (regardless of topic) that appeared to be intended for an audience of children under the age of 13. In identifying videos with children as their primary audience, the coders were asked to identify videos that they believed were clearly and exclusively aimed at children. Videos that might appeal to children as well as teenagers or adults were intentionally excluded from this category.
Coders were also asked to identify content in which a child who appeared to be under the age of 13 participated in the video, regardless of whether the video was directly intended for children or young people.
Each video was coded by three different individuals to ensure there was adequate agreement on the content of the video. The coders’ responses were then reconciled using various thresholds designed to maximize agreement with Center researchers.4
Overall, one-third of the videos uploaded by popular channels during the week consisted of miscellaneous videos pertaining to general entertainment and other topics, such as vlogs (video blogs), celebrity news, movies, pop culture, pranks and pet videos. Of the more specific content categories, video games (accounting for 18% of the coded videos) were the most common. Videos related to international current events or politics (12% of coded videos), as well as those relating to sports or fitness (9%) and music/dance (9%), were also among the more common topics posted during the week. In terms of overall views, videos about video games, vehicles (1% of coded videos), food (2%), and toys or games (3%) were among the most-viewed categories on average. For a list of the most-viewed individual videos in each category during the week, see Appendix B.

Children’s videos tended to be longer and received more views than many other types of content; large share of these videos focused on toys or games
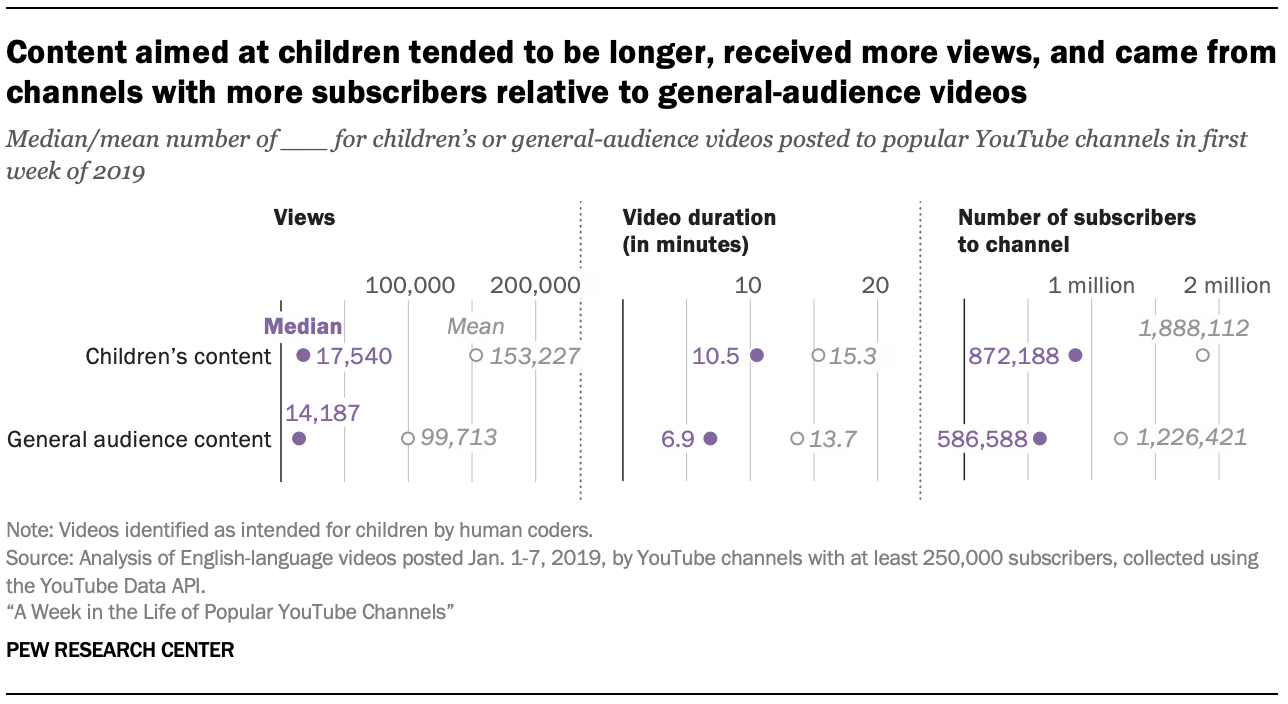
In total, just 4% of all English-language videos posted by popular YouTube channels in the first week of 2019 appeared to be aimed at children under the age of 13. But despite comprising a relatively small share of the total, children’s videos tended to be longer, received more views, and came from channels with a greater number of subscribers relative to content aimed at a general (teen or adult) audience. Videos that appeared to be intended for children averaged 153,227 views (median of 17,540), compared with an average of 99,713 views (14,187 median) for other videos. Channels that posted children’s videos also had many more subscribers: 1.9 million on average (872,188 median) vs. 1.2 million (586,588 median) among channels that did not post a video aimed at children during the week. And half of all children’s videos lasted at least 11 minutes, compared with a median of 7 for other videos.
As noted above, children’s content could belong to any of the other topical categories in this analysis, and children’s content related to toys or games (excluding video games) was both highly common and tended to receive many views. Some 28% of children’s videos were related to toys or games, and these videos received an average of 147,923 views (30,929 median), compared with 109,585 views (22,871 median) for toys or games videos aimed at a general audience.
Channels that produced videos about toys or games – especially those that appeared to target children – also had more subscribers than average. Channels that produced at least one video during this week about toys or games that was aimed at children had, on average, 2.1 million subscribers (median of 1.1 million), compared with 1.2 million (586,126 median) for channels that did not produce any videos meeting this description.
Videos featuring a child or children under the age of 13 were substantially more popular than other types of content during the study period
Beyond this specific subset of videos targeted to a young audience, the broader set of videos that included a child or children similarly stood out from other types of content. In total, the Center’s analysis estimates that just 2% of videos posted by popular channels during the first week of 2019 featured a child or children that appeared to be under the age of 13. However, this small subset of videos averaged three times as many views as did other types of videos: Videos that featured a young child received an average of 297,574 views (median 56,527) compared with an average of 97,081 views (median 13,794) for those that did not. Furthermore, channels that produced at least one video that featured a child averaged 1.8 million subscribers, compared with 1.2 million for those that did not (913,769 vs. 592,057 median).
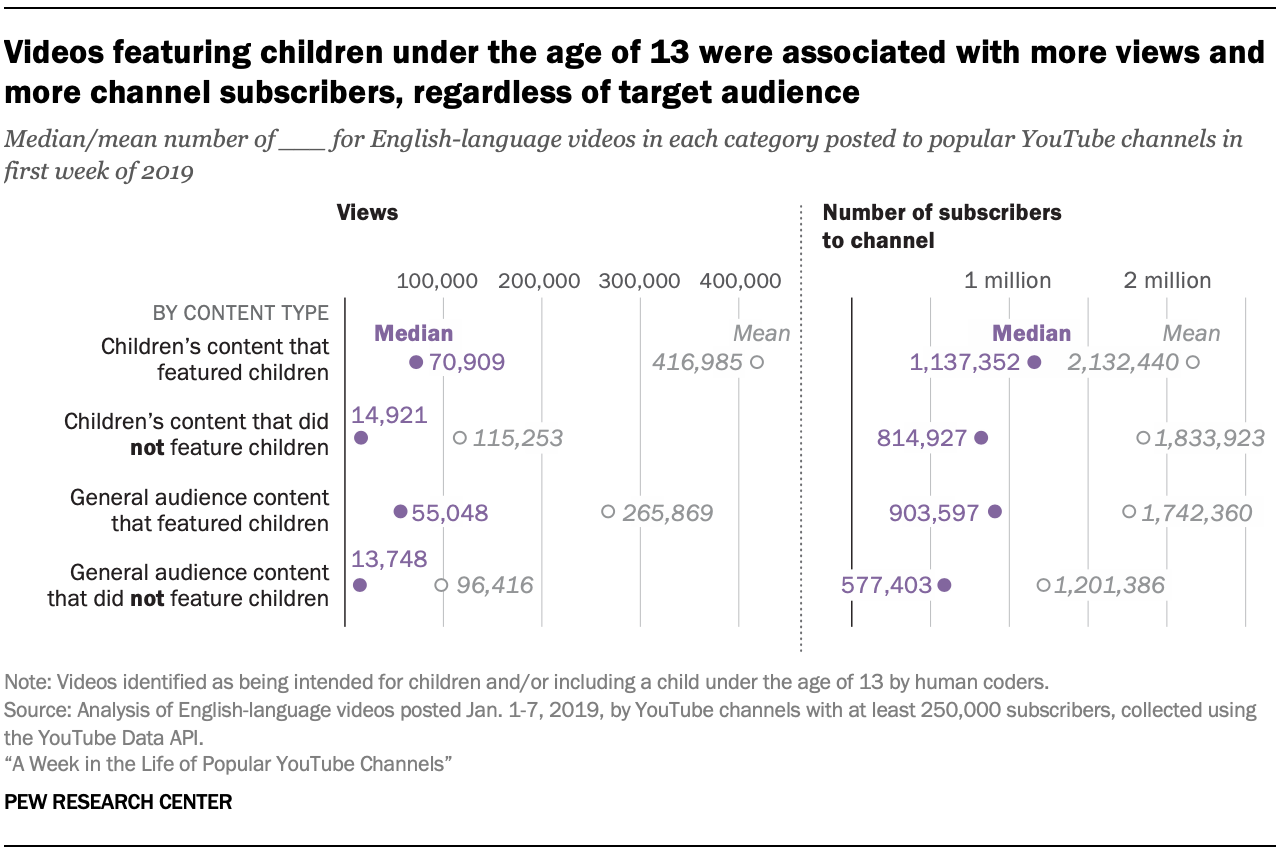
Notably, a large majority of the videos that featured children were not intended exclusively for a young audience. This analysis estimates that just 21% of videos featuring children were directed toward young children to the exclusion of other audiences. Similarly, only a minority of children’s videos (13% of those posted) contained footage of a child that appeared to be under the age of 13. But the small share of videos at the intersection of these two categories – that is, videos that were both aimed at children and featured a child under the age of 13 – were one of the single-most popular video categories captured in this analysis, averaging four times as many views (416,985 vs. 96,416) as general-audience videos that did not feature a child (70,909 vs. 13,748 median).
The majority of videos that included a child (79%) were oriented toward a general audience rather than children specifically. And while these videos were somewhat less popular than videos featuring a child that were aimed specifically to young viewers, they also received substantially more views than either children’s or general-audience content that did not feature children.
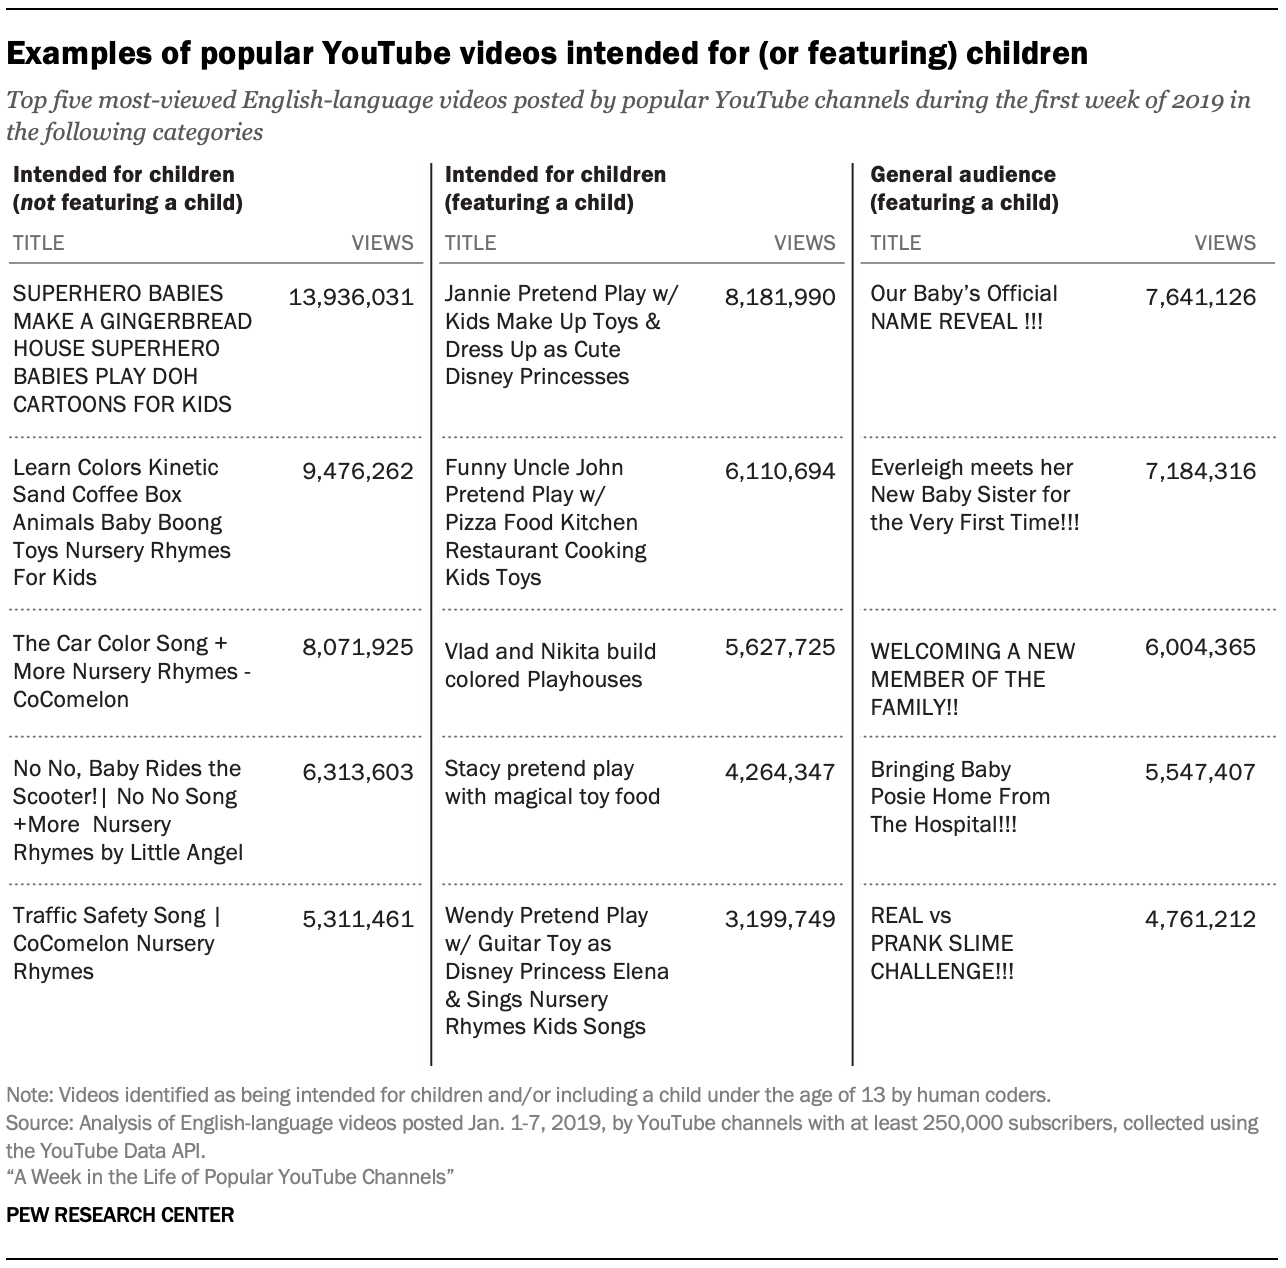
The five most-viewed individual videos intended for children that did not contain a child consisted largely of animated content, songs or nursery rhymes. As was true in the Center’s study of videos recommended by the YouTube recommendation engine, several of these videos had titles containing strings of seemingly random words that may be designed to appeal to the recommendation engine or the search terms that users typically use when looking for children’s content (e.g., “SUPERHERO BABIES MAKE A GINGERBREAD HOUSE SUPERHERO BABIES PLAY DOH CARTOONS FOR KIDS”).
Meanwhile, the five videos intended for a general audience and featuring a child that received the most views during the week of the study period were largely posted by parenting and family vlogs and included baby name reveals or new baby introduction videos. And the five most-viewed videos that were both intended for children and featured a child tended to involve children dressing up, singing or engaging in make-believe activities either alone or with adults.
Videos about video games among the most common, most-viewed and lengthiest videos posted by popular channels on YouTube during this period
Video games were a frequent and highly watched topic on popular YouTube channels during the week, comprising the most common (non-miscellaneous) topic on the platform in this study. Many of these videos consisted of people using social gaming platforms like Twitch and Discord to stream a webcast of themselves playing video games such as Fortnite and Minecraft while they talked with their online friends. Other videos consisted of trailers for upcoming video games, as well as compilations of “fails” and other exciting or amusing moments drawn from captured video game footage.
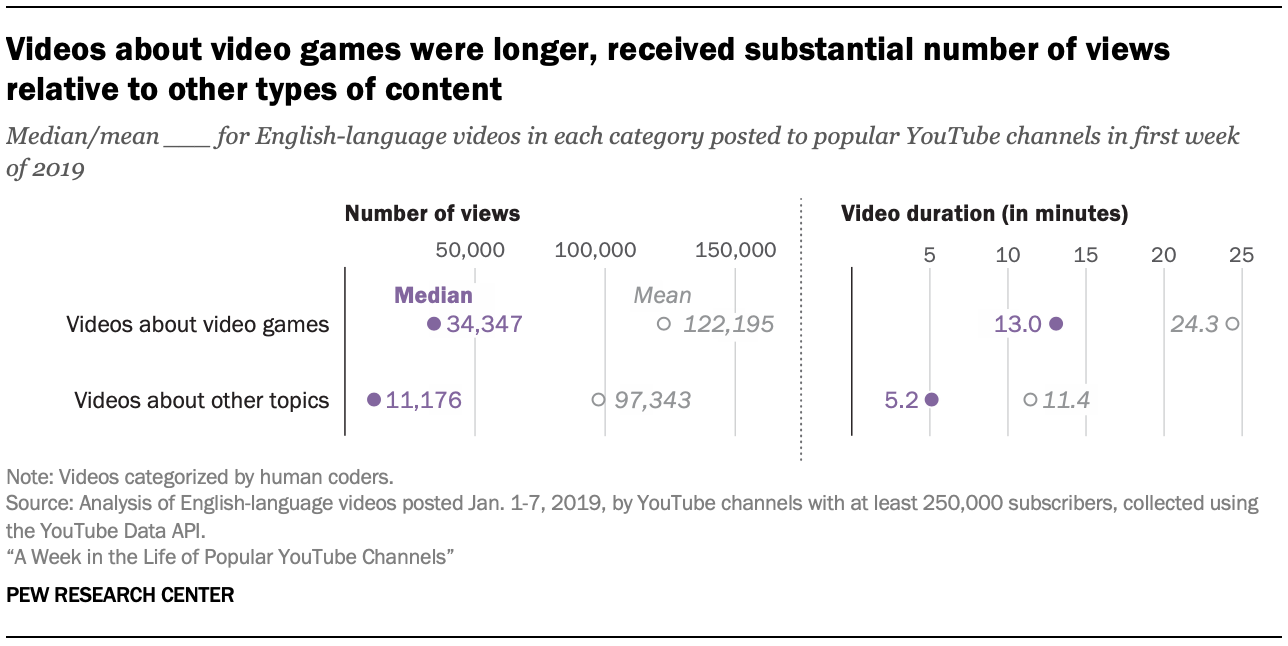
Nearly one-in-five (18%) videos uploaded by popular channels during the week pertained to video games, and these videos received an average of 122,195 views, compared with 97,343 for other types of videos. The median video game video – more representative of the typical video uploaded in the category – received nearly three times as many views as the median video for all other categories collectively (34,347 vs. 11,176). Gaming videos were also typically much longer than videos pertaining to other topics, averaging 24 minutes long (median of 13 minutes) compared with 11 minutes (median of 5 minutes) for non-gaming videos.
English-language videos relating to current events or politics tended to have an international focus, received fewer views than videos on other topics
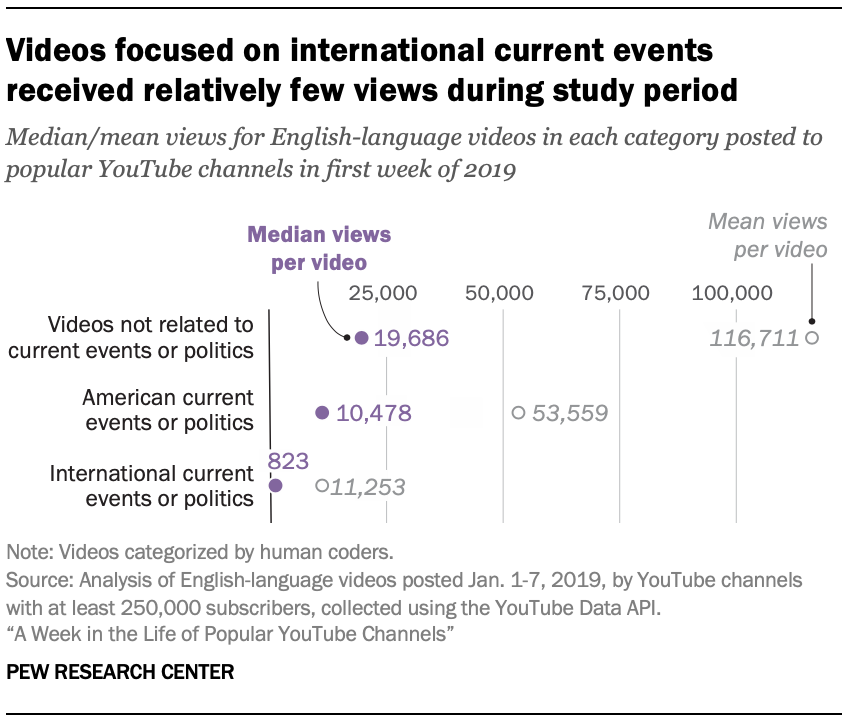
A recent study by the Center found that the share of YouTube users who get news there nearly doubled between 2013 (20%) and 2018 (38%). This new analysis finds that videos related to current events or politics were one of the most common categories posted by these popular channels. Such videos – which include any videos with a focus on a broad set of topical issues such as government, world events, social issues, politics and local news – comprised 16% of all English-language videos uploaded during the week.5 However, just 4% of English-language videos posted by these popular channels contained content related to American current events or politics. In other words, three-quarters (76%) of English-language videos posted by popular YouTube channels that related to current events or politics did not mention events, issues, or opinions related to the United States (in either a domestic or international context).
 Channels
that posted videos related to current events or politics during the
first week of 2019 tended to upload much more content than other
channels overall. Channels that posted one or more videos relating to
American current events or politics uploaded an average of 63 total
videos during the week (median of 36), while comparable channels with an
international focus uploaded an average of 43 videos (15 median). In
contrast, channels that did not post any content related to current
events or politics during the week uploaded an average of just four new
videos (2 median).
Channels
that posted videos related to current events or politics during the
first week of 2019 tended to upload much more content than other
channels overall. Channels that posted one or more videos relating to
American current events or politics uploaded an average of 63 total
videos during the week (median of 36), while comparable channels with an
international focus uploaded an average of 43 videos (15 median). In
contrast, channels that did not post any content related to current
events or politics during the week uploaded an average of just four new
videos (2 median). Although a large number of English-language videos related to current events or politics were posted by popular channels during the first week of 2019, these videos received on average only about one-fifth of the views that other types of videos received during that time. However, this is largely due to extremely low viewership numbers for English-language content with a focus on international events: Current events or politics videos with a U.S. focus posted by these channels received several times as many views as their international counterparts (mean of 53,559 with a U.S. focus vs. 11,253 international; medians of 10,478 and 823, respectively). Videos related to current events or politics also appeared to draw less interest over time and received fewer additional views after their initial day of publication than other types of videos, and this was especially true of videos with an international focus.
Certain keywords in video titles and descriptions were associated with more views
Many YouTube videos are uploaded with attention-grabbing titles – and also with detailed descriptions that contain information about the content of the video, the video creator, and external references to related materials such as news articles or other social media accounts. In addition to the human coding content analysis described in detail in Chapter 2, Pew Research Center also conducted an exploratory analysis of these text snippets to gain additional insight into the content of videos that were posted by popular channels in the first week of 2019.6
To focus on words that represented widespread and general topics, rather than names or terms specific to particular channels, researchers collected words that were mentioned in the titles of at least 100 different videos published by at least 10 different channels (353 words met this threshold).7 From this set of words, researchers identified those terms that were associated with much higher view counts by comparing the median number of views for videos that mentioned a particular word in their titles to the median for videos that didn’t mention the word.8 This analysis reveals that videos mentioning specific keywords like “Fortnite” and “ASMR” (Autonomous Sensory Meridian Response – a popular genre on YouTube) in their titles tended to receive more views than those that did not mention those words. Similar patterns also emerged in the topical subsets of videos identified in the Center’s coding process.
Videos received more views when they mentioned certain keywords in their title
Examining the 20 terms most strongly associated with greater view counts reveals a variety of patterns (for a full list of these 20 keywords, see Appendix C [link]). Some of these keywords appear to be related to particular topics that performed well during the week, including video games (“Fortnite,” “PUBG,” “FIFA,” “Roblox”), toys and children’s content (“slime,” “rainbow”), sports (“NFL,” “NBA”), and food (“eating”). Other keywords appear to represent popular video genres (“ASMR,” “moment,” “prank,” “hack,” “mystery”) and attempts to grab the attention of would-be viewers (“worst,” “ultimate,” “insane”).
 The
word “Fortnite” – referring to the popular online video game – was
associated with the largest increase in views out of all of the words
examined, and it was also by far the most common of the top 20
most-viewed words. Videos with “Fortnite” in their title comprised 15%
of all video game-related videos uploaded by popular channels during the
week.
The
word “Fortnite” – referring to the popular online video game – was
associated with the largest increase in views out of all of the words
examined, and it was also by far the most common of the top 20
most-viewed words. Videos with “Fortnite” in their title comprised 15%
of all video game-related videos uploaded by popular channels during the
week. Within topical categories, certain title keywords were associated with greater number of views
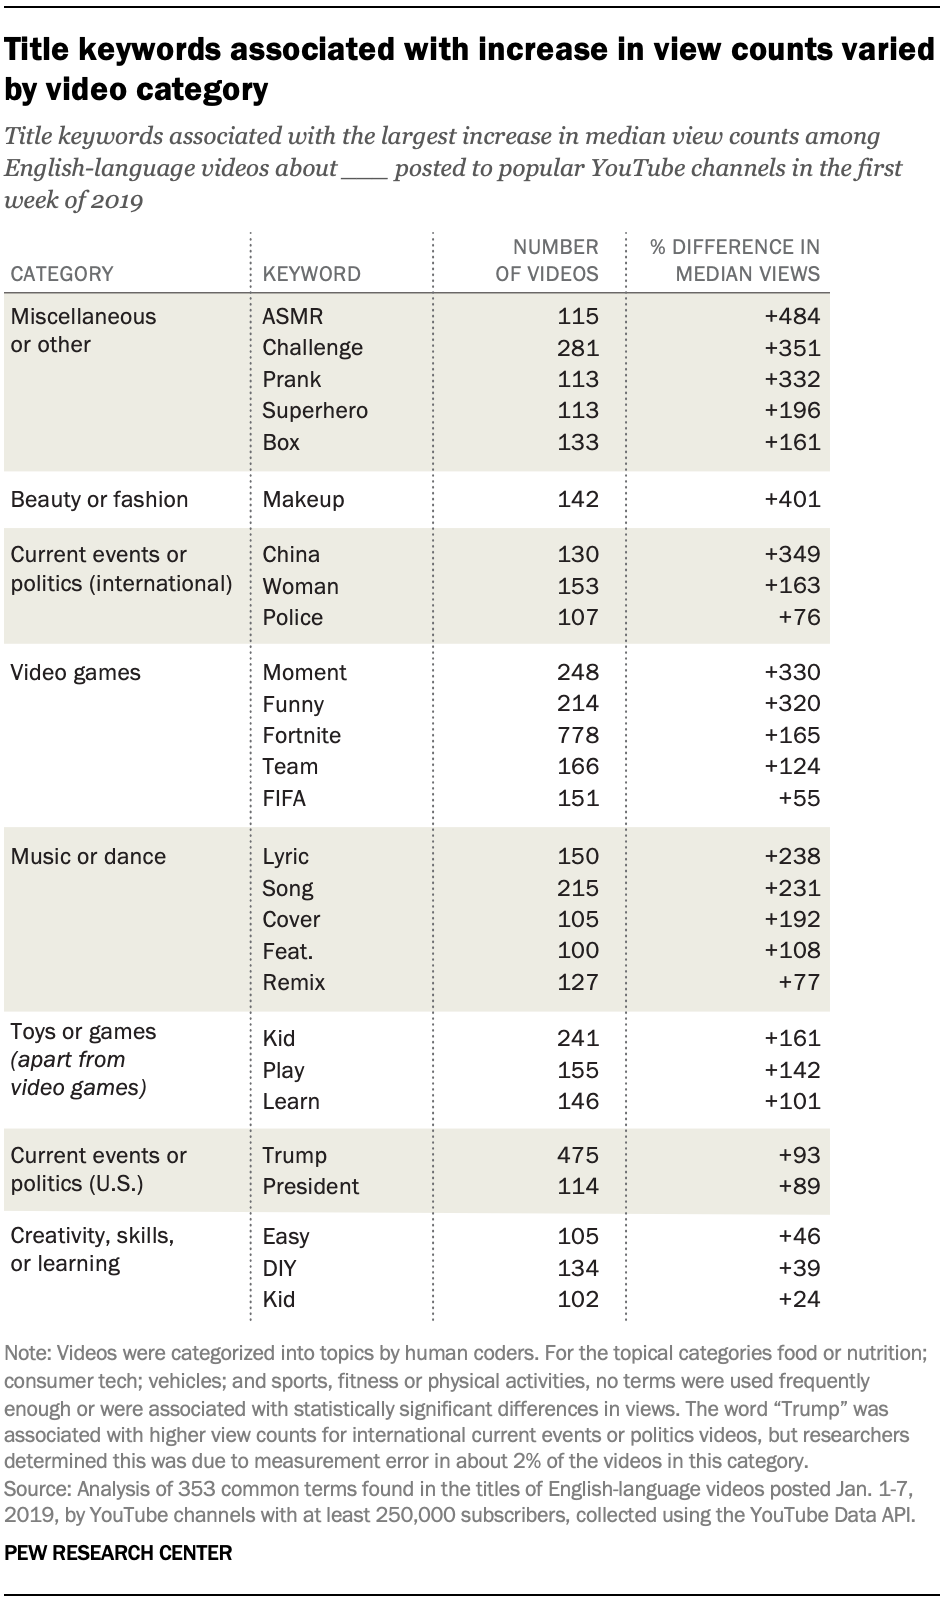
In addition to examining the top keywords associated with higher view counts overall, this analysis also highlights how certain keywords are linked with greater viewership within topical areas.
In some instances, these keywords appear to highlight specific subtopics that perform especially well but that do not have broader appeal outside of that topic. For example, beauty or fashion videos were not notably more popular than other video topics overall, but videos within this topic that mentioned the word “makeup” in their titles performed especially well compared with other videos in that topic.
In other cases, specific words appear among the top keywords for videos in multiple topical areas. The word “kid,” for example, is associated with greater viewership among videos pertaining to both toys or games, as well as creativity, skills or learning.
 Similarly,
the word “Trump” appears as a popular keyword for videos focused on
U.S. politics or current events. Within the subset of English-language
videos pertaining to U.S. current events or politics, just two of the
353 popular keywords examined were associated with significantly higher
view counts relative to videos in this category that did not use those
terms: “Trump” and “president.” Of the 1,405 English-language videos
related American current events or politics posted by these popular
channels during the first week of 2019, over a third (36%) mentioned one
of these two words in their title, and these videos received nearly
twice as many views at the median as did comparable videos posted during
the same time period that did not mention Trump.9
Similarly,
the word “Trump” appears as a popular keyword for videos focused on
U.S. politics or current events. Within the subset of English-language
videos pertaining to U.S. current events or politics, just two of the
353 popular keywords examined were associated with significantly higher
view counts relative to videos in this category that did not use those
terms: “Trump” and “president.” Of the 1,405 English-language videos
related American current events or politics posted by these popular
channels during the first week of 2019, over a third (36%) mentioned one
of these two words in their title, and these videos received nearly
twice as many views at the median as did comparable videos posted during
the same time period that did not mention Trump.9 Seven-in-ten videos cross-linked to other social media platforms
YouTube producers often include in their video descriptions not just information about the video itself, but also links to additional online content – including their social media accounts and personal websites. Across all English-language videos uploaded by popular channels during the first week of 2019, fully 70% mentioned another prominent social media platform in their description.10 The most commonly referenced social platforms were Twitter (58% of all videos), Facebook (51%) and Instagram (50%), followed by Snapchat (9%). Social gaming services Twitch and Discord were also mentioned in the descriptions of 8% and 6% of all videos, and 34% and 21% of all video game-related videos, respectively.
Mentioning other social media platforms appears to be associated with higher view counts overall: Videos that did this received an average of 111,912 views (19,962 median), compared with 78,757 (6,295 median) for videos that did not mention an external social media platform.
אין תגובות:
הוסף רשומת תגובה