

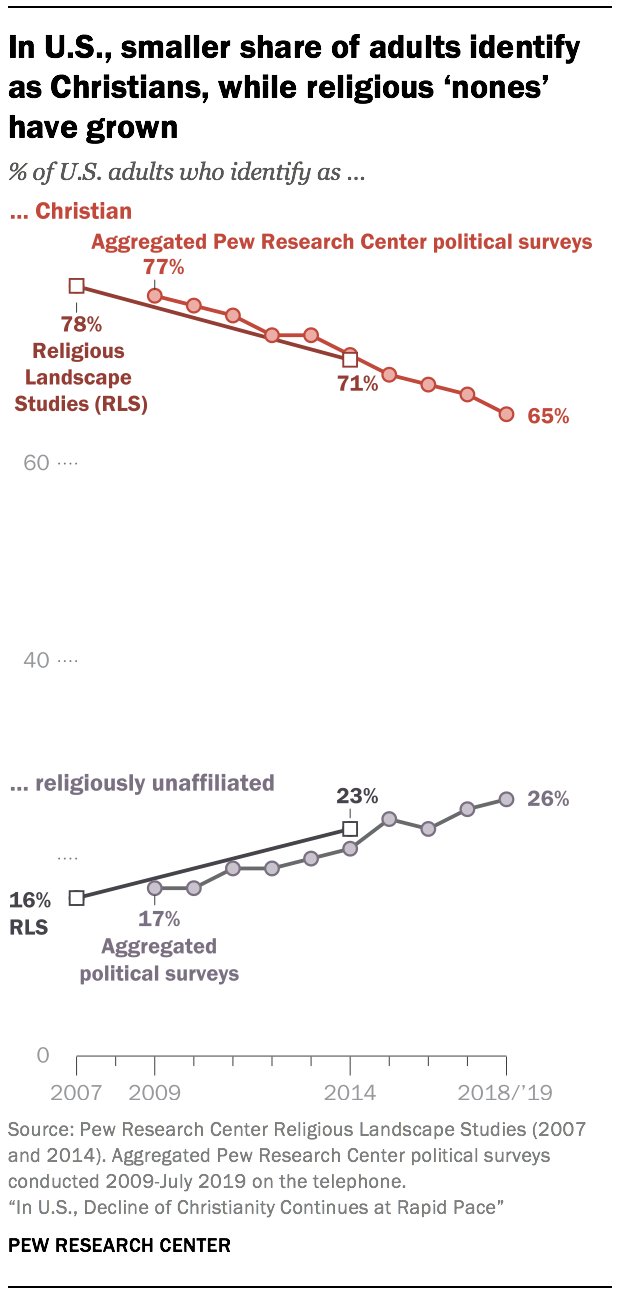
 The
religious landscape of the United States continues to change at a rapid
clip. In Pew Research Center telephone surveys conducted in 2018 and
2019, 65% of American adults describe themselves as Christians when
asked about their religion, down 12 percentage points over the past
decade. Meanwhile, the religiously unaffiliated share of the population,
consisting of people who describe their religious identity as atheist,
agnostic or “nothing in particular,” now stands at 26%, up from 17% in
2009.
The
religious landscape of the United States continues to change at a rapid
clip. In Pew Research Center telephone surveys conducted in 2018 and
2019, 65% of American adults describe themselves as Christians when
asked about their religion, down 12 percentage points over the past
decade. Meanwhile, the religiously unaffiliated share of the population,
consisting of people who describe their religious identity as atheist,
agnostic or “nothing in particular,” now stands at 26%, up from 17% in
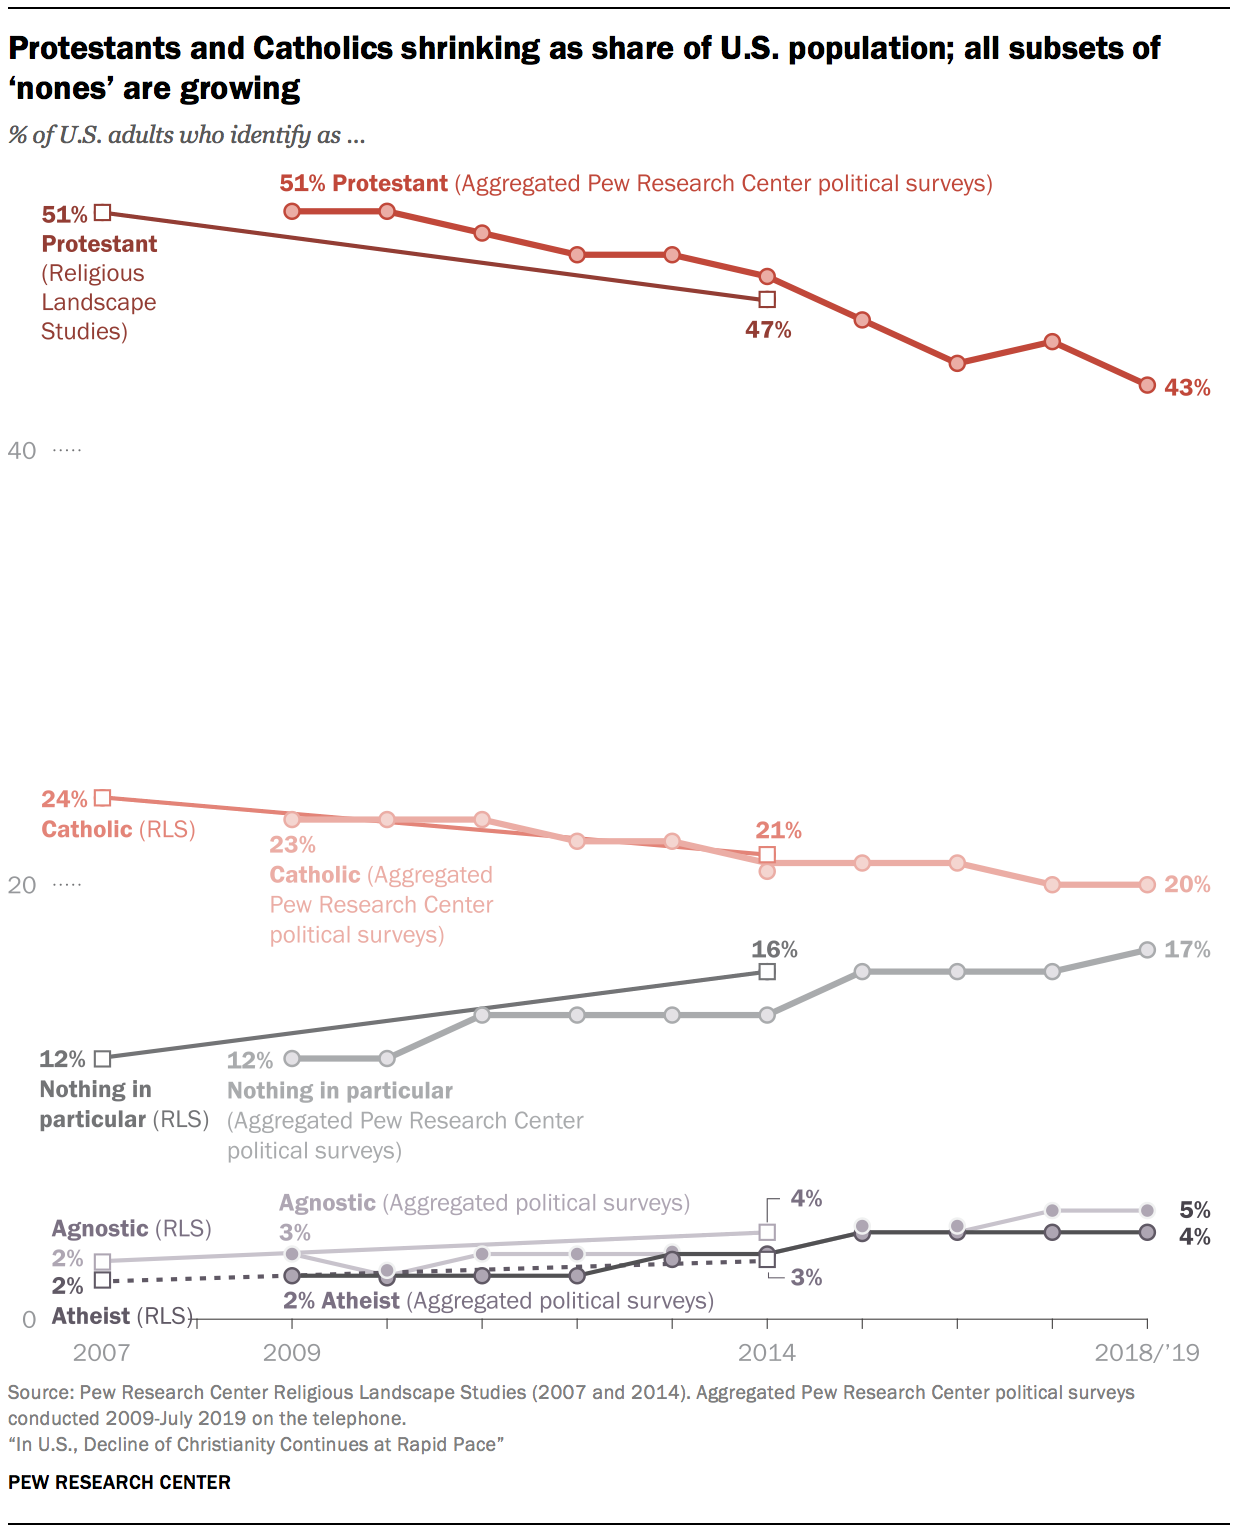
2009. Both Protestantism and Catholicism are experiencing losses of population share. Currently, 43% of U.S. adults identify with Protestantism, down from 51% in 2009. And one-in-five adults (20%) are Catholic, down from 23% in 2009. Meanwhile, all subsets of the religiously unaffiliated population – a group also known as religious “nones” – have seen their numbers swell. Self-described atheists now account for 4% of U.S. adults, up modestly but significantly from 2% in 2009; agnostics make up 5% of U.S. adults, up from 3% a decade ago; and 17% of Americans now describe their religion as “nothing in particular,” up from 12% in 2009. Members of non-Christian religions also have grown modestly as a share of the adult population.
These are among the key findings of a new analysis of trends in the religious composition and churchgoing habits of the American public, based on recent Pew Research Center random-digit-dial (RDD) political polling on the telephone.1 The data shows that the trend toward religious disaffiliation documented in the Center’s 2007 and 2014 Religious Landscape Studies, and before that in major national studies like the General Social Survey (GSS), has continued apace.
Pew Research Center’s 2007 and 2014 Religious Landscape Studies were huge national RDD surveys, each of which included interviews with more than 35,000 respondents who were asked dozens of detailed questions about their religious identities, beliefs and practices. The Center has not yet conducted a third such study, and when the Landscape Study is repeated, it is likely to use new methods that may prevent it from being directly comparable to the previous studies; growing challenges to conducting national surveys by telephone have led the Center to rely increasingly on self-administered surveys conducted online.2
But while no new Religious Landscape Study is available or in the immediate offing, the Center has collected five additional years of data (since the 2014 Landscape Study) from RDD political polls (see detailed tables). The samples from these political polls are not as large as the Landscape Studies (even when all of the political polls conducted in a year are combined), but together, 88 surveys from 2009 to 2019 included interviews with 168,890 Americans.
These surveys do not include nearly as many questions about religion as the Landscape Studies do. However, as part of the demographic battery of questions that ask respondents about their age, race, educational attainment and other background characteristics, each of these political polls also include one basic question about religious identity – “What is your present religion, if any? Are you Protestant, Roman Catholic, Mormon, Orthodox such as Greek or Russian Orthodox, Jewish, Muslim, Buddhist, Hindu, atheist, agnostic, something else, or nothing in particular?”
 Additionally,
most of these political polls include a question about religious
attendance – “Aside from weddings and funerals, how often do you attend
religious services? More than once a week, once a week, once or twice a
month, a few times a year, seldom, or never?” Taken together, these two
questions (one about religious identity, the other about religious
attendance) can help shed light on religious trends in the U.S.
Additionally,
most of these political polls include a question about religious
attendance – “Aside from weddings and funerals, how often do you attend
religious services? More than once a week, once a week, once or twice a
month, a few times a year, seldom, or never?” Taken together, these two
questions (one about religious identity, the other about religious
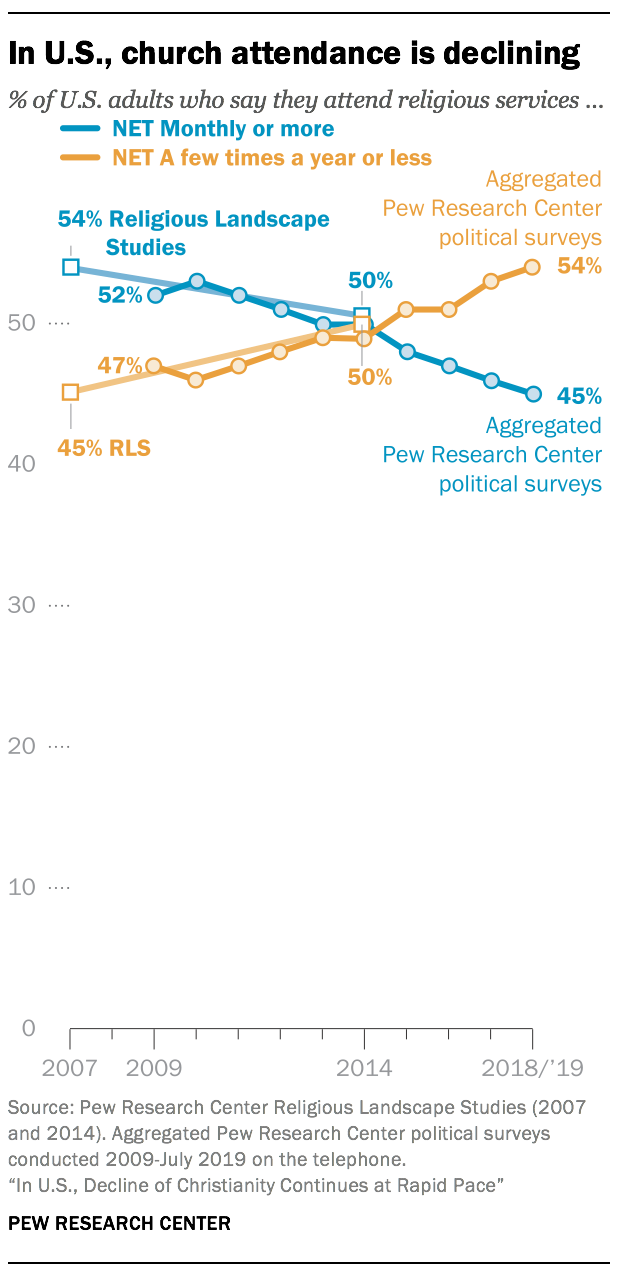
attendance) can help shed light on religious trends in the U.S. The data shows that just like rates of religious affiliation, rates of religious attendance are declining.3 Over the last decade, the share of Americans who say they attend religious services at least once or twice a month dropped by 7 percentage points, while the share who say they attend religious services less often (if at all) has risen by the same degree. In 2009, regular worship attenders (those who attend religious services at least once or twice a month) outnumbered those who attend services only occasionally or not at all by a 52%-to-47% margin. Today those figures are reversed; more Americans now say they attend religious services a few times a year or less (54%) than say they attend at least monthly (45%).
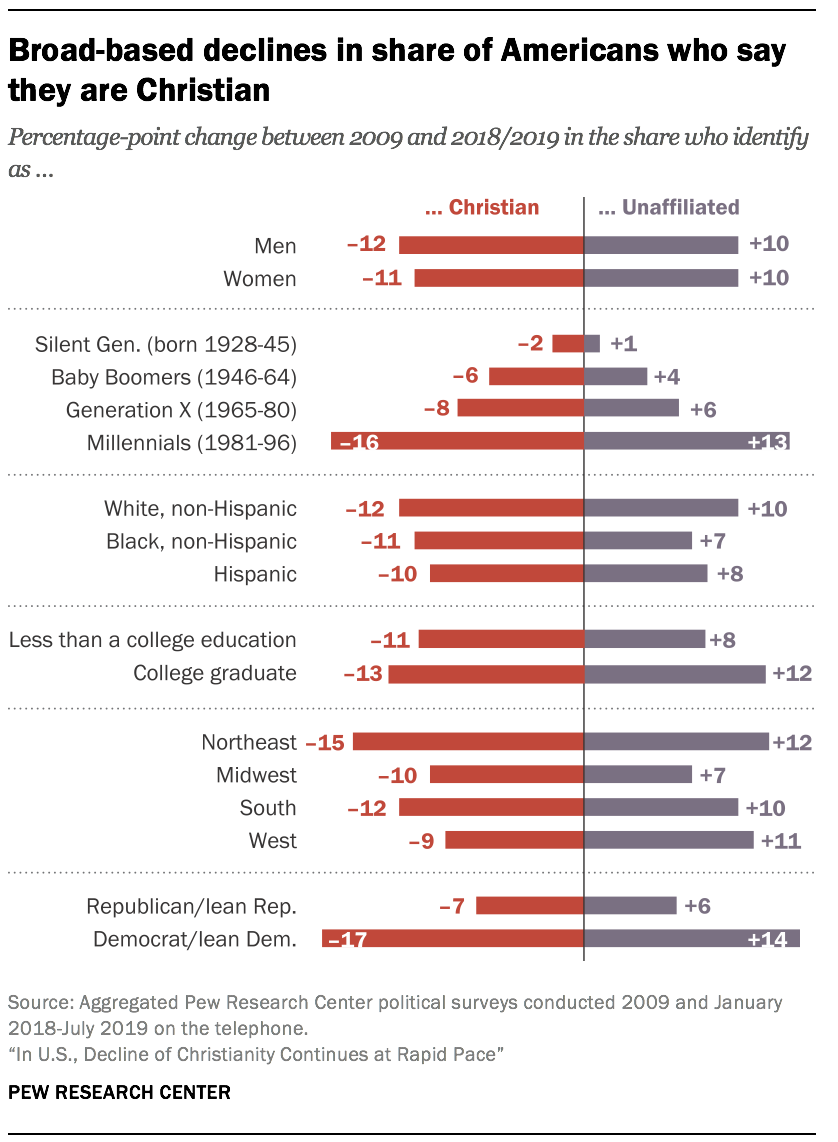 The
changes underway in the American religious landscape are broad-based.
The Christian share of the population is down and religious “nones” have
grown across multiple demographic groups: white people, black people
and Hispanics; men and women; in all regions of the country; and among
college graduates and those with lower levels of educational attainment.
Religious “nones” are growing faster among Democrats than Republicans,
though their ranks are swelling in both partisan coalitions. And
although the religiously unaffiliated are on the rise among younger
people and most groups of older adults, their growth is most pronounced
among young adults.
The
changes underway in the American religious landscape are broad-based.
The Christian share of the population is down and religious “nones” have
grown across multiple demographic groups: white people, black people
and Hispanics; men and women; in all regions of the country; and among
college graduates and those with lower levels of educational attainment.
Religious “nones” are growing faster among Democrats than Republicans,
though their ranks are swelling in both partisan coalitions. And
although the religiously unaffiliated are on the rise among younger
people and most groups of older adults, their growth is most pronounced
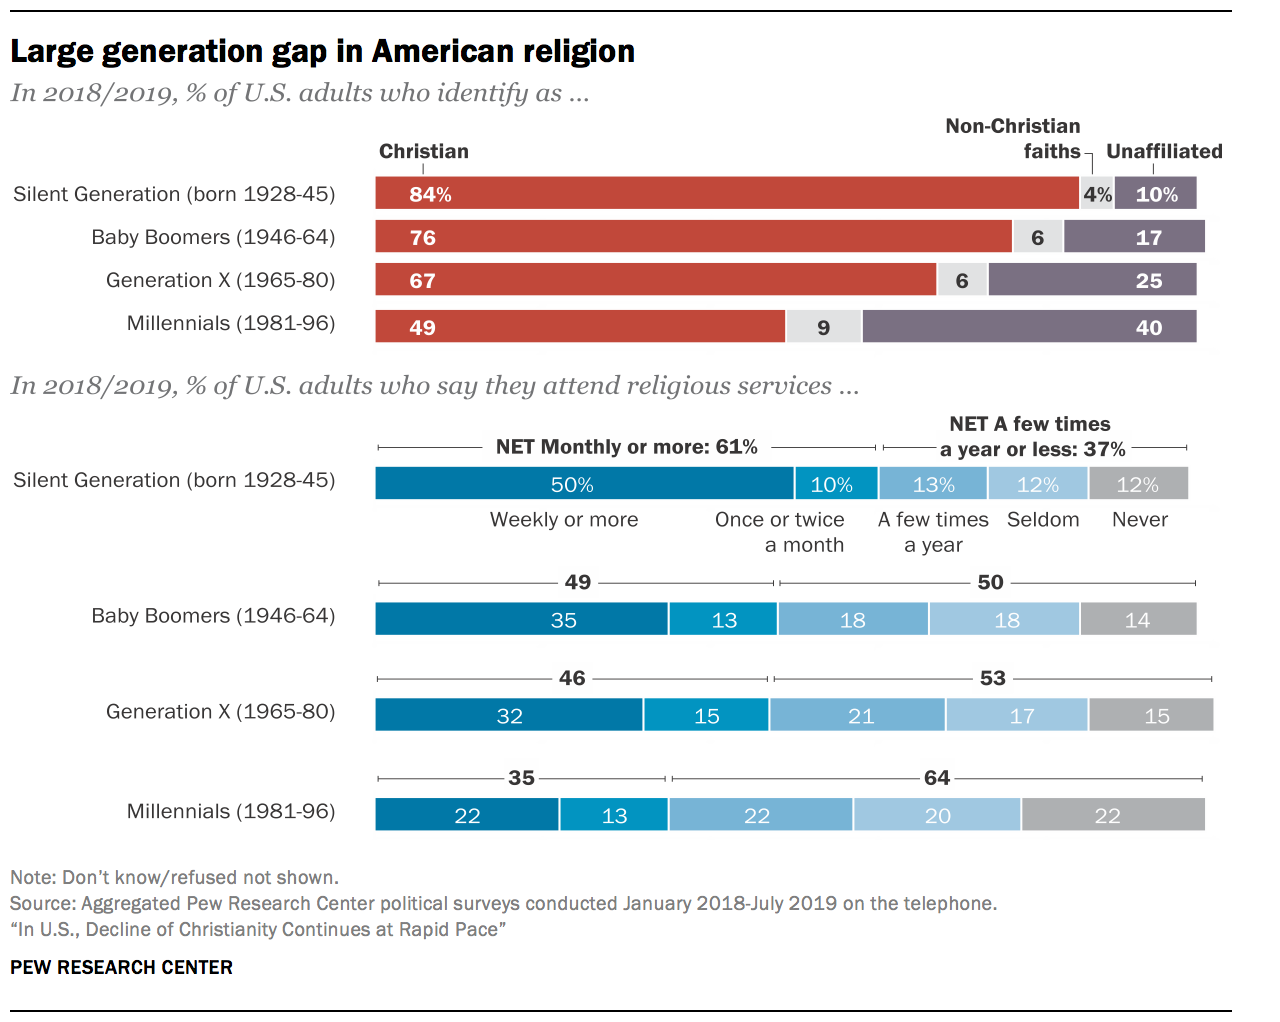
among young adults. Furthermore, the data shows a wide gap between older Americans (Baby Boomers and members of the Silent Generation) and Millennials in their levels of religious affiliation and attendance. More than eight-in-ten members of the Silent Generation (those born between 1928 and 1945) describe themselves as Christians (84%), as do three-quarters of Baby Boomers (76%). In stark contrast, only half of Millennials (49%) describe themselves as Christians; four-in-ten are religious “nones,” and one-in-ten Millennials identify with non-Christian faiths.
Only about one-in-three Millennials say they attend religious services at least once or twice a month. Roughly two-thirds of Millennials (64%) attend worship services a few times a year or less often, including about four-in-ten who say they seldom or never go. Indeed, there are as many Millennials who say they “never” attend religious services (22%) as there are who say they go at least once a week (22%).
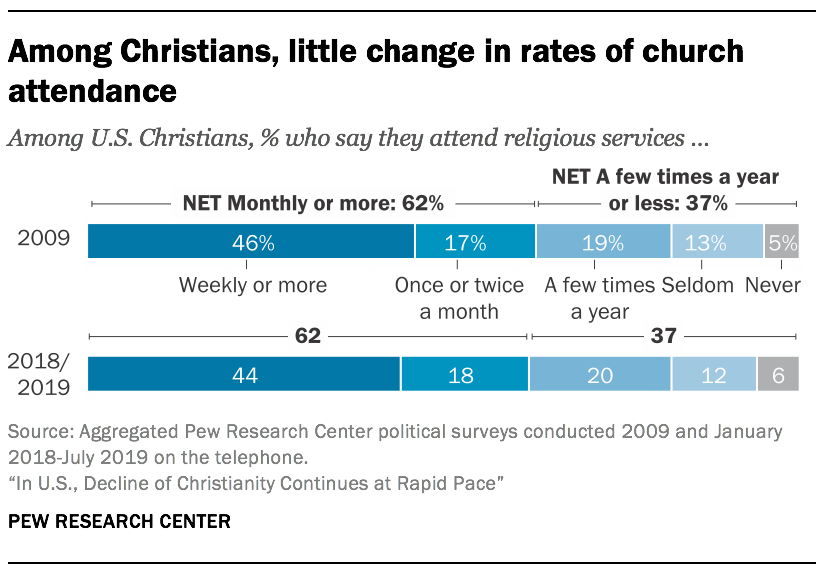 While
the trends are clear – the U.S. is steadily becoming less Christian and
less religiously observant as the share of adults who are not religious
grows – self-described Christians report that they attend religious
services at about the same rate today as in 2009. Today, 62% of
Christians say they attend religious services at least once or twice a
month, which is identical to the share who said the same in 2009. In
other words, the nation’s overall rate of religious attendance is
declining not because Christians are attending church less often, but
rather because there are now fewer Christians as a share of the
population.
While
the trends are clear – the U.S. is steadily becoming less Christian and
less religiously observant as the share of adults who are not religious
grows – self-described Christians report that they attend religious
services at about the same rate today as in 2009. Today, 62% of
Christians say they attend religious services at least once or twice a
month, which is identical to the share who said the same in 2009. In
other words, the nation’s overall rate of religious attendance is
declining not because Christians are attending church less often, but
rather because there are now fewer Christians as a share of the
population. Other key takeaways from the new analysis include:
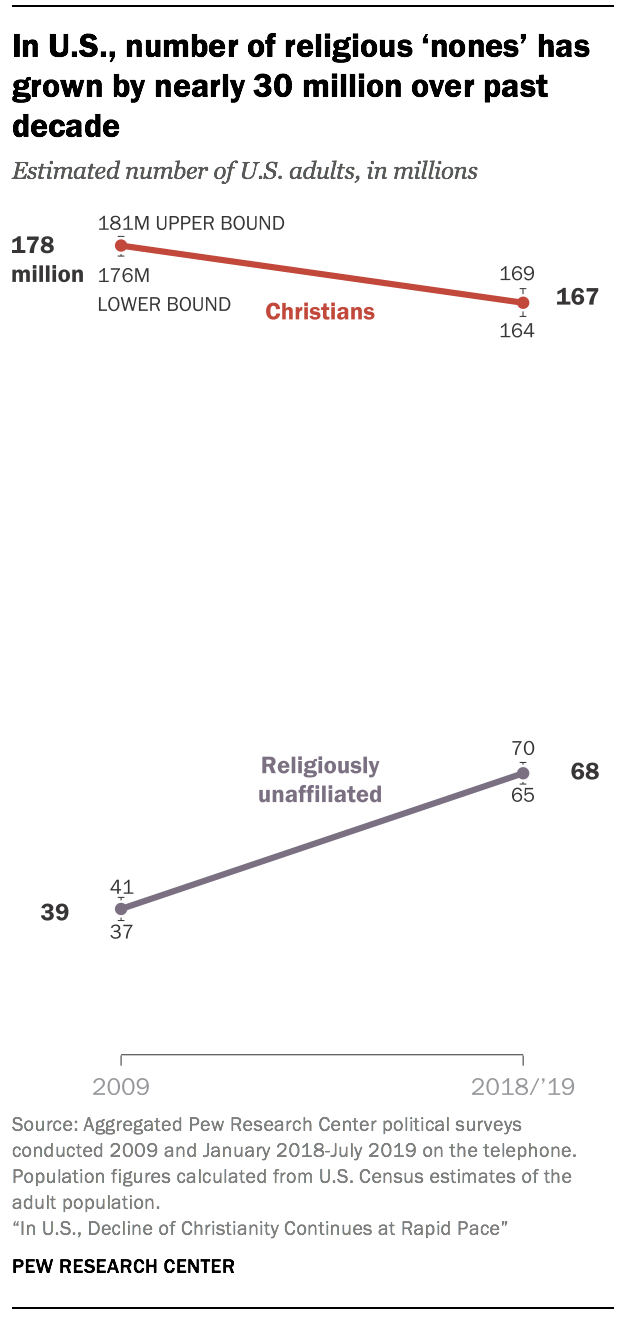 The
data suggests that Christians are declining not just as a share of the
U.S. adult population, but also in absolute numbers. In 2009, there were
approximately 233 million adults in the U.S., according to the Census
Bureau. Pew Research Center’s RDD surveys conducted at the time
indicated that 77% of them were Christian, which means that by this
measure, there were approximately 178 million Christian adults in the
U.S. in 2009. Taking the margin of error of the surveys into account,
the number of adult Christians in the U.S. as of 2009 could have been as
low as 176 million or as high as 181 million.
The
data suggests that Christians are declining not just as a share of the
U.S. adult population, but also in absolute numbers. In 2009, there were
approximately 233 million adults in the U.S., according to the Census
Bureau. Pew Research Center’s RDD surveys conducted at the time
indicated that 77% of them were Christian, which means that by this
measure, there were approximately 178 million Christian adults in the
U.S. in 2009. Taking the margin of error of the surveys into account,
the number of adult Christians in the U.S. as of 2009 could have been as
low as 176 million or as high as 181 million. Today, there are roughly 23 million more adults in the U.S. than there were in 2009 (256 million as of July 1, 2019, according to the Census Bureau). About two-thirds of them (65%) identify as Christians, according to 2018 and 2019 Pew Research Center RDD estimates. This means that there are now roughly 167 million Christian adults in the U.S. (with a lower bound of 164 million and an upper bound of 169 million, given the survey’s margin of error).
Meanwhile, the number of religiously unaffiliated adults in the U.S. grew by almost 30 million over this period.
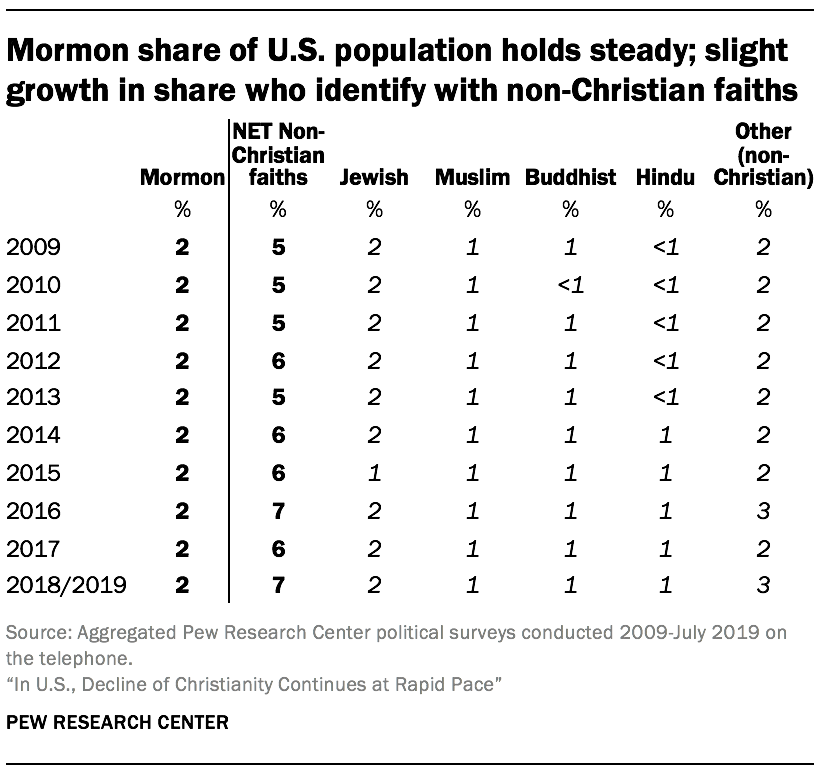 The share of Americans who describe themselves as Mormons has held steady at 2% over the past decade.4
Meanwhile, the share of U.S. adults who identify with non-Christian
faiths has ticked up slightly, from 5% in 2009 to 7% today. This
includes a steady 2% of Americans who are Jewish, along with 1% who are
Muslim, 1% who are Buddhist, 1% who are Hindu, and 3% who identify with
other faiths (including, for example, people who say they abide by their
own personal religious beliefs and people who describe themselves as
“spiritual”)5
The share of Americans who describe themselves as Mormons has held steady at 2% over the past decade.4
Meanwhile, the share of U.S. adults who identify with non-Christian
faiths has ticked up slightly, from 5% in 2009 to 7% today. This
includes a steady 2% of Americans who are Jewish, along with 1% who are
Muslim, 1% who are Buddhist, 1% who are Hindu, and 3% who identify with
other faiths (including, for example, people who say they abide by their
own personal religious beliefs and people who describe themselves as
“spiritual”)5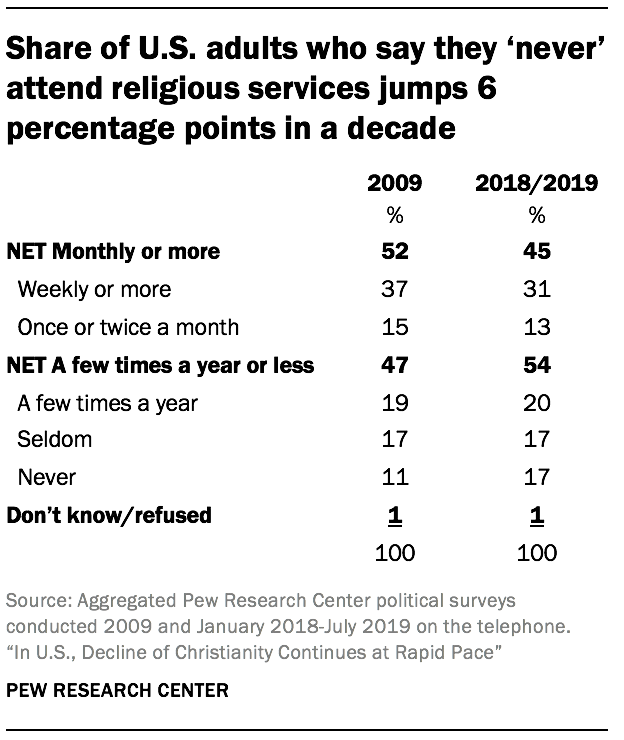 The
rising share of Americans who say they attend religious services no
more than a few times a year (if at all) has been driven by a
substantial jump in the proportion who say they “never” go to church.
Today, 17% of Americans say they never attend religious services, up
from 11% a decade ago. Similarly, the decline in regular churchgoing is
attributable mainly to the shrinking share of Americans who say they
attend religious services at least once a week, which was 37% in 2009
and now stands at 31%.
The
rising share of Americans who say they attend religious services no
more than a few times a year (if at all) has been driven by a
substantial jump in the proportion who say they “never” go to church.
Today, 17% of Americans say they never attend religious services, up
from 11% a decade ago. Similarly, the decline in regular churchgoing is
attributable mainly to the shrinking share of Americans who say they
attend religious services at least once a week, which was 37% in 2009
and now stands at 31%.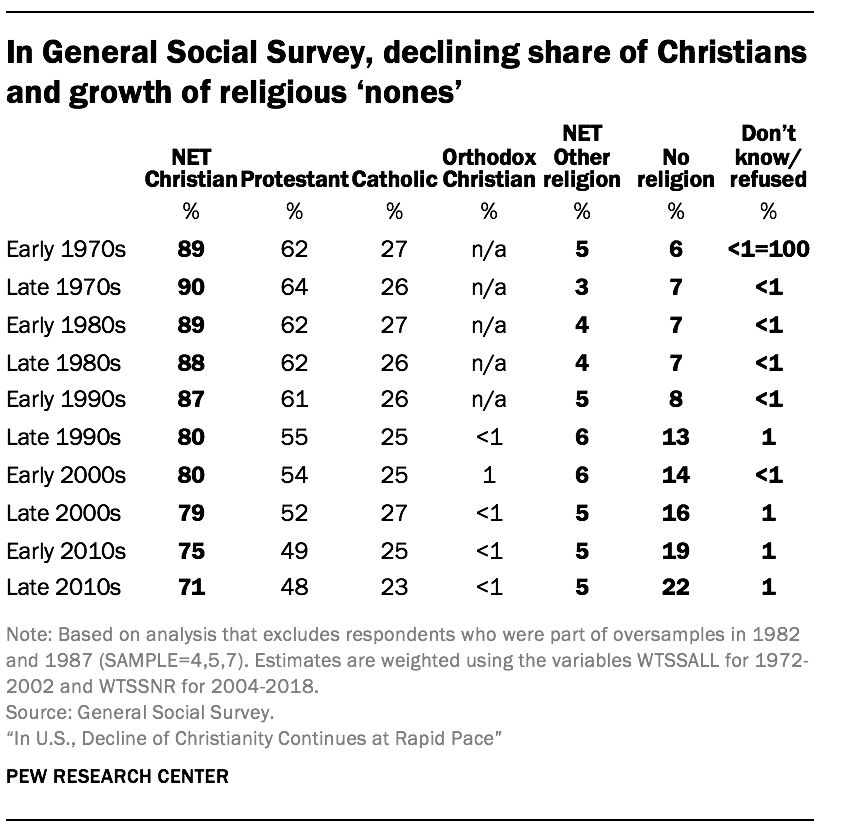 The
trends documented in Pew Research Center surveys closely resemble those
found in the long-running General Social Survey (GSS), a project of the
independent research organization NORC at the University of Chicago,
with principal funding from the National Science Foundation. In GSS
surveys conducted in the early 2000s (2000 to 2004), 80% of U.S. adults
identified as Christians, including 54% who described themselves as
Protestants and 25% who were Catholic. By the late 2010s, 71% of GSS
respondents described themselves as Christians (48% Protestant, 23%
Catholic). Over the same period, the GSS found that religious “nones”
grew from 14% of the U.S. adult population to 22%.
The
trends documented in Pew Research Center surveys closely resemble those
found in the long-running General Social Survey (GSS), a project of the
independent research organization NORC at the University of Chicago,
with principal funding from the National Science Foundation. In GSS
surveys conducted in the early 2000s (2000 to 2004), 80% of U.S. adults
identified as Christians, including 54% who described themselves as
Protestants and 25% who were Catholic. By the late 2010s, 71% of GSS
respondents described themselves as Christians (48% Protestant, 23%
Catholic). Over the same period, the GSS found that religious “nones”
grew from 14% of the U.S. adult population to 22%. The point estimates from the GSS and Pew Research Center surveys (that is, the share of adults who identify as Protestant or Catholic or as religious “nones”) are not directly comparable; the two studies ask different questions and employ different modes of survey administration. But the fact that the direction of the trend is similar in both studies strongly suggests that both are picking up on real and significant change underway in the U.S. religious landscape.
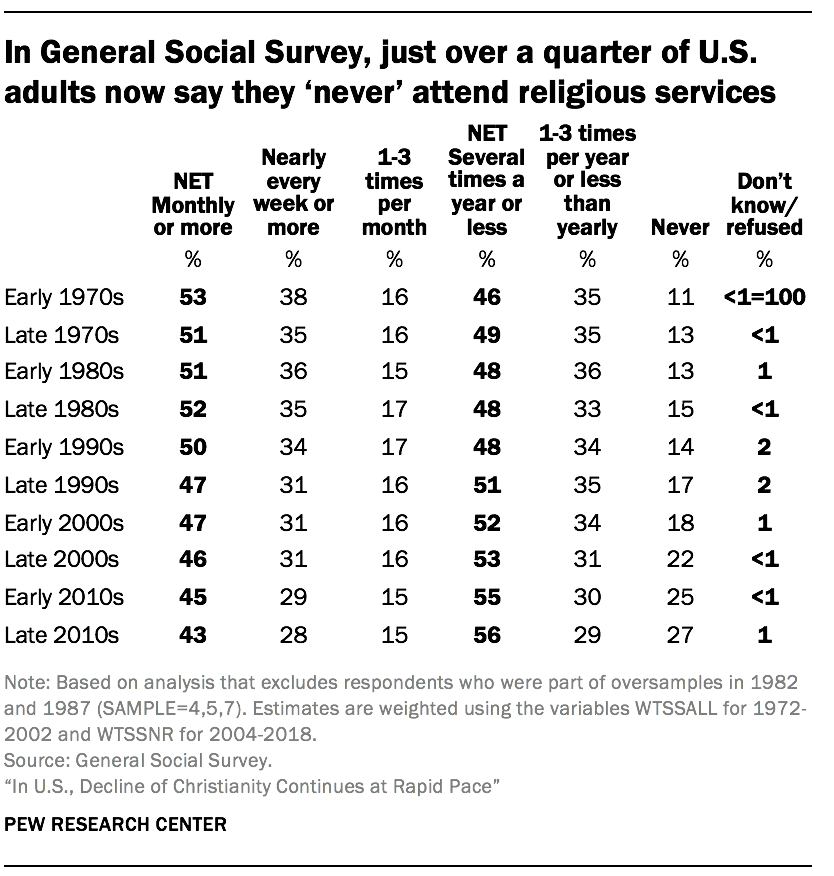 Similarly,
the GSS finds that a declining share of U.S. adults say they attend
religious services regularly. In the most recent GSS studies, 43% of
respondents say they attend religious services at least monthly, down
from 47% in the early 2000s and 50% in the early 1990s. Meanwhile, the
share of U.S. adults who say they “never” attend religious services now
stands at 27%, up from 18% in the early 2000s and roughly double the
share who said this in the early 1990s (14%).
Similarly,
the GSS finds that a declining share of U.S. adults say they attend
religious services regularly. In the most recent GSS studies, 43% of
respondents say they attend religious services at least monthly, down
from 47% in the early 2000s and 50% in the early 1990s. Meanwhile, the
share of U.S. adults who say they “never” attend religious services now
stands at 27%, up from 18% in the early 2000s and roughly double the
share who said this in the early 1990s (14%).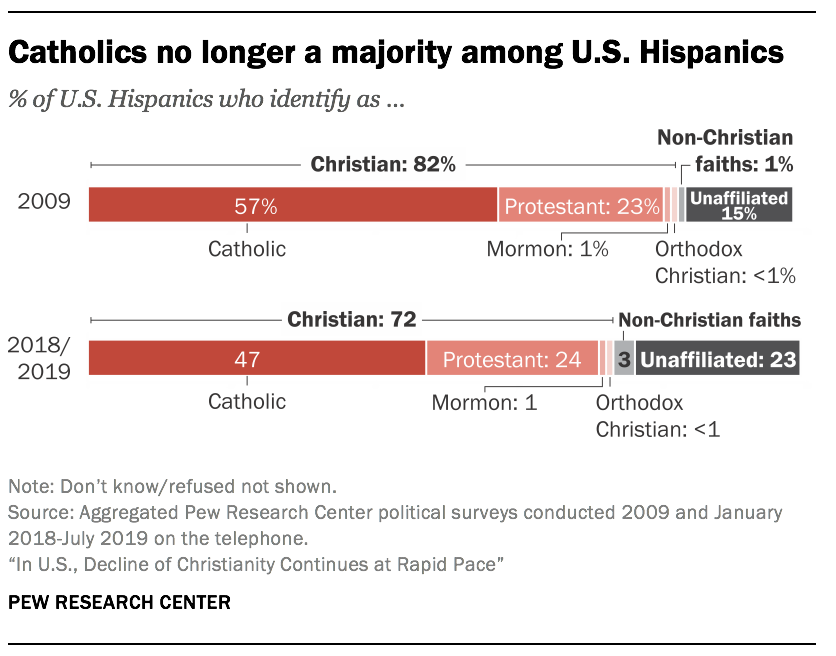 Catholics
no longer constitute a majority of the U.S. Hispanic population. In Pew
Research Center RDD surveys conducted in 2018 and 2019, 47% of
Hispanics describe themselves as Catholic, down from 57% a decade ago.
Meanwhile, the share of Hispanics who say they are religiously
unaffiliated is now 23%, up from 15% in 2009.
Catholics
no longer constitute a majority of the U.S. Hispanic population. In Pew
Research Center RDD surveys conducted in 2018 and 2019, 47% of
Hispanics describe themselves as Catholic, down from 57% a decade ago.
Meanwhile, the share of Hispanics who say they are religiously
unaffiliated is now 23%, up from 15% in 2009. These findings about the religious composition of Hispanics closely resemble those from Pew Research Center’s National Surveys of Latinos (NSL) – a nationally representative survey of U.S. Latino adults fielded almost every year. (See the detailed tables for complete trends in the religious composition of Hispanics based on both Pew Research Center political surveys and the NSL.)
 Among
white adults, the share of people who say they attend religious
services a few times a year or less now exceeds the share who attend
monthly or more (57% vs. 42%); a decade ago, the white population was
evenly divided between those who went to church at least monthly and
those who did not. Regular churchgoers still outnumber those who
infrequently or never go to religious services among black Americans
(58% vs. 41%), though the share of people who say they attend religious
services a few times a year or less often has risen over the last decade
among black Americans, just as it has among the population as a whole.
U.S. Hispanics are now about evenly divided between those who say they
attend religious services at least once or twice a month (51%) and those
who say they attend a few times a year or less (49%).
Among
white adults, the share of people who say they attend religious
services a few times a year or less now exceeds the share who attend
monthly or more (57% vs. 42%); a decade ago, the white population was
evenly divided between those who went to church at least monthly and
those who did not. Regular churchgoers still outnumber those who
infrequently or never go to religious services among black Americans
(58% vs. 41%), though the share of people who say they attend religious
services a few times a year or less often has risen over the last decade
among black Americans, just as it has among the population as a whole.
U.S. Hispanics are now about evenly divided between those who say they
attend religious services at least once or twice a month (51%) and those
who say they attend a few times a year or less (49%).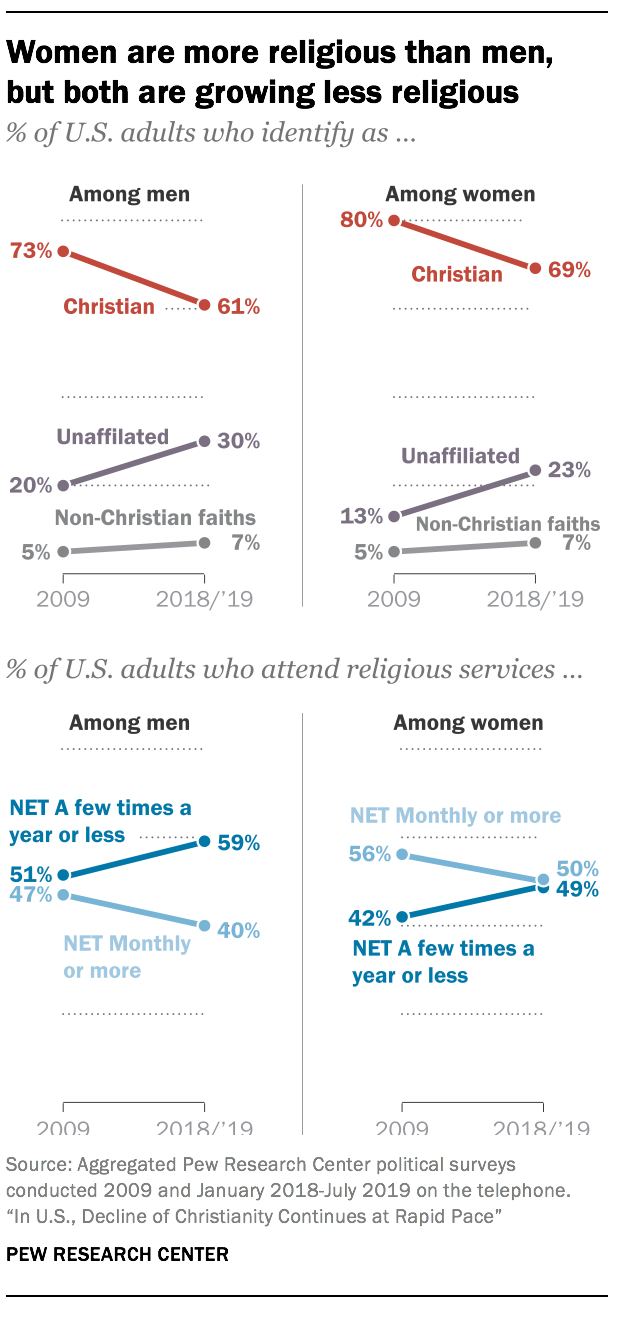 There is still a gender gap
in American religion. Women are less likely than men to describe
themselves as religious “nones” (23% vs. 30%), and more likely than men
to say they attend religious services at least once or twice a month
(50% vs. 40%). But women, like men, have grown noticeably less religious
over the last decade. The share of “nones” among women has risen by 10
percentage points since 2009 – similar to the increase among men. And
the share of women who identify as Christian has fallen by 11 points
(from 80% to 69%) over that same period.
There is still a gender gap
in American religion. Women are less likely than men to describe
themselves as religious “nones” (23% vs. 30%), and more likely than men
to say they attend religious services at least once or twice a month
(50% vs. 40%). But women, like men, have grown noticeably less religious
over the last decade. The share of “nones” among women has risen by 10
percentage points since 2009 – similar to the increase among men. And
the share of women who identify as Christian has fallen by 11 points
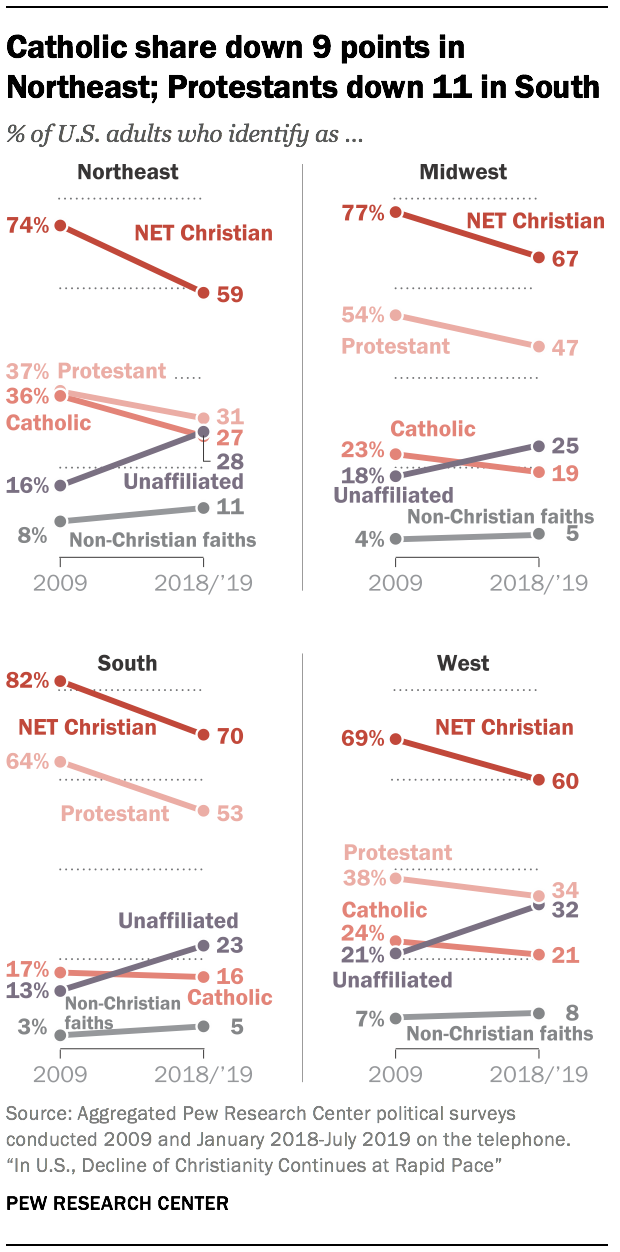
(from 80% to 69%) over that same period.Christians have declined and “nones” have grown as a share of the adult population in all four major U.S. regions. Catholic losses have been most pronounced in the Northeast, where 36% identified as Catholic in 2009, compared with 27% today. Among Protestants, declines were larger in the South, where Protestants now account for 53% of the adult population, down from 64% in 2009.
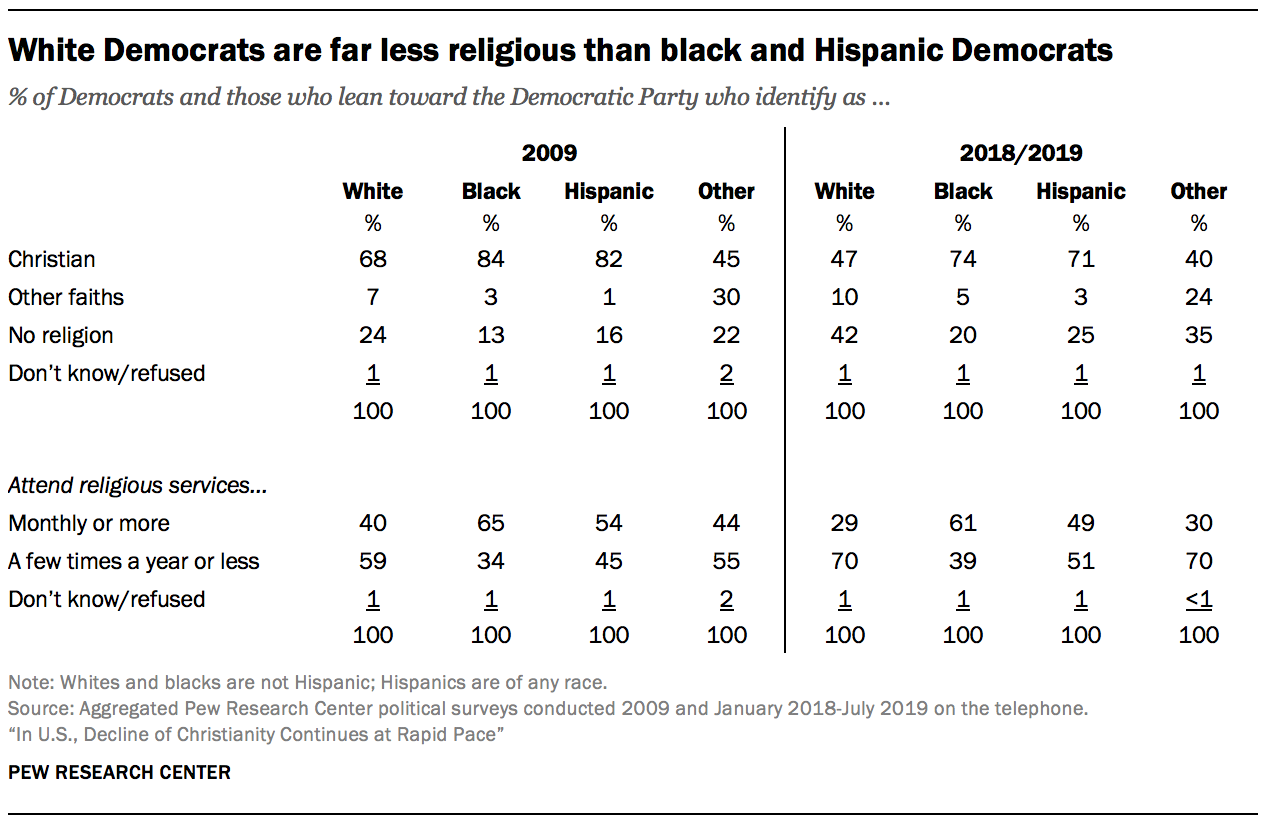
Religious “nones” now make up fully one-third of Democrats. And about six-in-ten people who identify with or lean toward the Democratic Party say they attend religious services no more than a few times a year. The ranks of religious “nones” and infrequent churchgoers also are growing within the Republican Party, though they make up smaller shares of Republicans than Democrats.

The religious profile of white Democrats is very different from the religious profile of racial and ethnic minorities within the Democratic Party. Today, fewer than half of white Democrats describe themselves as Christians, and just three-in-ten say they regularly attend religious services. More than four-in-ten white Democrats are religious “nones,” and fully seven-in-ten white Democrats say they attend religious services no more than a few times a year. Black and Hispanic Democrats are far more likely than white Democrats to describe themselves as Christians and to say they attend religious services regularly, though all three groups are becoming less Christian.
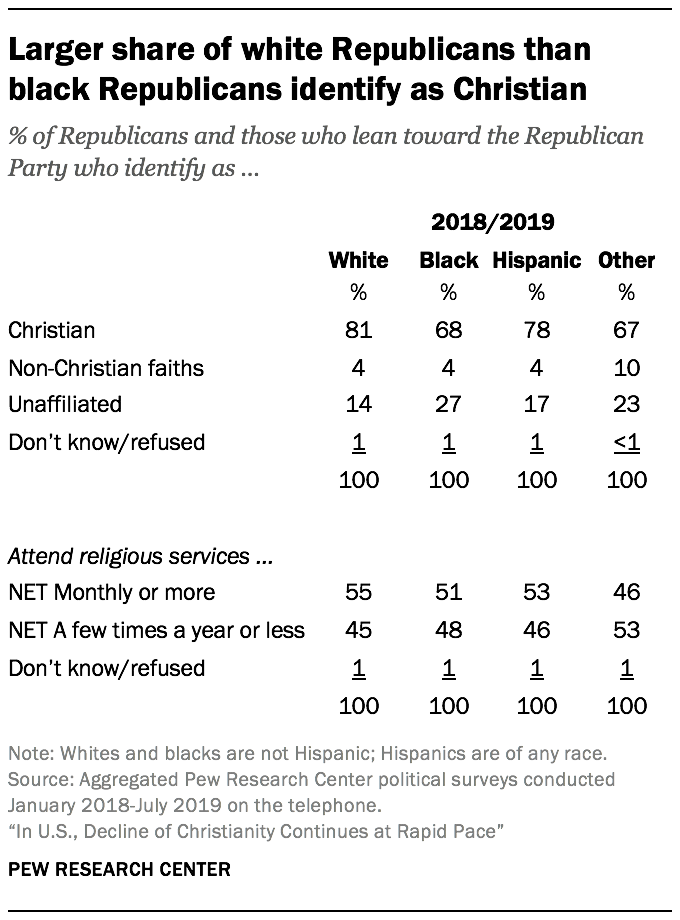 Although
2009 surveys did not include enough black Republicans to analyze
separately, the most recent surveys show smaller religious differences
by race and ethnicity among Republicans than Democrats.
Although
2009 surveys did not include enough black Republicans to analyze
separately, the most recent surveys show smaller religious differences
by race and ethnicity among Republicans than Democrats.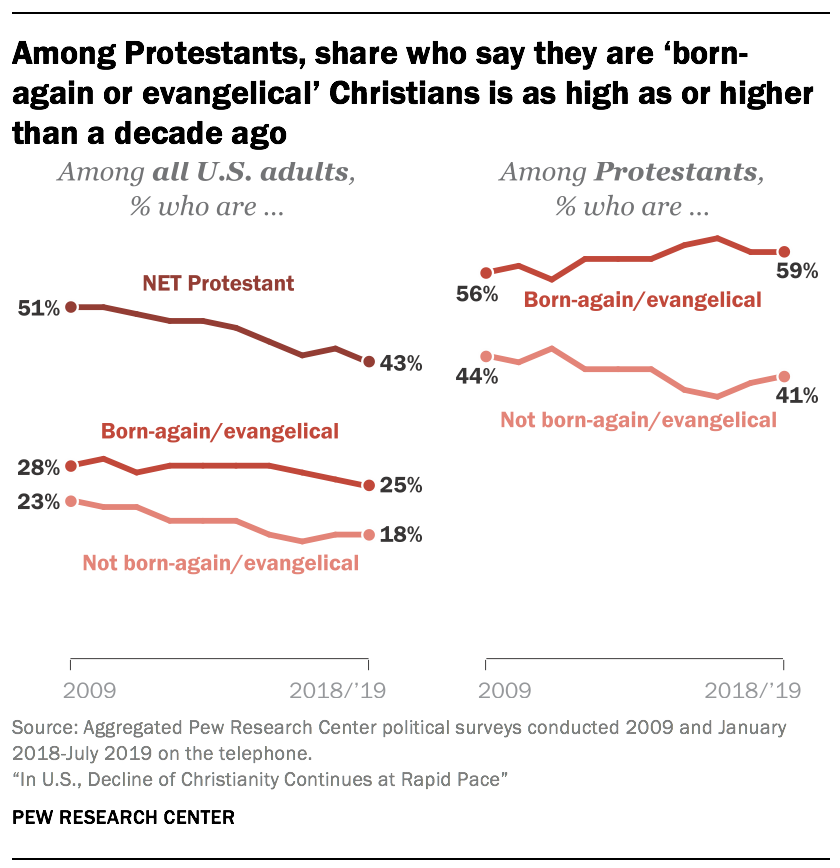 Pew
Research Center’s telephone political polls do not typically include
the detailed questions that are needed to determine whether Protestants
identify with denominations in the evangelical, mainline or historically
black Protestant tradition. However, the political polls upon which
this analysis is based do ask Protestants whether they think of
themselves as “born-again or evangelical” Christians. The data shows
that both Protestants who describe themselves as born-again or
evangelical Christians and Protestants who are not born-again or
evangelical have declined as a share of the overall U.S. adult
population, reflecting the country’s broader shift away from
Christianity as a whole. However, looking only at Americans who identify
as Protestants – rather than at the public as a whole – the share of
all Protestants who are born-again or evangelical is at least as high
today as it was in 2009.
Pew
Research Center’s telephone political polls do not typically include
the detailed questions that are needed to determine whether Protestants
identify with denominations in the evangelical, mainline or historically
black Protestant tradition. However, the political polls upon which
this analysis is based do ask Protestants whether they think of
themselves as “born-again or evangelical” Christians. The data shows
that both Protestants who describe themselves as born-again or
evangelical Christians and Protestants who are not born-again or
evangelical have declined as a share of the overall U.S. adult
population, reflecting the country’s broader shift away from
Christianity as a whole. However, looking only at Americans who identify
as Protestants – rather than at the public as a whole – the share of
all Protestants who are born-again or evangelical is at least as high
today as it was in 2009.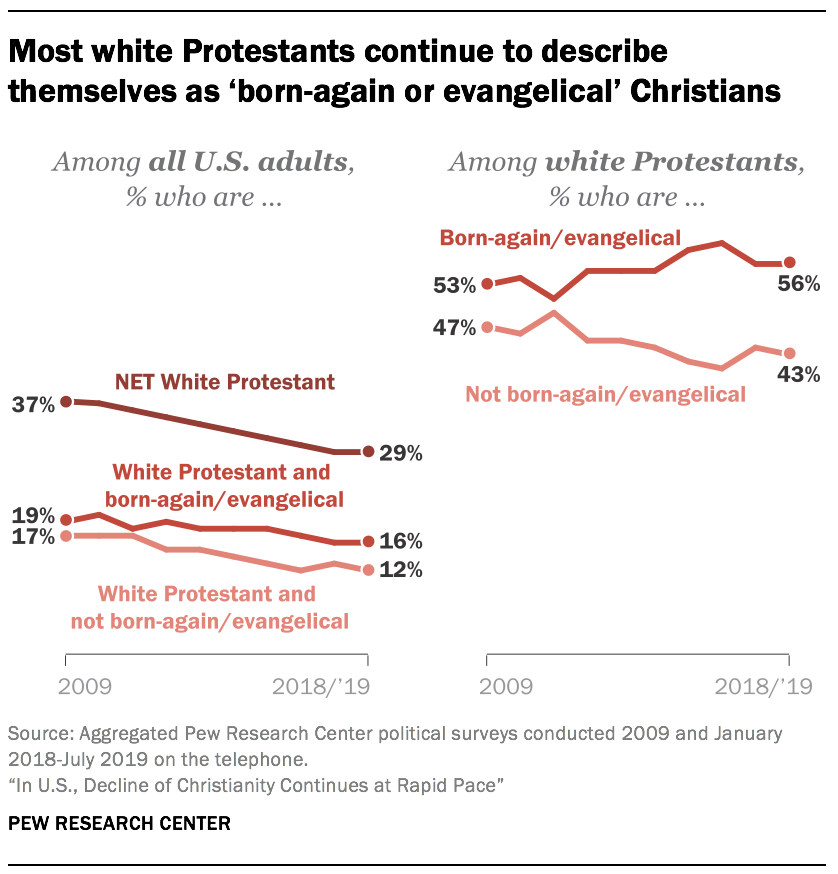 The
share of U.S. adults who are white born-again or evangelical
Protestants now stands at 16%, down from 19% a decade ago. The shrinking
white evangelical share of the population reflects both demographic changes
that have occurred in the United States (where white people constitute a
declining share of the population) and broader religious changes in
American society (where the share of all adults who identify with
Christianity has declined). However, looking only at white Protestants –
rather than at the public as a whole – the share of white Protestants
who describe themselves as born-again or evangelical Christians is at
least as high as it was a decade ago.
The
share of U.S. adults who are white born-again or evangelical
Protestants now stands at 16%, down from 19% a decade ago. The shrinking
white evangelical share of the population reflects both demographic changes
that have occurred in the United States (where white people constitute a
declining share of the population) and broader religious changes in
American society (where the share of all adults who identify with
Christianity has declined). However, looking only at white Protestants –
rather than at the public as a whole – the share of white Protestants
who describe themselves as born-again or evangelical Christians is at
least as high as it was a decade ago.
אין תגובות:
הוסף רשומת תגובה