
Demystifying the digital databases widely used by political campaigns
Since the rise of modern survey research, much of what is known about voter attitudes, behavior and the composition of the electorate has come from interviews with samples of voters, sometimes in combination with aggregate voting statistics. But relatively recent technological innovations and government policy changes have given political practitioners and researchers a new addition to their toolbox: national digital databases, or “voter files.” These files are built by commercial organizations using official, publicly available government records of who is registered to vote and who cast ballots in past elections.
As research and targeting using these voter files has become more widespread, voter file vendors are increasingly trying to provide coverage of all U.S. adults, including those who are not registered to vote. These commercially available files provide not only a nationwide picture of voter registration and turnout, but are usually supplemented with information from consumer data vendors, credit bureaus, political organizations and other sources and are marketed as providing a rich and comprehensive record for nearly every American adult.
Over the last decade, commercial voter files have become central to the conduct of contemporary election campaigns and are frequently employed by pollsters, journalists and political analysts trying to understand the American electorate. As part of a broader effort at Pew Research Center to shed light on this important but somewhat arcane resource, this report focuses on using the files to enhance our understanding of survey respondents. It also attempts to evaluate the quality of the data provided by the files.
In order to accomplish these goals, voter file data acquired from five commercial vendors were matched to participants in Pew Research Center’s American Trends Panel, a nationally representative sample of adults who have agreed to take surveys on a regular basis. This offers an opportunity to compare self-reported voter registration and turnout data provided by panelists – data that are subject to well-documented survey errors – to the high-quality official vote records included in the voter files. It also provides a chance to use data acquired from survey interviews with panelists to verify the accuracy of the ancillary information that commercial vendors attach to the voter files, including additional demographic, financial, lifestyle and political data.
The data sources
To describe and evaluate voter files, Pew Research Center attempted to link all of the nearly 5,000 members of the American Trends Panel (ATP), its nationally representative survey panel of U.S. adults, to five commercial voter files. Two of the files are from nonpartisan vendors, two are from vendors that work primarily with Democratic and politically progressive clients and one is from a vendor that works primarily with Republican and politically conservative clients. The vendors are anonymized and numbered from one to five in this report, ordered by the rate at which the voter file records were matched to members of the panel.
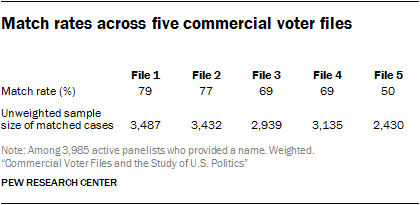
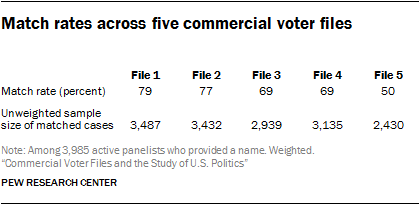 All vendors were provided with the same panelist information for searching, which included their name, address, gender, phone number, race and ethnicity, date of birth or age and email address. Vendors were then asked to find these individuals in their voter files using their normal matching methodology. The vendors then provided Center researchers with voter file data on voter registration and turnout, party affiliation and demographic characteristics for each panelist they were able to match. Vendors were obligated to maintain this information in strict confidence and to permanently delete all personally identifying information about panelists when the matching was completed. Overall, 91% of the 3,985 active members of the ATP who took part in a survey conducted Nov. 29 to Dec. 12, 2016 (and who provided a name) yielded a match by at least one of the vendors.1
Summary of findings
Commercial voter files are an amalgamation of administrative data from states about registration and voting, modeled data about partisanship, political engagement and political support provided by vendors; and demographic, financial and lifestyle data culled from a wide range of sources. Bringing together data from a number of different sources brings challenges, as each source comes with its own strengths and weaknesses. A principal goal of this study was to assess the accuracy and completeness of the information in the commercial voter files. For most of the analyses, information provided by respondents in the American Trends Panel is used to assess the quality of the information in the voter files. Here are some of the most important findings, followed by additional detail from the analysis:
Researchers were able to match a very high percentage of panelists from the nationally representative survey sample to at least one of the five commercial voter files, suggesting that the files collectively cover a large share of the U.S. population. Depending on the voter file vendor, the percentage of panelists matched varied from a low of 50% to a high of 79%, with an average match rate of 69%. Less than half (42%) of the panelists were located in all five files, but each of the vendors “found” panelists missed by other vendors. Differences among the vendors are largely a function of their tolerance for mismatches and, presumably, the success of their matching algorithms. Collectively, the vendors successfully matched 91% of panelists, meaning that more than nine-in-ten panelists could be found on at least one of the files and just 9% of panelists could not be found on any of the files. The relatively high level of coverage of the files is encouraging for researchers and campaigns that use them for targeting, messaging or research. Of course, most clients using these voter files will not have purchased all five of them, so match rates of 90% and higher may be difficult if not impossible to achieve with any single file.
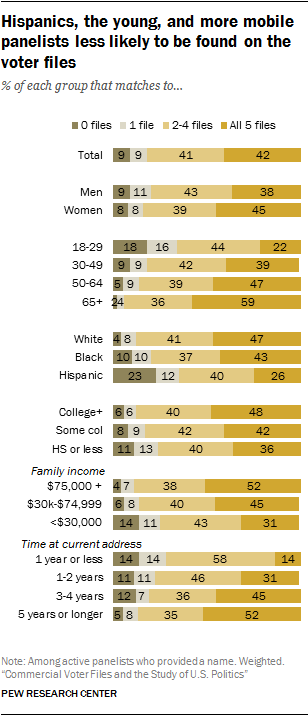 Still, commercial voter files may disproportionately miss segments of the public who are politically disengaged, younger, Hispanic and more mobile. Specifically, the likelihood of finding an individual on a commercial voter file was strongly related to whether they were registered to vote. On average across the five vendors, 77% of people who said they were registered to vote were matched. Only 38% of the self-described unregistered voters were matched. Similarly, match rates varied greatly by panelists’ age, race and ethnicity. Only about one-in-five younger panelists (22% of those ages 18 to 29) were found in all five files, as compared to more than half (59%) of older panelists (ages 65 and older). Similarly, just 26% of Hispanics were found in all five files, compared with 47% of non-Hispanic whites. 2 Mobility is also a strong correlate. Only 14% of those who reported moving in the last year were found on all five files. Those who reported living at their residence for longer matched at a much higher rate.
As a result of the systematic demographic differences in the types of people who were difficult to locate in the files, this analysis finds that commercial voter files may have significant limitations for efforts to study the general public (as opposed to registered voters). In comparison with random-digit-dial telephone samples, voter files do not provide the same degree of coverage of the adult population overall, and the kinds of people missed by the files may be very different politically and demographically from those who can be found in the files and contacted by phone.
The process of matching survey panelists to the voter files can be vexed by small differences in names and addresses, leading to ambiguity regarding the accuracy of some of the matches. In addition, difficulty with matching is related to lifestyle and demographic factors – such as frequently changing one’s residence – that are also correlated with political engagement and party preferences.
Across the five vendors there were significant differences in matching styles and, as a result, match rates. Some vendors restricted their matching only to panelists for whom they had a very high degree of certainty about the accuracy of the matches, resulting in an older and more politically engaged set of matched panelists. Other vendors assessed the trade-off differently and matched a higher share of panelists, producing a more diverse matched group while accepting more uncertainty about the accuracy of their matches.
The files generally agree with respect to voter turnout in the 2016 presidential election (at least among survey respondents who are matched in common), though one of the files appeared to miss a number of voters captured by the other four files. And there is no record of voting for nearly all survey respondents who said in a post-election survey that they did not vote in 2016.Among panelists who were matched by all the vendors in the study, 85% have identical turnout records across the five files: 75% are recorded as having voted in 2016 in all five files and 10% have no record of a vote in all five files. One file – File 3 – had records that conflicted with the other four files for many panelists, indicating that they may have missed the state voter records for many panelists.Another potential measure of data quality in measures of turnout is how closely the self-reported vote choice (e.g., Trump vs. Clinton) among those panelists flagged as having voted matched the actual election outcome. Reported presidential vote by panelists verified as having voted by at least one of the voter file vendors is very similar to the national vote share for each candidate (48% Clinton, 45% Trump among validated voters, compared with the official outcome of 48%-46%). Presidential vote among these validated voters was much closer to the outcome than the vote among all self-reported voters in the panel (49% Clinton, 43% Trump).
Self-reported data on voter registration status is particularly problematic. Many panelists who expressed doubt about their registration in a survey, or who said they were definitely not registered, nevertheless had a registration record on at least one file. This may reflect the fact that voter registration is an administrative status that is somewhat abstract rather than a more easily remembered behavior like voting.
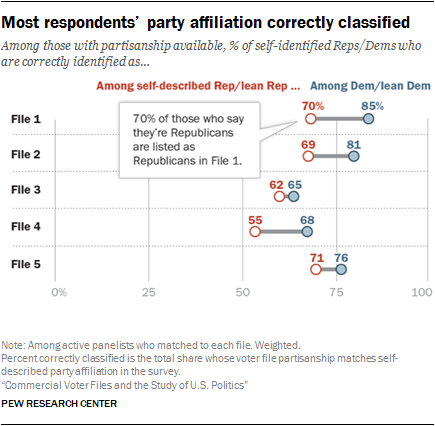 There was a relatively close correspondence between panelists’ self-reported party affiliation and the party identification predicted by voter file vendors. Voter file data on party affiliation benefits from the fact that many states register voters by party, and while voters’ party registration might not always match their self-identification, it is a very good proxy. However, even in states without party registration (roughly half of U.S. adults live in such states), the voter file estimates of party affiliation tended to be reasonably accurate. On average across the five files, modeled party affiliation in the files matched self-reported party affiliation for about two-thirds of panelists (67%). In general, the files did a better job of identifying Democrats than Republicans.
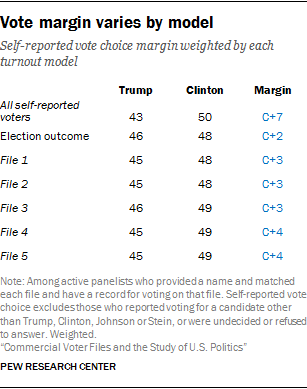
Voter file turnout models did a good job of predicting who would vote in 2016. The analysis in this report, along with a previous Pew Research Center study, show that using these scores to create a likely electorate for the 2016 general election improves election estimates relative to relying on self-reported information alone.Prior to the 2016 general election, each vendor provided a measure of turnout likelihood in the election, and applying these measures improved the accuracy of the American Trends Panel’s estimate of voter preferences in the presidential race. The estimate narrowed Hillary Clinton’s advantage from 7 percentage points among all registered voters to a range of 3 to 5 points using the modeled turnout scores. She ended up with a 2-point advantage over Donald Trump on Election Day. Past voter history is a key component of these models, but the exact algorithms the vendors use are not public.
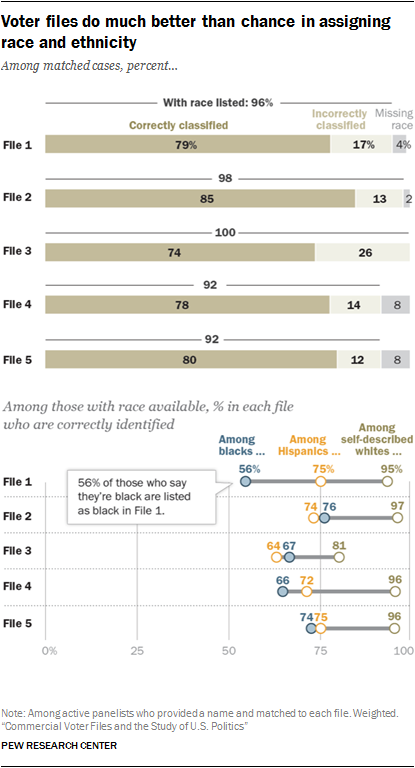
 The voter file estimate of the race or ethnicity of panelists, when provided, also matched the survey data reasonably well. The files are able to accurately categorize 79% of panelists (on average) by race and ethnicity, including an average of 93% for non-Hispanic whites, 72% for Hispanics and 67% for blacks.
Other demographic data in the voter files – like education and income data – tended to be suggestive at best and were often missing entirely. The vendors differed considerably in the accuracy of some of these kinds of variables. Education level was either missing or inaccurate an average of 48% of the time across the files. Similarly, household income was missing or inaccurate 63% of the time on average across the files. In general, these demographic variables simply provide a greater likelihood of identifying a group of interest, rather than any certitude of doing so.
Caveats about the analysis
Because much of the analysis presented here is based on a comparison using data from Pew Research Center’s American Trends Panel, it is important to note that no survey, including the American Trends Panel, perfectly represents the adult population of the U.S. While data in the panel are weighted to be nationally representative with respect to a wide range of characteristics (age, sex, race, Hispanic origin, education, region of residence, population density etc.), no survey is an exact model of the population in all respects. A second caveat is that while most of the demographic information and partisan affiliation provided by the panelists is likely to be correct, self-reports of voter registration – or voter turnout, in particular – may err because of the phenomenon known as social desirability bias. Some individuals may report being registered or having voted when they have not. In general, self-reported demographic and related personal information about panelists will be treated as true, while self-reports of political engagement –behaviors that are viewed as socially desirable and are often overreported – will need to be evaluated carefully in light of the information in the voter files.
History of voter files
Election administration in the U.S. has historically been highly decentralized, with states adopting a range of methods for managing the election process and keeping records of who is eligible to vote and who has voted. This patchwork made it very difficult, if not impossible, to assemble anything resembling a national database of voters. Even statewide databases were unavailable in some places.
The relatively recent availability of commercial voter files is a result of both technological progress and government policy changes that resulted from problems in recent U.S. elections. The 2000 presidential election raised concerns about the accuracy, consistency and quality of election administration systems. In its aftermath, Congress adopted the Help America Vote Act of 2002 (HAVA) to address some of these issues. Among the many provisions of HAVA was that states were directed to create “a single, uniform, official, centralized, interactive computerized statewide voter registration list defined, maintained, and administered at the State level that contains the name and registration information of every legally registered voter in the State …”3 These digital databases then made it possible for partisan and commercial organizations to collect and compile national files of voters by combining the digital files from each state and the District of Columbia.
In an age when personal information has been increasingly commoditized, the files then iterated a step further. Very comprehensive databases of nearly all adults in the U.S. are now maintained by credit bureaus and other businesses. Commercial voter files based on registered voters can be compared with the larger databases of all adults to identify individuals who are not registered to vote. Records for these individuals are then added to the commercial voter files and all of the records are populated with additional political and nonpolitical information.
The compilation process that companies use to create the national voter files is far easier now than it was before HAVA, but it is not without its challenges. Americans remain a fairly mobile population, meaning that credit, consumer and voter files must be continually updated. A registered voter who moves to another state must re-register, and there is no uniform method by which election officials across states are notified when a voter moves. While both election officials and the commercial voter file vendors attempt to keep track of individuals when they move using resources such as the National Change of Address database from the U.S. Postal Service, the process is hardly foolproof. Each commercial vendor uses different methods for updating its files and making judgments about which official record associated with an individual is the most current one. Still, even with their flaws, the commercial voter files constitute a considerable improvement over what was available to campaigns, parties and researchers prior to the passage of HAVA.
Matching the American Trends Panel to voter files
In addition to their use as survey sample sources, voter files are commonly used in political research by matching and linking them to people who have responded to polls or are found in various lists such as members of the clergy or physicians. Efforts to link public vote records to surveys go back several decades prior to the existence of modern commercial voter files. In the 1980s, the American National Election Study attempted to link voter turnout records to its respondents by having interviewers visit local election offices where the respondents lived. This labor-intensive and expensive effort was later abandoned but has been revived with the availability of better quality digital files in individual states and the commercial files covering the entire country. The Cooperative Congressional Election Study is another prominent election survey that has matched respondents to a voter file.
The process of linking commercial voter file records to survey respondents (or any list, for that matter) might seem straightforward: Use the respondent’s name, address and other information to identify a voter file record for the same person. However, the matching process can falter if there are major differences in names (e.g., a maiden name vs. current married name), or addresses (e.g., if respondents have recently moved). Quirks in the data can also affect the matching process. And some individuals are simply not present in the commercial voter files at all. For uniformity, we accepted the data as the vendors sent it, knowing that for a variety of reasons (including those listed above), some vendors matched panelists that others did not.
 To better understand and evaluate both the matching process and the properties of voter files, Pew Research Center attempted to match members of the American Trends Panel, its nationally representative survey panel, to five different commercial voter files. To be sure, there are more than five vendors that maintain comprehensive national voter lists, but the vendors used in this study represent five of the most prominent and commonly used voter files. Two of the files are from vendors that are traditionally nonpartisan, and three are from vendors that work primarily with clients on one side of the partisan spectrum – two that work with Democratic and politically progressive clients and one who works with Republican and politically conservative clients.4
 All vendors were provided with the same panelist information: name, address, gender, phone number, race and ethnicity, date of birth and email address. They were asked to find these individuals in their voter files using their normal matching methodology and return the voter file records, such as registration status and turnout history, to Pew Research Center. Of the 3,985 active members5 of the ATP who provided a name6, 91% were identified in at least one of the five commercial voter files. Vendors agreed to delete personally identifying information about panelists when the matching was completed.
When considered in total there is a high level of coverage of the survey panelists. But individual vendors matched at different rates. Two of the files (Files 1 and 2) matched the highest share of panelists (79% and 77% respectively) followed by Files 3 and 4 at 69% each.
File 5 matched at the lowest rate of just 50% of panelists. However, a low match rate does not necessarily imply lower quality data. In a follow-up analysis conducted to evaluate the quality of the matches, 99% of File 5’s matches were judged as likely accurate, compared with 94% to 97% of the other vendors’ matches. Voter file vendors told us that they have differing thresholds for confidence in selecting a match. This offers clients a trade-off in getting more data with more matches, at the cost of potentially including some inaccurate matches, versus fewer matches and greater accuracy but potentially more bias in the cases that are matched.7
Officials at File 5 said they were confident about the quality of their matches, which was borne out by our evaluation. However, they matched far fewer panelists than some other vendors and thus provided much less usable information overall, even if matches are limited to those who meet a high threshold of accuracy.
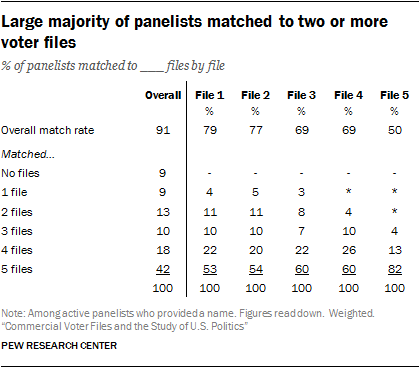
There is significant overlap in who matched to each file. Records for four-in-ten panelists (41%) were found on all five voter files and another 18% were found by four of the five vendors. Overall, 9% of panelists were found only on a single file – with most in this group coming from Files 1, 2 and 3). But each of the vendors found panelists that other vendors missed. Only 9% of panelists were not found by any of the vendors.
Matches made by File 5 (with the lowest overall match rate) have the highest overlap with other vendor matches. Fully 82% of matches to File 5 were also found by the four other files, followed closely by Files 3 and 4, with 60% of their matches being common matches with other files. Files 1 and 2 both had roughly half (53% and 54% respectively) of their matches found by all other files, with many of their matches found by only two or three other vendors.
How matches are made
The matching process uses information such as the respondent’s name, address, gender and date of birth – whether from a list or collected during the survey – to identify the respondent’s voter file record. Sometimes this process is straightforward, when a respondent’s name, address and date of birth match perfectly to the voter file. Unfortunately, this isn’t always the case. If the state voter list doesn’t report birthdays, or if a respondent is registered under a different name or at a different address, a successful match may not occur.
When a perfect match can’t be found, multiple possible matches must be considered, and the best match is chosen from among these. The process used by many vendors typically consists of two steps. The first step searches vast numbers of records to find potential matches, while the second chooses which among the plausible matches is best. At the first stage, the vendor’s matching software tries to identify all of the records that might be good matches to the respondent. Because the software has to sift through hundreds of millions of voter file records to identify these matches, computational shortcuts are used to locate plausible matches without burdening the software with assessing exactly which record will be the best match.
To give a concrete example, suppose that, at the time of this data collection, Vice President Joe Biden had been a part of our study. We would have asked the vendor to find the voter file record of a Joseph Biden, who reported being born in 1942 and residing (at the time) at 1 Observatory Circle, Washington, D.C., the official vice presidential residence. The software would set out to find all of the voter file records that could possibly refer to our respondent. People named Joe Biden or Joseph Biden, or having similar names like Jose Biden or Joe Widen, other 1 Observatory Circle residents and Bidens born in 1942 would all arise as possible matches. Once the full set of possible matches is generated by the first stage, the second stage begins. The software assigns all of the possible matches a score expressing the voter file record’s similarity to the respondent’s matching data. An exact name match would be assigned a higher score than approximate name matches like Jose Biden or Joe Widen. Similarly, matches that share a full birthdate or address would be assigned higher scores, while matches that merely live in the same city or that are the same age but have incomplete or nonmatching birthdates would receive lower scores. After all of these matching scores are generated, a best match is chosen.
Typically, the best match is simply the voter file record that mostly matches the information volunteered by the respondent. But other considerations can lead researchers to prefer a more imperfect match. Suppose we were left to choose between two records: a registered voter, Joseph Biden, with a listed home address in Wilmington, Delaware or a Joseph Biden, living at 1 Observatory Circle in Washington, D.C. but with no record of being registered to vote at that address. The Washington record is obviously the closer match, as it matches the address the respondent gave. On the other hand, if both records refer to the same Joseph Biden, then we may be more interested in the Delaware record, as the registered voter record will include information about his registration status, length of registration, vote history and political party. Ascertaining which of these two matches is preferred is partly a matter of making a trade-off between match confidence (the confidence we have that the record refers to the respondent) and the match’s usefulness (the amount of useful and relevant data conveyed by the voter file record).
When researchers have to match survey data to the voter file, they face the choice of doing the matching themselves. They can either take the whole voter file (or large portions of it) and write computer code to find the records that best correspond to the survey respondent, or they can opt to have a voter file vendor do it for them. Having a vendor do the matching is appealing, since it requires less work from the researcher and it can even be less expensive, since it means purchasing less data from a voter file vendor, but it comes at the cost of having less control over the matching process. When contracting out the matching process to a vendor, researchers typically never see the rejected matches, making it difficult to assess whether better matches were erroneously rejected by the vendor.
On the other hand, vendors have more experience matching and can usually devote more computational and software engineering resources to the problem than researchers can. Even if the methods are proprietary and not especially transparent, they could be a preferable option if their performance is superior.
Biases in the match
 Failures to match do not occur randomly. Rather, certain kinds of people are less likely to be successfully matched. These individuals also tend to be different politically than those who are easier to match. This can lead to biases in conclusions drawn from data with matched voter file information. Panelists who are registered to vote and say they participate regularly in elections are more likely to be matched, leaving the politically disengaged underrepresented in voter files. This is to be expected, as registered voter lists in the states make up the bedrock of voter files.
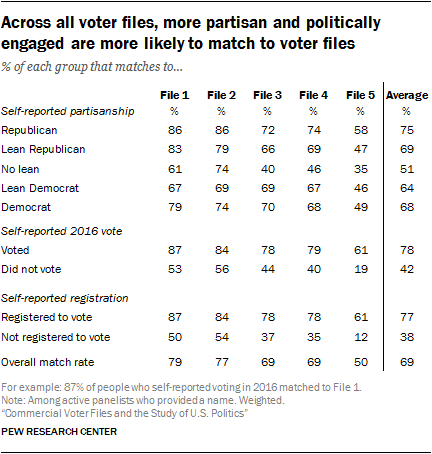
In particular, Files 1 and 2 match more of those who are not politically active and engaged than the other vendors. Just 19% of those who said they didn’t vote in 2016 were matched to File 5. By comparison, 56% of 2016 nonvoters matched to File 2 and 53% were matched by File 1. A similar pattern emerges with voter registration. While File 2 matches 54% of those who say they’re not registered to vote, File 4 matches only about one-third (35%) of that group to their file, and File 5 – with the lowest overall match rate – matched only 12%.
A similar pattern appears with respect to party affiliation. Files with higher match rates, such as File 1, were able to match eight-in-ten or more of those who identify with a party to their file (86% of Republicans and 79% of Democrats), while 61% of those who do not lean toward either party were matched. While Republicans have a slightly higher match rate in several files, the partisan differences are modest.
 Differences in the match rates for different subgroups naturally have an impact on the demographic and political composition of those matched. While all files have a political engagement bias in terms of who is matched, those biases increase as match rates decrease. In other words, as vendors become stricter in terms of who they consider a match, the sample of people who are matched looks increasingly politically engaged. For example, 75% of American Trends Panel members say they voted in the 2016 election. Among those matched to File 1, the file with the highest match rate, 83% report having voted in 2016. Among those matched to File 5, the file with the lowest match rate, 90% report having voted.
Interestingly, these differences are not present when it comes to partisanship. While the partisan composition of the panelists matched to each of the five files is slightly more Republican than the panel overall, differences among the files are minor or negligible.
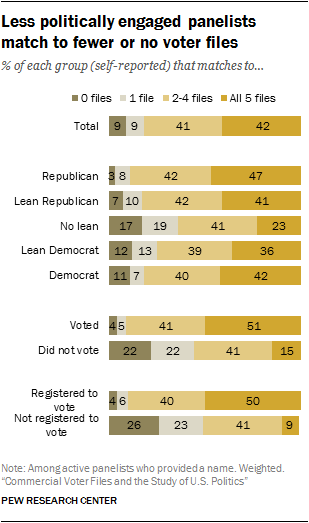
A consequence of these differences in match rates by partisanship and political engagement is that panelists who are registered to vote and regularly participate in elections are more likely to be matched to multiple files, while those who do not participate tend to be found on fewer (or no) files. Nearly two-in-ten who self-report not leaning toward either party (17%) are not able to be matched to any of the five voter files compared with just 3% of those who identify as Republican. Democrats and independents who lean Democratic are also slightly less likely to match: 11% of Democrats and 12% of Democratic leaners were not matched to any files.
 By the same token, those who identify with either of the parties are far more likely to be found in many, if not all, of the voter files in this study – a reasonable proxy for being easy to find. While just 23% of those who do not lean toward either party were found in all five files, more than four-in-ten Republican identifiers (47%) and Democratic identifiers (42%) were found on all five files. Those who lean toward either party, regardless of partisanship, were a little less likely to match across the files: Only 41% of Republican leaners and 36% of Democratic leaners matched to all five files.
An even more dramatic pattern can be seen with political participation. Half (51%) of those who reported voting in the 2016 election matched to all five voter files, compared with just 15% of those who said they did not vote. More than four-in-ten (44%) of those who said they didn’t vote were found in just one or no voter files, vs. 9% of those who said they voted. Among panelists who report not being registered to vote, 26% are not found on any voter files and another 23% match to only one file. Just 9% match to all five voter files.
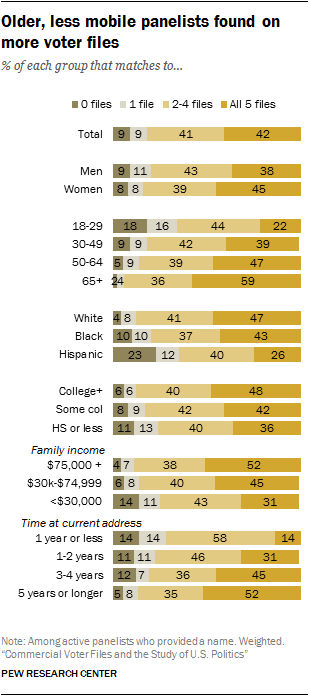
Beyond the impact of political engagement, certain demographic characteristics are strongly associated with propensity to match. Voter files tend to do a better job of matching older, white, less mobile panelists while younger, more diverse and more mobile panelists end up with fewer or no matches. And, of course, these demographic characteristics are related to both partisanship and likelihood of participating in politics.
Age and mobility are particularly strongly associated with matching. Across all of the vendors, there is a roughly 30-point difference in the rate of matches between people ages 18-29 and those 65 and older. Similarly, people who have lived at their current address for less than one year are considerably less likely to be matched than those who have resided at their address for at least five years.
As a consequence of these patterns, the demographic profile of those matched differs somewhat across the vendors. File 5, with the lowest match rate, has the smallest share of panelists ages 18-29 (13% vs. at least 16% for the other files). And two-thirds of File 5’s panelists have lived at their current residence for at least five years, compared with 58% to 59% for the other vendors.
The demographic differences in propensity to match also mean that more than one-in-six younger panelists (18% of those ages 18-29) are not matched to any of the five files and an additional 16% were found on just one file. Only 22% of younger panelists were found in all five files. By comparison, 59% of older panelists (ages 65 and older) were found on all five files, and just 2% were not found on any of the files. Similarly, 52% of those who have lived at their current address for five or more years matched to all five files and just 5% could not be located in any file. Just 14% of those with less than one-year tenure at their current address were located by all five files.
Hispanics match at lower rates than other racial or ethnic groups. Nearly a quarter (23%) are not matched to any files. Only 26% of Hispanics were matched by all five files, while nearly half (47%) of whites were found by all five. Blacks fall somewhere in between. Roughly four-in-ten blacks (43%) were found on all five files, while 10% were not matched to any files.
While there are differences in propensity to match by educational attainment, they are comparatively minor. Half (48%) of panelists who report having at least a bachelor’s degree were matched to all five files, compared with 36% of those who reported having a high school diploma or less. Panelists at all education levels are roughly equally likely to not be matched to any file.
How well do the voter files cover the unregistered?
When voter files first came to prominence for practitioners and researchers, many were just what the name suggests – lists of registered voters. However, as research and targeting using the voter files has become more widespread, most vendors try to provide coverage of all U.S. adults, including those not registered to vote, in their files. Because the core component of the files is a combination of official state lists of registered voters, vendors have sought out commercial databases – available from sources such as credit rating agencies – to locate Americans missing from state voter rolls.
How well the files cover the unregistered population is potentially an important consideration for those who wish to use the files to locate and attempt to persuade the unregistered to register. Coverage of the unregistered is also important if the file is to be used for describing or conducting surveys of the general public and not just voters. To date, pollsters have used the files as a source for sampling the registered voter population, but files that make an effort to cover the full population could theoretically have utility as sampling sources for the general public. To the extent that they accurately represent the non-registered population, such files provide the researcher with the opportunity to use information in the files to guide the sampling. For example, the non-registered and registered voters with lower turnout propensities could be oversampled for research aimed at understanding the less engaged.
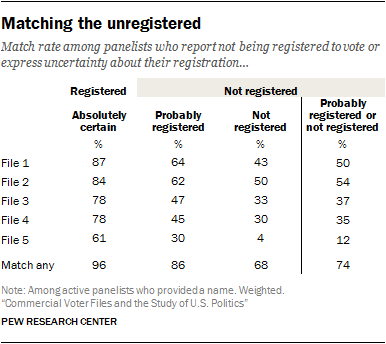
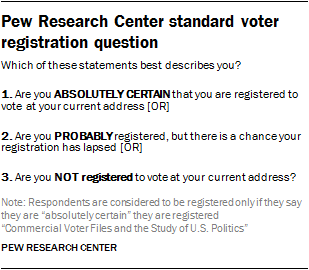 To assess how well the files cover the unregistered, the match rates and composition of the matched cases was compared for panelists who report being registered to vote and for those who say they are not registered or are not sure if they are registered. In Pew Research Center surveys, respondents are considered unregistered if they report not being registered or express uncertainty about their registration. Among members of the American Trends Panel, those considered unregistered are much less likely to have been matched by the files. As noted in the previous chapter on the matching process, the match rates for the self-reported unregistered varied from a low of 12% to a high of 54%, depending on the vendor. Not surprisingly, panelists who were certain about their lack of registration had the lowest rates, ranging from 4% to 50% matched, with those who said they were probably registered but not certain falling between the certainly registered and the certainly unregistered.
The files collectively found far more of the unregistered than did any single file by itself. Two-thirds of those who were certain that they were not registered were located by at least one of the files, while 86% of those who said they were probably registered were matched. More than nine-in-ten (96%) of the certainly registered group were found in at least one file. But differences in match rates across the files were much greater for people in the two unregistered categories than for those who were certain they are registered.
 The collective results of the five files provide evidence that the unregistered are not completely invisible to commercial files of the sort examined in this study. This is reinforced when comparing the demographic and political profiles of the registered and the unregistered.
As a group, the matched unregistered are similar to all unregistered, perhaps somewhat unsurprisingly since they constitute about three-quarters of the latter group. One difference that stands out is that the matched unregistered are significantly more likely to identify as Republican or Republican-leaning than are all unregistered panelists (and twice as likely to be Republican as the unmatched unregistered). This anomaly is evident in the collective group (matched to any file), as well as in each of the individual voter files. Research suggests it could be linked to the fact that those who are matched and unregistered tend to be wealthier than the unmatched.
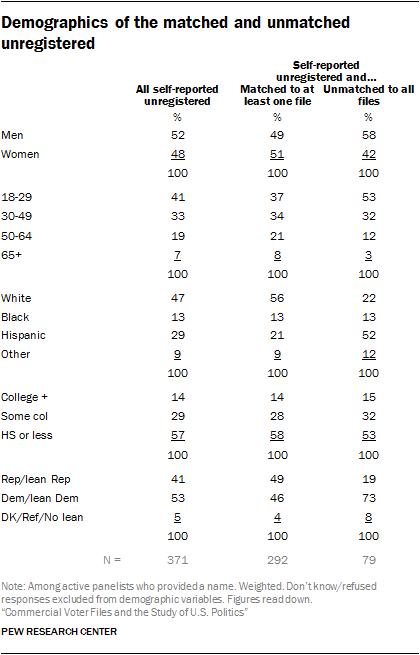 Although the files collectively cover a sizable share of the unregistered, the unregistered population who are unmatched to any of the files are quite different with respect to age, race and partisanship. Just over half (53%) of the unmatched unregistered are younger than 30, compared with 37% among those matched to at least one file (and 21% among all adults). Half of the unmatched unregistered (52%) identify as Hispanic, compared with just 21% among the matched cases. And just two-in-ten (19%) of the unmatched unregistered identify as Republican or Republican-leaning, compared with 41% of all unregistered.
Collectively, these results show that, especially within a group known to be harder to match (the unregistered), there are demographic biases in the unmatched. These biases largely echo what we see in matching among the general public.
Political data in voter files
Among the most important data on the voter files for the election analyst are the records for whether or not someone is registered to vote and whether they voted in a given election. These individual registration and turnout records come directly from records kept by each state for every election. The turnout record indicates whether or not someone voted in a given election, though it does not provide their chosen candidate or party. The registration record may include which political party the individual is registered with (in states where voters can register by party). When combined with other data in the voter file, it is possible to create a rich picture of who is registered and who showed up to vote in previous elections.
In addition, while an individual’s vote history is readily available through the official voter records in all 50 states and the District of Columbia, commercial voter files typically offer scores for things like partisanship and expected turnout for future elections generated through predictive models. This chapter will explore the availability and accuracy of political data on voter files, both raw and modeled.
Vote history is largely consistent across the files
 Election analysts greatly value the availability of turnout records for past elections. Being able to document turnout in different types of elections (e.g., presidential years and off-years) enables researchers to better understand how voters differ in motivation and resources to participate. It is, of course, possible to ask survey respondents about voting in past elections. But pollsters recognize that memories about events that occurred two or four years ago (or longer) are potentially faulty, especially for respondents who are not especially interested in politics. Thus, having accurate turnout records for individuals is an important asset of the commercial voter files. Even with direct access to state voter files, a researcher may not be able to document an individual’s past voting behavior if they have changed their state of residence during the period of interest.
One important caveat to consider with vote history is that, while the presence of a record of voting almost certainly means that a person voted in that election, the absence of a record doesn’t mean they definitely did not vote. The lack of a record could indicate that someone did not vote, that the matched data has missed one or more election records for an individual or even that the match is to the wrong person. Even when the match is to the correct person, the voter record attached to that person in the commercial file may be out of date or otherwise incorrect.
The situation is even more ambiguous for individuals who are not matched to a voter file. Since voter files are built on a base of official state records and subsequently expanded with non-official commercial records, the absence of a match may indicate that the individual does not have a state registration or voter record where he or she currently lives. This could imply that he or she is not registered and therefore probably did not vote in recent elections. But this cannot be said for sure, since failures to match can occur even when a state record exists (for reasons discussed earlier).
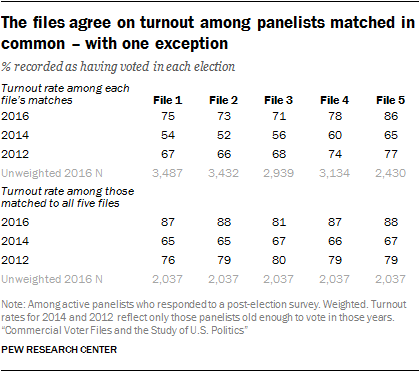
In assessing turnout for the 2016 presidential election, there tends to be a fairly high degree of agreement among the files on an individual’s vote history. This is likely because all the vendors draw from the same state voter files as raw source material. This is especially the case for four of the five files, which produce relatively similar turnout rates. Estimates in File 1 through File 4 range from a low of 71% who are listed as having voted in 2016 to a high of 78%. However, File 5 exists as an outlier. As the file with the lowest match rate, File 5 produces the highest estimate for turnout in 2016, at 86%. While these turnout rates are in line with self-reported turnout on the American Trends Panel, the turnout rates here are considerably higher than the known turnout rate in each election. However, as noted in Chapter 2, politically engaged respondents are more likely than less engaged respondents to be matched to the voter files. This leads to higher estimates for turnout in each election.
To eliminate the variation in turnout rates produced by differences in match rates across vendors, the turnout rates were computed for the roughly four-in-ten (42%) panelists who were matched by all five files. Among these panelists, 85% have identical turnout records across the five files (75% are recorded as having voted in all five and 10% have no record of a vote in all five). At the aggregate level, turnout was 87% to 88% in four of the five files, but is 7 points lower in File 3 (81% turnout). The reason for this exception is unclear.
As with turnout in 2016, the vendors vary somewhat in their rates of voting for 2012 and 2014. However, when restricting to the common set of matches between all five vendors, most of the variability is eliminated (as it was for 2016): Turnout estimates for 2014 vary between 65% and 67%, and for 2012, between 76% and 80%. In this analysis, File 3 does not stand out as exceptional, as it did with the 2016 vote.8
The fact that turnout rates for 2012 are considerably lower than for 2016 illustrates the difficulty of accurately tracking voting records over time, even for organizations that have made it a very high priority to do so. The actual turnout rate among voting-eligible adults for 2016 is estimated at 60%, while the 2012 rate is just 1 point lower (59%). And yet, the 2016 turnout rate for the panelists exceeded the 2012 rate by margins of 3 to 9 points across the five files. It is clear that vote histories get lost as people move or change names, despite the best efforts of vendors to build a complete history for those in its files.
Survey error in reported turnout
One of the most common challenges facing survey research about elections is the tendency for some people to say they voted when they did not. This phenomenon has received extensive academic attention, and much of the research has relied upon surveys matched with validated voter turnout data. For many people, voting is a socially desirable behavior because it conforms to traditional notions of civic duty. Accordingly, there may be pressure for people to claim they voted even when they did not. Previous research has documented that the incidence of misreporting turnout is higher among people who value political participation and, as a group, may already have higher rates of turnout. Voter files have greatly aided researchers’ understanding of error in the measurement of voter turnout.
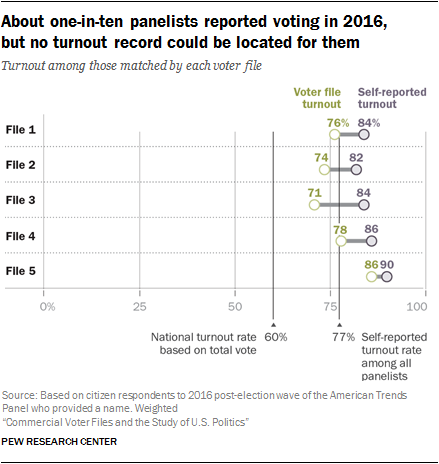 As expected, the rate of self-reported turnout in 2016 exceeded the voter file estimates among matched panelists in all five voter files. The overestimate of turnout ranged from 4 percentage points in File 5 to 13 points in File 3.
Yet unlike most studies that have examined overreporting of voting, which typically use a single source of voter validation, Pew Research Center has five sources for evidence of turnout and thus can be more confident that failures to match or errors in record-keeping by a single source might lead to erroneous conclusions about an individual’s turnout. If researchers are confident of the accuracy of the matches for an individual, a record in one file that they voted is strong evidence even if other files provide no record of voting.
Panelists were interviewed shortly after the 2016 election about their participation in the election and asked whether and for whom they voted. The self-reported turnout rate among panelists (restricted to citizens) was 77% (weighted) – 17 percentage points higher than the estimated turnout rate among the entire voting-eligible population.
This overestimate of turnout is likely a consequence of three different factors. One is (as discussed above) misreporting by respondents, driven by the desire to appear more engaged or perhaps by a respondent’s impression of one’s self as a dutiful citizen who usually votes. Another is that the survey’s sample includes people who are more politically engaged than the typical American. The third is that being surveyed, and especially being in a panel with regular surveys, might stimulate a respondent’s interest in politics and potentially motivate them to vote. Warren Miller, a renowned political scientist who was a coauthor of the seminal research on elections, “The American Voter,” once said that the American National Election Study was “the most expensive voter mobilization project in American history” because it appeared to have motivated many of its respondents to vote when they might otherwise have not done so.
The voter files provide excellent evidence about the first of these explanations – misreporting by respondents. Self-reports of turnout can be compared with the verified record of voting to estimate the extent of overreporting and the characteristics of those who overreport. To do this, researchers used a composite estimate of turnout based on records in all five files. If any file included a record of turnout for the panelist, it was assumed that the panelist voted, even if other files did not find a voter record. If a matched panelist had no record of voting in any file, that person was considered a nonvoter. But because there were five vendors looking for panelists, researchers made the additional assumption that unmatched panelists were also nonvoters. The validity of this assumption depends on the accuracy of the matches. Consequently, before implementing this step, researchers evaluated the quality of the matches by comparing the name and address of each panelist with the name and address on the voter file record that matched to it. Matches judged to be possibly incorrect because of inconsistencies in the name or address were considered unmatched for purposes of this analysis.9
To review, if any file included a record of turnout for the panelist, it was assumed that the panelist voted, even if other files did not find a voter record. All other panelists were considered to be nonvoters. This is based on the fairly strong assumption that panelists who could not be located and verified as a voter in any official voter file by five different commercial vendors can be assumed to have not voted.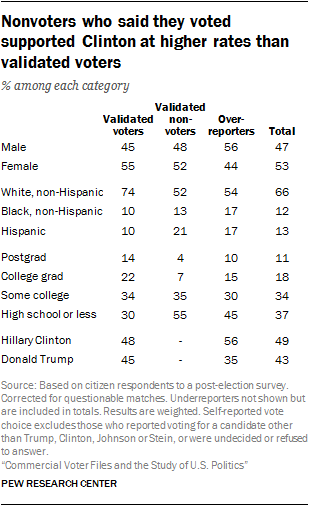
Using this approach, the voter file verified turnout rate among the panelists was 65%, 5 percentage points higher than the best estimate of national turnout among eligible adults. One percent among the 65% are panelists who said they didn’t vote but have a record of doing so. This small group of fewer than 20 individuals may have accidentally selected the wrong option on the survey, or there could be an error in the official turnout record. About one-in-five panelists (22%) are validated nonvoters (respondents who said they didn’t vote and for whom no record of voting exists).
The remaining group consists of the overreporters. These are the 12% of all voting-eligible adults (citizens who are 18 years of age or older) who said they voted but for whom no record can be located across five voter files. Demographically, these individuals are more male than female (56%-44%), disproportionately black and Hispanic (17% each, compared with about 10% each among validated voters), much more Democratic than Republican in party affiliation and more supportive of Hillary Clinton than Donald Trump (56% Clinton, 35% Trump vs. 48% to 45% among verified voters). They are much more likely than validated nonvoters to say they “always” vote (44% vs. 5%) and that they follow what’s going on in government and politics most of the time (36% vs. 13%).10
Having a validated measure of who voted and who did not makes it possible to assemble a more authoritative portrait of the electorate in 2016. As post-election analysis has demonstrated, the composition of the 2016 electorate is important in understanding Donald Trump’s 2016 election victory, and – more broadly – what kinds of changes may be occurring in the U.S. political system.
Analysts have generally relied upon three main sources of data on who votes. One is the National Election Pool’s (NEP) exit poll, which provides estimates of the voting patterns among different groups in the population. Another is the U.S. Census’ Current Population Survey (CPS) supplement on voter registration and turnout, conducted shortly after the general election. A third is the set of independent surveys such as the American Trends Panel and the American National Election Study.
The NEP’s exit poll has been criticized for overrepresenting younger, college educated individuals and minorities. The CPS survey finds an electorate that is less educated and more likely to be white, as do many independent surveys.
The American Trends Panelists who self-identify as having voted in 2016 looks very much like the CPS electorate, especially with respect to the critical category of non-college whites. The ATP sample of self-reported voters is 43% non-college white, about the same as in the CPS survey, and just 34% in the exit poll. But the ATP self-reported voters supported Hillary Clinton by a six point margin, 49% to 43%. Restricting the sample to those who are validated as having voted in at least one of the voter files does not change the composition of the sample very much (though the share of white non-Hispanic voters rises from 71% to 74%), but the vote margin now approximates the actual election result, 48% Clinton to 46% Trump.
Using just the matches in each of the voter files produces similar results with respect to the horse race. Compared with reported vote choice among all matched panelists in each file who said they voted, the Clinton advantage over Trump among validated voters in each file was narrower. Clinton’s advantage varies from 2 to 4 points across the five files (versus 3 to 6 points among all self-reported voters matched by in each file).
Self-reported voter registration status is murkier than voter turnout
Compared with voter turnout, voter registration is a much more problematic measurement issue for survey researchers. The fact that voter registration is a status rather than an activity means it is something that can be difficult to remember accurately. For one, the typical person registers to vote much less often than they turn out to vote. For people who vote rarely or never, their registration is largely an abstraction – an administrative status maintained by their state’s election authority without input from the individual. If someone registered to vote nine years ago but hasn’t voted in five, are they still registered to vote? Without a call to the local election office, it would be hard for them to know.
In addition, there are a number of different ways states handle their voter registration databases. For example, states periodically clean voter registration data, either because someone is believed to have moved or they have not voted over a period of time. So if a voter stays at the same address for many years and is able to maintain their registration, either through periodic voting or because their state allows registrants to remain on the file without voting or confirming their continued residence, their most recent act of registration is long in their past. This adds a source of error for voters answering questions about their registration in that they may simply not know with certainty if they are registered.
The abstraction of voter registration in a survey respondent’s mind, however, does not mean that his or her voter registration cannot be validated. If a state voter file contains a record of the respondent at their current address, then the respondent is definitely registered to vote. After all, the state voter file is the authoritative source of data used on Election Day to check in voters.
Ambiguities occur when a voter claims to be registered but no record matching their current address can be found on the voter file. The lack of a matching record is not proof that the person is not registered. In some localities, voters who have moved can vote as long as they haven’t changed voting districts. Others may choose to vote in their old precinct, using the registration attached to their previous address. College students are able to vote in some states where they attend school, but that may not reflect their permanent address.
Another possibility for why voters who report being registered do not have a corresponding record is that the respondent was not able to be matched to the commercial voter file at all. This could be due either to errors on the voter file or in the personally identifying data provided by the respondent, preventing an otherwise valid registration from being found. In light of these possibilities, care should be taken when assessing the registration status of seemingly unregistered respondents.
Survey error in reported registration
The problematic nature of measuring voter registration is evident in the mismatch between the voter file data and responses from the American Trends Panel participants. Panelists are asked periodically about their registration status using the three-category question described earlier in the report. Survey responses about registration were compared with registration status from the voter files. For the purpose of this analysis, due to the complicated nature of voter registration as discussed above, survey respondents with possibly incorrect matches were flagged as unregistered, unless a valid registration record was located on at least one other file.
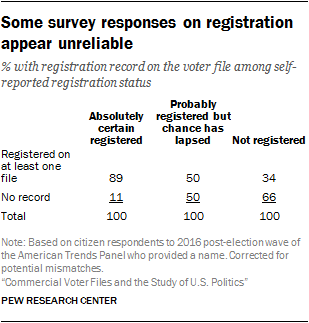 A registration record was located on at least one matched voter file for 89% of panelists who expressed certainty that they are registered. Half (50%) of those who were uncertain about their status (and who are considered unregistered in our normal survey protocol) had a registration record on at least one file. Even 34% of those who said that they are not registered had a registration record on at least one of the files.
Because some official registration records themselves may be out of date, the survey measure may not be as problematic as it appears here. For example, someone who has moved may have a valid registration record at a previous address – perhaps the source of the voter file match – but be unsure as to whether they are registered at their current address. But it is clear that registration status is a murkier concept to capture in a survey.
Modeled partisanship is correct for a majority of cases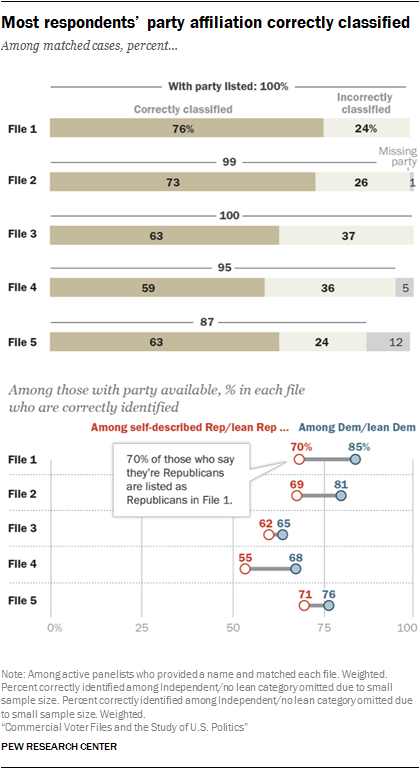
There are traditionally two types of partisanship classifications available in voter files. The first is party registration. However, since this is not available in all states, voter file vendors attempt to model partisanship based on demographics, voter turnout and other factors. While each of these models is different, four vendors provided a modeled score that ranges from 0 to 100, where 0 is most Republican and 100 is most Democratic. One vendor, however, simply categorized panelists by party.
In all, files that provided a modeled 0 to 100 score did a better job of correctly classifying the partisan affiliation of panelists against their self-reported partisanship. In particular, Files 1 and 2 performed relatively well at correctly classifying voters (76% and 73% correctly classified respectively). File 4 had the lowest share of panelists correctly classified (59%), due in part to a higher than average share classified as independent in this model. Two-in-ten American Trends Panel members (20%) matched to File 4 are classified as politically independent, compared with just 3% who self-identify as not leaning towards either party.
In general, all of the files were able to identify Democrats at a higher rate than Republicans. But three vendors stood out in this regard. File 1 correctly identified 85% of Democrats and 70% of Republicans, while File 2 correctly identified 81% of Democrats and 69% of Republicans. And while File 4 had lower rates of accurate identification overall, it, too, was better able to identify Democrats (68% correctly identified) than Republicans (55% correct). The fact that a large majority of blacks identify as or lean Democratic contributes to the higher accuracy rate for Democrats than Republicans.
Modeled turnout scores improve the accuracy of election estimates
Predicted voter turnout is one of the most commonly available and widely used modeled measures. Vendors attempt to model each person’s likelihood of voting in a given election – be it primary, midterm or presidential. Pollsters use this information in building likely voter models, and campaigns use it to allocate resources for mobilization or persuasion. While turnout models are based on voter turnout in previous elections, some also include demographic information and partisanship in the model in an attempt to more accurately predict likely voting behavior.
Modeled turnout scores are typically treated as probabilities and are offered on a 0 to 100 scale, with 0 being the least likely to turn out to vote in a given election and 100 being the most likely to vote. (File 3 did not provide a turnout probability.) Each vendor has its own “secret sauce” that goes into their model. As a result, while all of the models follow a similar 0 to 100 scale, each scale has a different mean and distribution.
To assess the accuracy of the turnout predictions for the 2016 general election, panelists matched by each vendor were sorted by their predicted likelihood of voting into four groups of equal size, referred to here as quartiles. Within each quartile, the average turnout score – the mean of the predicted probabilities for that group – can be compared with the percentage of the group that actually voted. If the predictions are perfectly accurate, the mean of the predicted probabilities and the percentage who voted will be about the same.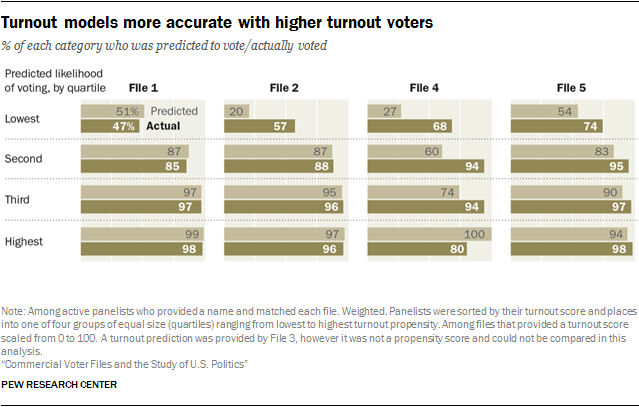
The vendors varied somewhat in the accuracy of their turnout predictions. For three of the four, predictions about turnout among the quarter of the sample rated least likely to vote tended to underestimate the true turnout rate. For example, the average predicted probability of turning out for the lowest quartile in File 4 was just 27%, but among this group 68% actually voted. Two other files (File 2 and File 5) also underestimated actual turnout in the lowest quartile. By contrast, the average predicted turnout for the lowest quartile in File 1 was 51%, and the actual turnout was nearly the same, at 47%.11
Most of the vendors did better with their predictions among voters judged as highly likely to vote, though one of them (File 4) substantially overestimated the share in the highest quartile who would vote.
 Since these scores can be used to predict who will turn out to vote, they can also be judged by how well they modeled the outcome of the election among those who did vote. Using a technique similar to that employed by pollsters to create a “likely electorate” among respondents to a pre-election survey, panelists who responded to a post-election survey were weighted by their pre-election likelihood of turning out to vote in 2016 (along with the usual survey weighting on demographic and related characteristics).
While self-reported voters in the panel as a group gave Clinton a 7-point advantage (50% for Clinton vs. 43% for Trump), weighting the results by the expected turnout scores from each file produced a result closer to the actual election outcome, which was a 2-point Clinton advantage in the national vote. All the files came close to the actual vote, showing either a 3- or a 4-point Clinton advantage.
Demographic data
As use of commercial voter lists by campaigns and public opinion researchers has grown, data offerings provided by voter file vendors have expanded. On top of standard political offerings, many vendors now provide a host of additional demographic and lifestyle data generated through predictive models or gathered from other sources. This chapter compares demographic data in the voter files with self-reports from panelists.
Predictive models leverage data from a mix of third-party commercial vendors and survey data to try to predict a number of characteristics, ranging from a person’s race to educational attainment. However, for some modeled variables, much of the underlying information is available only in a portion of states. For example, vendors rely on a mix of information from voter records and additional data to predict an individual’s race or ethnicity. In 16 states or portions of states, largely in the South, the Voting Rights Act of 1965 mandated that states list voters’ race on the state voter rolls. However, in states where this information is not available, vendors attempt to use information from other sources such as identifying common surnames or if someone lives in an area that is densely populated by a particular race.
In addition to state voter records and commercial data, some voter file vendors use survey data to enhance and build their models. Partisan vendors, in particular, often feed survey data from partner organizations into the models to improve their accuracy.
Race and ethnicity are generally well measured in the files
 Given the central importance of race and ethnicity in American politics, voter file vendors attempt to identify the race of the individuals in the file. Vendors may use race as recorded on state voter records in places where the states are required to collect it. In other locations, race may be modeled using information like surname or geographic concentration.
The modeled race and ethnicity of panelists was compared with how panelists described it when they were recruited to the panel (or in subsequent profile surveys). Overall, most vendors are able to accurately identify the race of white respondents, with rates of correct identification varying between 81% for File 3 to 97% for File 2. However, when it comes to accurately identifying the race of self-reported black and Hispanic panelists, some vendors are more accurate than others.
Among panelists who self-report being black in a survey measure, roughly three-quarters in Files 2 and 5 (74% in File 5 and 76% in File 2) are correctly classified as black by the respective models. However, the model in File 1 identifies far fewer black panelists accurately (56%).
In classifying self-reported Hispanic panelists, there is less of a difference across the files, ranging from a low of 64% of Hispanics correctly classified in File 3 to 75% in Files 1 and 5.
Overall, the rate of correct classification by race ranges from 74% for File 3 to 85% for File 2.
Other demographic variables vary greatly in accuracy
In addition to information provided by state voter rolls, many voter file vendors include information from other public and commercial data sources. This data could originate from a variety of sources, such as from magazine subscriptions or credit bureaus, with the goal of providing additional information about Americans beyond what is available directly from state voter lists.
The presence of commercial data in voter files is widespread; however, the specific variables available differ by vendor. Many vendors possess financial data from credit bureaus or credit card companies, including things like home price and mortgage amount. In addition, some vendors provide information like occupation, income and the number of adults or children in a household. The presence of hunting or fishing licenses is one of the most ubiquitous commercial variables.
This commercial data also presents itself in several ways. Some of these variables stand alone as flags, such as the presence of a hunting license, while others are included in models to predict particular outcomes or demographics. For example, several vendors provide models for personal interests like being a gun owner or a boating enthusiast – information that is modeled based on sources such as magazine subscriptions.
An analysis of three of the more commonly available commercial variables – education, income and religious affiliation – shows that some models are more accurate than others. Overall, most vendors had a higher rate of accuracy in predicting education than income. When it comes to religious affiliation, vendors for the most part correctly predict large religions in the U.S. such as Protestantism but have less success with lower incidence religions like Buddhism.
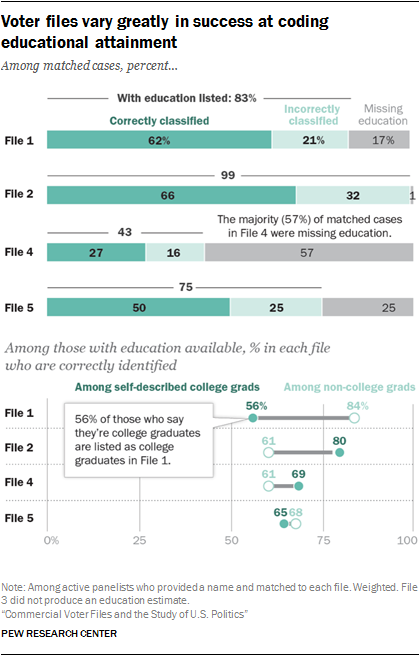 One common issue across many of the models is the preponderance of missing data, with large portions of matches listed as unclassified on some variables. For example, in assessing models produced to predict educational attainment, more than half (57%) of matches in File 4 and one-quarter (25%) of matches to File 5 are listed as unclassified.
However, when those missing an estimate for education are excluded, many of the models have a reasonably high rate of correctly classifying panelists with their self-reported education status. Fully six-in-ten or more college graduates are correctly classified as having graduated in college in Files 1, 4 and 5.12
 Household income may be the most difficult of the demographic variables to assess. The accuracy of survey measurements of income can be affected by many factors, including a respondent’s lack of knowledge (respondents are typically asked to recall total household income from a previous year). Additionally, income is a sensitive topic, and survey respondents are more likely to decline to provide their income than with other demographic variables. It is perhaps unsurprising that modeled income in the files – even where provided – does not match survey reports of income very closely. Overall, the four files that provided an estimated income corrected placed only 30% to 46% respondents into one of four categories.
The files had trouble classifying both high- and low-income respondents. Four-in-ten or more who self-report having an income of $100,000 or more are correctly classified by File 4 (41% correctly classified) and File 5 (45%). And roughly one-third of the self-reported lowest-income adults (under $30,000 annually) are correctly classified by each of the four files that reported income.
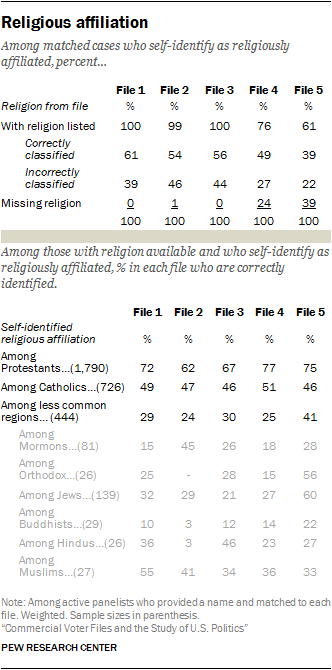 Models used to predict religious affiliation vary considerably in the rates of correctly classified panelists. To be sure, all models do best at accurately predicting Protestants, the largest religious group in the United States. In Files 1, 4 and 5, about three-quarters (72%, 77% and 75% respectively) of self-identified Protestants are correctly classified. File 2 correctly classifies roughly six-in-ten (62%) of Protestants. (As a baseline, slightly less than half of Americans currently identify as Protestant.)
Within the smaller religious groups in the U.S., some are more likely to be correctly modeled than others. For example, most of the files do a better job of correctly classifying Hindus than of classifying Buddhists, even though both groups are roughly equally rare in the U.S.
The files do not attempt to categorize people who are unaffiliated with a religion, but their residual category of “unclassified” provides evidence that some individuals are not religiously identified. Overall, the unclassified group varies from 5% to 21% across the files. But these unclassified individuals are not necessarily the religiously unaffiliated – just 28% of those who are unclassified in File 1 are people who identify in the panel as atheist, agnostic or “nothing in particular,” and this rises to 36% among those File 2. Given that nearly one-quarter of adults are religiously unaffiliated, the residual category of “uncategorized” does not do a particularly good job of finding them.
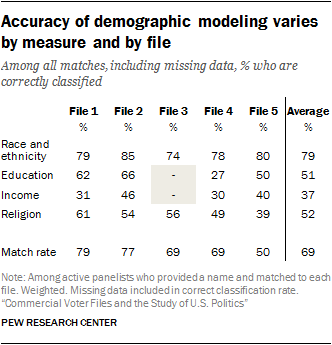 The total percent who are correctly classified, including those who are missing or unclassified for a given variable, provides a comparison among various modeled demographics. Many of the files were able to correctly classify a high share of panelists to their self-reported religion. Still, several files stood out, particularly the file with the lowest match rate (File 5), for being able to correctly classify sizeable shares of respondents’ education and income.
Voter files in action
Commercial voter files have been used in a wide variety of ways, either by themselves or in conjunction with other data. Although such files have been employed by political campaigns for many years, their use by journalists and others interested in elections has increased recently as familiarity with the files has grown and the ancillary data available on the files has expanded.
Perhaps the most widespread use of the voter files is to help political practitioners more effectively and efficiently engage with potential voters. Political campaigns make use of the files to identify potential supporters and to communicate with them, either to influence their candidate choice, mobilize them to turn out to vote, or both. Groups organized around specific issues such as gun rights or access to abortion use the files in similar ways.
Pollsters increasingly use voter files to draw samples for their surveys. Voter files have long been used for sampling by pollsters working for political campaigns, but their use is growing among public and media pollsters as well, as evidenced in the November 2017 statewide elections in Virginia, where a majority of publicly released polls relied on voter file samples. Sampling from voter files is a more efficient way of reaching likely voters than other sampling methods such as random-digit dialing (RDD), though the fact that phone numbers are not available for everyone on the voter file can introduce errors. And information about past voting available on the files is useful in helping pollsters make more accurate predictions about who is likely to turn out in an upcoming election. Although the files have not been widely used as sampling sources for general public surveys, it is possible that they could be in the future if coverage of the unregistered population improves.
A third use of voter files is by journalists, academics and other election analysts who employ the files to answer specific questions about voters and elections. These include the demographic composition of the electorate, what kinds of voters tend to vote early or by absentee ballot, who votes in primary elections and what kinds of people are habitual vs. episodic voters. This chapter takes a closer look at several of these applications of voter files for improving our understanding of political attitudes and behaviors.
Voter files as sampling frames for surveys and experiments
Political campaigns have long used voter files as sampling frames for their election-related polling, but public pollsters have recently begun to adopt them as well. Of the nine pollsters that released surveys conducted in the final nine days before the 2017 Virginia gubernatorial election and made their sample source public, seven used a voter file and only two used RDD.
Voter files were also the predominant source of telephone samples for state-level public polling in the 2016 presidential election. The Ad Hoc Committee on 2016 Election Polling, created by the American Association for Public Opinion Research (AAPOR), compiled a database of 206 statewide pre-election polls completed within the last 13 days before the election. The source of the sample (whether RDD, voter file or internet) was coded. Of 206 state polls in the database, 62% were based on telephone interviews or a hybrid of telephone and online. Of these phone polls, 80% used a voter file as a sample source.
Voter files are attractive as sources of samples because they provide good coverage of the population of interest (registered voters in the case of election polling) while largely excluding individuals who are not eligible to vote. Since most campaign polling occurs within defined geographies such as a state or a legislative district, voter files make targeting the voters of interest much more efficient than is the case with RDD, especially now that cellphones constitute large shares of the typical RDD sample and cellphone area codes and exchanges are not reliable indicators of where a person actually resides.
Another important benefit of using voter files for sampling is that they contain information about past voting behavior as well as partisan registration or estimates of party affiliation. This information permits a pollster to better target likely voters by including more individuals in the sample who have a proven history of voting in elections similar those of interest to a pollster. Similarly, the inclusion of measures of modeled party identification helps pollsters to draw samples that reflect the population of interest, whether it is all registered voters or those who have a high propensity for voting.
One of the downsides of using voter files for telephone polls is that telephone numbers are not available for everyone on the voter file. Among members of the American Trends Panel matched to the commercial voter files in this study, the percentage of matched cases for which a phone number is available from the vendor varied between 55% and 91%. Older adults are more likely than others to have a phone number on a given file, though the availability of numbers did not vary as much across other demographic variables.
Political scientists and political practitioners alike have made extensive use of voter files for selecting and assigning research subjects in experiments. One recent academic publication describes an ambitious field experiment by David E. Broockman and Daniel M. Butler that enlisted state legislators to help test the impact of different messages in official communications with constituents. Legislators who agreed to cooperate with the study allowed the researchers to vary the issue-related content of mailings to voters in their districts, who were selected from a commercial voter file and randomly assigned to different experimental conditions. Using surveys conducted before and after sending the mailings, the researchers found that “legislators can shape constituents’ views on issues by merely staking out their positions. The constituents who received letters containing legislators’ positions were significantly more likely to subsequently share their legislators’ view.”
Describing the electorate
On June 9, 2016, The New York Times published an analysis by Nate Cohn that argued that “millions more white, older working class voters went to the polls in 2012 than was found by exit polls on Election Day.” This finding led Cohn to a somewhat surprising conclusion about Donald Trump’s electoral prospects, given Hillary Clinton’s consistent lead in national polls at the time: “There’s more room for him to make gains among white working-class voters than many assumed — enough to win without making gains among nonwhite or college-educated white voters.” In fact, Cohn’s analysis described how Trump was able to find a narrow path to victory on the support of non-college white voters in key states.
The New York Times analysis was based on a combination of data from surveys conducted by the U.S. Census and from Catalist, a commercial national voter file. The key datum of interest was the share of voters who were older non-college whites: “Over all, the exit polls suggest that 23 percent of voters in 2012 were white, over age 45 and without a college degree. Catalist puts this group at 29 percent, and the census at 30 percent — implying 10 million more voters than the 23 percent figure.”
According to Cohn, if there were this many additional older, non-college white voters, President Obama must have done better with this group than is generally assumed, especially outside the South. The implication is that these voters were potentially available to Trump, who was making explicit appeals to them. Post-election analysis of polling data by The New York Times suggests that Trump was able to capture enough white 2012 Obama voters to win in the critical states of Wisconsin, Michigan and Pennsylvania.
Identifying the political affiliation of … just about anyone
Commercial voter files can be used to describe political engagement and affiliation among almost any group of individuals, as long as their names and locations are publicly available. Political scientist Eitan Hersh and his colleagues have used voter files to describe the political characteristics of professionals such as physicians, members of the clergy and even married couples. For the clergy study, Hersh and his colleague Gabrielle Malina compiled a database of 186,000 Christian and Jewish clergy from websites of congregations across the U.S., of whom 130,000 could be matched to a commercial voter file. With this linkage, they were able to characterize the partisan composition and voter turnout patterns of clergy in different denominations. With ancillary information on the voter files, they could further describe patterns of political affiliation and engagement among clergy by demographic characteristics. Reform Judaism rabbis were the most Democratic, while pastors in Wisconsin Lutheran congregations were the most Republican.
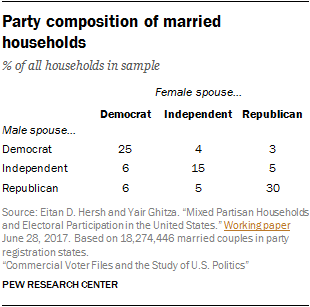 Hersh’s study of married couples (conducted with Yair Ghitza of Catalist, a voter file vendor) found that about one-in-ten households with a married couple included one Democratic and one Republican spouse. Many other households had a Republican or a Democrat married to an independent, and 15% featured two independents. Overall, about 55% had partisans (Democratic or Republican) who were married to someone of the same party. Among other insights in the study was the fact that voter turnout tended to be higher among partisans who were married to someone of the same party than partisans married to an independent or someone of the opposite party.
These kinds of applications come with the standard caveats that apply to all voter file work – matching people to the files is an inexact science, the data on the files are not perfect – but they do provide a perspective on certain populations that would be expensive or perhaps impossible to obtain through conventional surveys.
Using voter files to identify ‘consistent voters,’ ‘drop-off voters’ and ‘nonvoters’
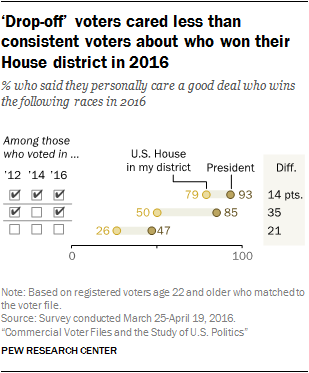 Voter turnout in the U.S. varies considerably by the type of election. It is highest in presidential election years and drops off considerably in off-years. Not only does overall turnout vary but the kinds of people who vote only in presidential elections are different from those who vote in both the presidential and the off-year elections. And, of course, some people rarely or never vote at all.
Pew Research Center explored the differences between these three kinds of voters: “consistent voters” – those who vote in both presidential and off-year elections, “drop-off voters” – those who vote in presidential but not off-year elections and “nonvoters” – those who rarely or never vote. The Center could have classified voters based on self-reported turnout in previous elections, but considerable research has shown that people tend to overreport their past voting. Accordingly, survey respondents from a sizable survey conducted using GfK’s KnowledgePanel (a probability-based panel of U.S. adults who have agreed to take periodic surveys) were matched with turnout records in the national voter file compiled by TargetSmart, a commercial voter file vendor. Nearly nine-in-ten respondents (88%) were matched to a record in the TargetSmart database. Voters were classified based on whether they voted in 2012, 2014 and 2016 (consistent voters), 2012 and 2016 but not 2014 (drop-off voters) or none of the three elections (nonvoters). These three kinds of voters were compared on a wide range of demographic and political characteristics, including attitudes about citizenship, politics and the role of government.
Matching a telephone survey to a voter file
The core analysis in this report is based on linking members of the American Trends Panel with their corresponding voter registration and turnout data found in commercial voter files. This linkage is easier and more reliable for survey panels, which typically have names, addresses and other information that is useful for matching. But other kinds of surveys – such as RDD telephone surveys – may also be matched to commercial voter files, even if it is not feasible to gather all of the necessary personal information for precise matching. Matching by phone is possible because most records in the commercial voter files have telephone numbers associated with them. For example, File 2 reported to us that it has phone numbers for 72% of registered adults and 55% of unregistered adults. But how well does matching by phone number alone work in practice?
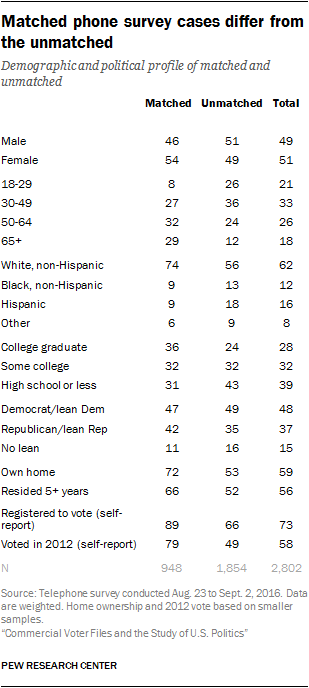 To test the feasibility of linking an RDD sample to a voter file, researchers matched records from an August 2016 dual-frame RDD telephone survey to a commercial voter file vendor. Portions of the matched data (which included voter file records associated with telephone numbers from both survey respondents and nonrespondents) were employed in an analysis of possible nonresponse bias in Pew Research Center’s 2017 study of survey nonresponse.
Of 40,182 phone numbers dialed, 16,466 (41%) were matched to one or more voter records. Among the 2,802 completed interviews, 1,513 (54%) were matched to at least one voter record. Many numbers were matched to more than one voter record. Especially in the landline sample, it was evident that two or more members of the same household were associated with the same number; many of these shared the same last name and the same address. Similarly, some individuals had two or three voter records (usually from different states or locations within a state).
Center researchers attempted to select the voter record that best corresponded with the actual survey respondent and was the most up-to-date. Respondents who matched the voter record with respect to sex and age (within plus or minus two years) were retained for further examination, along with those for whom age was not available from either the survey or the voter file. The respondents’ first names (collected at the end of the survey for many of the respondents) and ZIP code were used to further narrow the matched cases.
In all, 948 respondents in the poll (34% unweighted, 30% weighted) were matched to a voter record that corresponded with the survey record on sex, age, race (white vs. nonwhite) and location. The unweighted match rate was 67% among landline numbers and 23% among cellphone numbers. This match rate yields a sizable number of survey respondents with official voting records and modeled data on partisanship, political engagement and other variables. Still, the kinds of respondents who could be matched differed somewhat from those for whom a reliable match could not be made. The pattern of differences is very similar to that seen in the analysis of matching using the American Trends Panel, though the magnitude of the differences is greater. As we would expect, respondents who say they are not registered to vote were far less likely than others to be matched, though some were. And younger, less educated, less affluent, minority and politically unengaged individuals (based on survey responses) were considerably less likely to be matched.
Consequently, the trade-offs described earlier in this report are very evident here. The composition of the matched group is different from the unmatched group. Demographically, the matched respondents are older (29% ages 65 and older compared with just 12% among the unmatched), better educated, more likely to be non-Hispanic white and to own their home. Politically, the matched group is much more engaged and much more likely to be Republican than the unmatched group.
The utility of a process that matches about one-third of a telephone survey sample may be limited for researchers who are working with small sample sizes. But if the survey had attempted to collect name and address for the respondents, it’s possible that additional matches could have been located.
Commercial voter files in perspective
Despite the potential value of commercial voter files, they are hardly perfect. The imperfections stem from a variety of sources. At their core, the files are a compilation of official records from each state and the District of Columbia, with the addition of information about both registered and unregistered adults from other sources. But the administration of elections in the U.S. is remarkably decentralized, and the means by which official records are maintained and updated varies, although less so now than in the past. Moreover, the rules and norms governing access to voter records vary considerably from place to place.
Beyond the record of a voter’s registration and turnout, the quality of additional information such as demographic characteristics or a phone number is not uniform and is sometimes unavailable.
One important source of error in voter files is that Americans remain a fairly mobile population and there is no official system to notify elections officials that a voter has moved. (The National Change of Address dataset is maintained by the U.S. Postal Service but is not automatically integrated with election systems in the states.) The companies that compile and market voter data attempt to link voting records of individuals when they move, but the process is complex and far from foolproof. The kinds of people who are most likely to be missed in the voter files when they move do not constitute a random subset of the population, but instead are more likely to be younger, less educated, poorer and nonwhite. Similarly, very mobile Americans are more likely to appear on files in more than one location.
A related source of bias is the fact that voter files systematically miss those who are not registered to vote. Most of the commercial vendors of voting data attempt to include all Americans – registered and unregistered – because many users of voter files are interested in reaching and mobilizing all voting-eligible citizens. But since the files are built initially on official registration records, many of the unregistered fall through the cracks. The unregistered in the U.S. are less likely to have clear digital footprints, due in part to their greater mobility.
Efforts have been made to deal with errors in voter registration records resulting from mobility and other factors. For example, the Electronic Registration Information Center, also known as ERIC, is a nonprofit organization funded by 20 participating state governments to actively align official voter files across state lines to reduce these kinds of errors and to increase access to voter registration for all eligible citizens. (Disclosure: ERIC was formed in 2012 with assistance from The Pew Charitable Trusts, the parent organization of Pew Research Center.)
Some political scientists have also argued that the use of commercial voter files raises important normative questions. Those who believe that the political process benefits from higher levels of citizen participation may see voter files as providing a means for facilitating participation in the political process. While it can be demonstrated that voter files can be instrumental in promoting greater turnout among targeted groups and individuals, it is difficult to know whether their use results in an overall increase in political engagement. Similarly, while greater aggregate participation may be a desirable goal for a democracy, there is evidence in the political science literature that voter files increase inequality in participation because they are used primarily to further mobilize people who are already engaged. If efficiency in the use of campaign resources is a principal goal of practitioners (rather than engaging new or irregular voters), voter files could produce greater inequality in participation by making it easier for campaigns to avoid “wasting” effort on younger or poorer voters who may have a low propensity to participate in the first place.
Beyond the impact that voter files may have on the democratic process, the widespread availability of such detailed information about individuals raises concerns about personal privacy. Pew Research Center studies have found that Americans hold strong views about privacy in everyday life. They worry about the amount of their personal information that is being collected but at the same time are open to providing information in exchange for certain kinds of benefits. Nevertheless, they have little confidence that personal data about them held by businesses and government is secure (see the Methodology section of this report for details about how the Center handled survey respondents’ personal information).
The core data in voter files are the publicly available voting records of individuals. Members of the public may be unaware that voting records are public, but campaigns have long had access to them. What has changed is that they are much more accessible in the digital age due to changes in both government policies and the routine practices of the agencies that administer elections. It is simply more efficient for governments to digitize the records necessary for the orderly administration of registration and voting.
Another change is that it is now much easier to merge voter records with other kinds of digital data, such as that collected by marketing and credit data companies. And it is possible to merge the voter file data, including the financial and marketing data, with data from social media platforms. Together, this information can provide a relatively comprehensive portrait of many individual citizens for use by campaigns and interest groups. Of course, this is just the political equivalent of what marketers are doing to identify and target consumers for specific products and services. But it brings the political process into the ongoing debate about personal privacy, where people often have strong negative reactions to finding themselves the focus of tailored ad campaigns and the like.
Rubén Weinsteiner
Since the rise of modern survey research, much of what is known about voter attitudes, behavior and the composition of the electorate has come from interviews with samples of voters, sometimes in combination with aggregate voting statistics. But relatively recent technological innovations and government policy changes have given political practitioners and researchers a new addition to their toolbox: national digital databases, or “voter files.” These files are built by commercial organizations using official, publicly available government records of who is registered to vote and who cast ballots in past elections.
As research and targeting using these voter files has become more widespread, voter file vendors are increasingly trying to provide coverage of all U.S. adults, including those who are not registered to vote. These commercially available files provide not only a nationwide picture of voter registration and turnout, but are usually supplemented with information from consumer data vendors, credit bureaus, political organizations and other sources and are marketed as providing a rich and comprehensive record for nearly every American adult.
Over the last decade, commercial voter files have become central to the conduct of contemporary election campaigns and are frequently employed by pollsters, journalists and political analysts trying to understand the American electorate. As part of a broader effort at Pew Research Center to shed light on this important but somewhat arcane resource, this report focuses on using the files to enhance our understanding of survey respondents. It also attempts to evaluate the quality of the data provided by the files.
In order to accomplish these goals, voter file data acquired from five commercial vendors were matched to participants in Pew Research Center’s American Trends Panel, a nationally representative sample of adults who have agreed to take surveys on a regular basis. This offers an opportunity to compare self-reported voter registration and turnout data provided by panelists – data that are subject to well-documented survey errors – to the high-quality official vote records included in the voter files. It also provides a chance to use data acquired from survey interviews with panelists to verify the accuracy of the ancillary information that commercial vendors attach to the voter files, including additional demographic, financial, lifestyle and political data.
The data sources
To describe and evaluate voter files, Pew Research Center attempted to link all of the nearly 5,000 members of the American Trends Panel (ATP), its nationally representative survey panel of U.S. adults, to five commercial voter files. Two of the files are from nonpartisan vendors, two are from vendors that work primarily with Democratic and politically progressive clients and one is from a vendor that works primarily with Republican and politically conservative clients. The vendors are anonymized and numbered from one to five in this report, ordered by the rate at which the voter file records were matched to members of the panel.
All vendors were provided with the same panelist information for searching, which included their name, address, gender, phone number, race and ethnicity, date of birth or age and email address. Vendors were then asked to find these individuals in their voter files using their normal matching methodology. The vendors then provided Center researchers with voter file data on voter registration and turnout, party affiliation and demographic characteristics for each panelist they were able to match. Vendors were obligated to maintain this information in strict confidence and to permanently delete all personally identifying information about panelists when the matching was completed. Overall, 91% of the 3,985 active members of the ATP who took part in a survey conducted Nov. 29 to Dec. 12, 2016 (and who provided a name) yielded a match by at least one of the vendors.1 Summary of findings
Commercial voter files are an amalgamation of administrative data from states about registration and voting, modeled data about partisanship, political engagement and political support provided by vendors; and demographic, financial and lifestyle data culled from a wide range of sources. Bringing together data from a number of different sources brings challenges, as each source comes with its own strengths and weaknesses. A principal goal of this study was to assess the accuracy and completeness of the information in the commercial voter files. For most of the analyses, information provided by respondents in the American Trends Panel is used to assess the quality of the information in the voter files. Here are some of the most important findings, followed by additional detail from the analysis:
Researchers were able to match a very high percentage of panelists from the nationally representative survey sample to at least one of the five commercial voter files, suggesting that the files collectively cover a large share of the U.S. population. Depending on the voter file vendor, the percentage of panelists matched varied from a low of 50% to a high of 79%, with an average match rate of 69%. Less than half (42%) of the panelists were located in all five files, but each of the vendors “found” panelists missed by other vendors. Differences among the vendors are largely a function of their tolerance for mismatches and, presumably, the success of their matching algorithms. Collectively, the vendors successfully matched 91% of panelists, meaning that more than nine-in-ten panelists could be found on at least one of the files and just 9% of panelists could not be found on any of the files. The relatively high level of coverage of the files is encouraging for researchers and campaigns that use them for targeting, messaging or research. Of course, most clients using these voter files will not have purchased all five of them, so match rates of 90% and higher may be difficult if not impossible to achieve with any single file.
Still, commercial voter files may disproportionately miss segments of the public who are politically disengaged, younger, Hispanic and more mobile. Specifically, the likelihood of finding an individual on a commercial voter file was strongly related to whether they were registered to vote. On average across the five vendors, 77% of people who said they were registered to vote were matched. Only 38% of the self-described unregistered voters were matched. Similarly, match rates varied greatly by panelists’ age, race and ethnicity. Only about one-in-five younger panelists (22% of those ages 18 to 29) were found in all five files, as compared to more than half (59%) of older panelists (ages 65 and older). Similarly, just 26% of Hispanics were found in all five files, compared with 47% of non-Hispanic whites. 2 Mobility is also a strong correlate. Only 14% of those who reported moving in the last year were found on all five files. Those who reported living at their residence for longer matched at a much higher rate.As a result of the systematic demographic differences in the types of people who were difficult to locate in the files, this analysis finds that commercial voter files may have significant limitations for efforts to study the general public (as opposed to registered voters). In comparison with random-digit-dial telephone samples, voter files do not provide the same degree of coverage of the adult population overall, and the kinds of people missed by the files may be very different politically and demographically from those who can be found in the files and contacted by phone.
The process of matching survey panelists to the voter files can be vexed by small differences in names and addresses, leading to ambiguity regarding the accuracy of some of the matches. In addition, difficulty with matching is related to lifestyle and demographic factors – such as frequently changing one’s residence – that are also correlated with political engagement and party preferences.
Across the five vendors there were significant differences in matching styles and, as a result, match rates. Some vendors restricted their matching only to panelists for whom they had a very high degree of certainty about the accuracy of the matches, resulting in an older and more politically engaged set of matched panelists. Other vendors assessed the trade-off differently and matched a higher share of panelists, producing a more diverse matched group while accepting more uncertainty about the accuracy of their matches.
The files generally agree with respect to voter turnout in the 2016 presidential election (at least among survey respondents who are matched in common), though one of the files appeared to miss a number of voters captured by the other four files. And there is no record of voting for nearly all survey respondents who said in a post-election survey that they did not vote in 2016.Among panelists who were matched by all the vendors in the study, 85% have identical turnout records across the five files: 75% are recorded as having voted in 2016 in all five files and 10% have no record of a vote in all five files. One file – File 3 – had records that conflicted with the other four files for many panelists, indicating that they may have missed the state voter records for many panelists.Another potential measure of data quality in measures of turnout is how closely the self-reported vote choice (e.g., Trump vs. Clinton) among those panelists flagged as having voted matched the actual election outcome. Reported presidential vote by panelists verified as having voted by at least one of the voter file vendors is very similar to the national vote share for each candidate (48% Clinton, 45% Trump among validated voters, compared with the official outcome of 48%-46%). Presidential vote among these validated voters was much closer to the outcome than the vote among all self-reported voters in the panel (49% Clinton, 43% Trump).
Self-reported data on voter registration status is particularly problematic. Many panelists who expressed doubt about their registration in a survey, or who said they were definitely not registered, nevertheless had a registration record on at least one file. This may reflect the fact that voter registration is an administrative status that is somewhat abstract rather than a more easily remembered behavior like voting.
There was a relatively close correspondence between panelists’ self-reported party affiliation and the party identification predicted by voter file vendors. Voter file data on party affiliation benefits from the fact that many states register voters by party, and while voters’ party registration might not always match their self-identification, it is a very good proxy. However, even in states without party registration (roughly half of U.S. adults live in such states), the voter file estimates of party affiliation tended to be reasonably accurate. On average across the five files, modeled party affiliation in the files matched self-reported party affiliation for about two-thirds of panelists (67%). In general, the files did a better job of identifying Democrats than Republicans.Voter file turnout models did a good job of predicting who would vote in 2016. The analysis in this report, along with a previous Pew Research Center study, show that using these scores to create a likely electorate for the 2016 general election improves election estimates relative to relying on self-reported information alone.Prior to the 2016 general election, each vendor provided a measure of turnout likelihood in the election, and applying these measures improved the accuracy of the American Trends Panel’s estimate of voter preferences in the presidential race. The estimate narrowed Hillary Clinton’s advantage from 7 percentage points among all registered voters to a range of 3 to 5 points using the modeled turnout scores. She ended up with a 2-point advantage over Donald Trump on Election Day. Past voter history is a key component of these models, but the exact algorithms the vendors use are not public.
The voter file estimate of the race or ethnicity of panelists, when provided, also matched the survey data reasonably well. The files are able to accurately categorize 79% of panelists (on average) by race and ethnicity, including an average of 93% for non-Hispanic whites, 72% for Hispanics and 67% for blacks.Other demographic data in the voter files – like education and income data – tended to be suggestive at best and were often missing entirely. The vendors differed considerably in the accuracy of some of these kinds of variables. Education level was either missing or inaccurate an average of 48% of the time across the files. Similarly, household income was missing or inaccurate 63% of the time on average across the files. In general, these demographic variables simply provide a greater likelihood of identifying a group of interest, rather than any certitude of doing so.
Caveats about the analysis
Because much of the analysis presented here is based on a comparison using data from Pew Research Center’s American Trends Panel, it is important to note that no survey, including the American Trends Panel, perfectly represents the adult population of the U.S. While data in the panel are weighted to be nationally representative with respect to a wide range of characteristics (age, sex, race, Hispanic origin, education, region of residence, population density etc.), no survey is an exact model of the population in all respects. A second caveat is that while most of the demographic information and partisan affiliation provided by the panelists is likely to be correct, self-reports of voter registration – or voter turnout, in particular – may err because of the phenomenon known as social desirability bias. Some individuals may report being registered or having voted when they have not. In general, self-reported demographic and related personal information about panelists will be treated as true, while self-reports of political engagement –behaviors that are viewed as socially desirable and are often overreported – will need to be evaluated carefully in light of the information in the voter files.
History of voter files
Election administration in the U.S. has historically been highly decentralized, with states adopting a range of methods for managing the election process and keeping records of who is eligible to vote and who has voted. This patchwork made it very difficult, if not impossible, to assemble anything resembling a national database of voters. Even statewide databases were unavailable in some places.
The relatively recent availability of commercial voter files is a result of both technological progress and government policy changes that resulted from problems in recent U.S. elections. The 2000 presidential election raised concerns about the accuracy, consistency and quality of election administration systems. In its aftermath, Congress adopted the Help America Vote Act of 2002 (HAVA) to address some of these issues. Among the many provisions of HAVA was that states were directed to create “a single, uniform, official, centralized, interactive computerized statewide voter registration list defined, maintained, and administered at the State level that contains the name and registration information of every legally registered voter in the State …”3 These digital databases then made it possible for partisan and commercial organizations to collect and compile national files of voters by combining the digital files from each state and the District of Columbia.
In an age when personal information has been increasingly commoditized, the files then iterated a step further. Very comprehensive databases of nearly all adults in the U.S. are now maintained by credit bureaus and other businesses. Commercial voter files based on registered voters can be compared with the larger databases of all adults to identify individuals who are not registered to vote. Records for these individuals are then added to the commercial voter files and all of the records are populated with additional political and nonpolitical information.
The compilation process that companies use to create the national voter files is far easier now than it was before HAVA, but it is not without its challenges. Americans remain a fairly mobile population, meaning that credit, consumer and voter files must be continually updated. A registered voter who moves to another state must re-register, and there is no uniform method by which election officials across states are notified when a voter moves. While both election officials and the commercial voter file vendors attempt to keep track of individuals when they move using resources such as the National Change of Address database from the U.S. Postal Service, the process is hardly foolproof. Each commercial vendor uses different methods for updating its files and making judgments about which official record associated with an individual is the most current one. Still, even with their flaws, the commercial voter files constitute a considerable improvement over what was available to campaigns, parties and researchers prior to the passage of HAVA.
Matching the American Trends Panel to voter files
In addition to their use as survey sample sources, voter files are commonly used in political research by matching and linking them to people who have responded to polls or are found in various lists such as members of the clergy or physicians. Efforts to link public vote records to surveys go back several decades prior to the existence of modern commercial voter files. In the 1980s, the American National Election Study attempted to link voter turnout records to its respondents by having interviewers visit local election offices where the respondents lived. This labor-intensive and expensive effort was later abandoned but has been revived with the availability of better quality digital files in individual states and the commercial files covering the entire country. The Cooperative Congressional Election Study is another prominent election survey that has matched respondents to a voter file.
The process of linking commercial voter file records to survey respondents (or any list, for that matter) might seem straightforward: Use the respondent’s name, address and other information to identify a voter file record for the same person. However, the matching process can falter if there are major differences in names (e.g., a maiden name vs. current married name), or addresses (e.g., if respondents have recently moved). Quirks in the data can also affect the matching process. And some individuals are simply not present in the commercial voter files at all. For uniformity, we accepted the data as the vendors sent it, knowing that for a variety of reasons (including those listed above), some vendors matched panelists that others did not.
To better understand and evaluate both the matching process and the properties of voter files, Pew Research Center attempted to match members of the American Trends Panel, its nationally representative survey panel, to five different commercial voter files. To be sure, there are more than five vendors that maintain comprehensive national voter lists, but the vendors used in this study represent five of the most prominent and commonly used voter files. Two of the files are from vendors that are traditionally nonpartisan, and three are from vendors that work primarily with clients on one side of the partisan spectrum – two that work with Democratic and politically progressive clients and one who works with Republican and politically conservative clients.4 All vendors were provided with the same panelist information: name, address, gender, phone number, race and ethnicity, date of birth and email address. They were asked to find these individuals in their voter files using their normal matching methodology and return the voter file records, such as registration status and turnout history, to Pew Research Center. Of the 3,985 active members5 of the ATP who provided a name6, 91% were identified in at least one of the five commercial voter files. Vendors agreed to delete personally identifying information about panelists when the matching was completed. When considered in total there is a high level of coverage of the survey panelists. But individual vendors matched at different rates. Two of the files (Files 1 and 2) matched the highest share of panelists (79% and 77% respectively) followed by Files 3 and 4 at 69% each.
File 5 matched at the lowest rate of just 50% of panelists. However, a low match rate does not necessarily imply lower quality data. In a follow-up analysis conducted to evaluate the quality of the matches, 99% of File 5’s matches were judged as likely accurate, compared with 94% to 97% of the other vendors’ matches. Voter file vendors told us that they have differing thresholds for confidence in selecting a match. This offers clients a trade-off in getting more data with more matches, at the cost of potentially including some inaccurate matches, versus fewer matches and greater accuracy but potentially more bias in the cases that are matched.7
Officials at File 5 said they were confident about the quality of their matches, which was borne out by our evaluation. However, they matched far fewer panelists than some other vendors and thus provided much less usable information overall, even if matches are limited to those who meet a high threshold of accuracy.
There is significant overlap in who matched to each file. Records for four-in-ten panelists (41%) were found on all five voter files and another 18% were found by four of the five vendors. Overall, 9% of panelists were found only on a single file – with most in this group coming from Files 1, 2 and 3). But each of the vendors found panelists that other vendors missed. Only 9% of panelists were not found by any of the vendors.
Matches made by File 5 (with the lowest overall match rate) have the highest overlap with other vendor matches. Fully 82% of matches to File 5 were also found by the four other files, followed closely by Files 3 and 4, with 60% of their matches being common matches with other files. Files 1 and 2 both had roughly half (53% and 54% respectively) of their matches found by all other files, with many of their matches found by only two or three other vendors.
How matches are made
The matching process uses information such as the respondent’s name, address, gender and date of birth – whether from a list or collected during the survey – to identify the respondent’s voter file record. Sometimes this process is straightforward, when a respondent’s name, address and date of birth match perfectly to the voter file. Unfortunately, this isn’t always the case. If the state voter list doesn’t report birthdays, or if a respondent is registered under a different name or at a different address, a successful match may not occur.
When a perfect match can’t be found, multiple possible matches must be considered, and the best match is chosen from among these. The process used by many vendors typically consists of two steps. The first step searches vast numbers of records to find potential matches, while the second chooses which among the plausible matches is best. At the first stage, the vendor’s matching software tries to identify all of the records that might be good matches to the respondent. Because the software has to sift through hundreds of millions of voter file records to identify these matches, computational shortcuts are used to locate plausible matches without burdening the software with assessing exactly which record will be the best match.
To give a concrete example, suppose that, at the time of this data collection, Vice President Joe Biden had been a part of our study. We would have asked the vendor to find the voter file record of a Joseph Biden, who reported being born in 1942 and residing (at the time) at 1 Observatory Circle, Washington, D.C., the official vice presidential residence. The software would set out to find all of the voter file records that could possibly refer to our respondent. People named Joe Biden or Joseph Biden, or having similar names like Jose Biden or Joe Widen, other 1 Observatory Circle residents and Bidens born in 1942 would all arise as possible matches. Once the full set of possible matches is generated by the first stage, the second stage begins. The software assigns all of the possible matches a score expressing the voter file record’s similarity to the respondent’s matching data. An exact name match would be assigned a higher score than approximate name matches like Jose Biden or Joe Widen. Similarly, matches that share a full birthdate or address would be assigned higher scores, while matches that merely live in the same city or that are the same age but have incomplete or nonmatching birthdates would receive lower scores. After all of these matching scores are generated, a best match is chosen.
Typically, the best match is simply the voter file record that mostly matches the information volunteered by the respondent. But other considerations can lead researchers to prefer a more imperfect match. Suppose we were left to choose between two records: a registered voter, Joseph Biden, with a listed home address in Wilmington, Delaware or a Joseph Biden, living at 1 Observatory Circle in Washington, D.C. but with no record of being registered to vote at that address. The Washington record is obviously the closer match, as it matches the address the respondent gave. On the other hand, if both records refer to the same Joseph Biden, then we may be more interested in the Delaware record, as the registered voter record will include information about his registration status, length of registration, vote history and political party. Ascertaining which of these two matches is preferred is partly a matter of making a trade-off between match confidence (the confidence we have that the record refers to the respondent) and the match’s usefulness (the amount of useful and relevant data conveyed by the voter file record).
When researchers have to match survey data to the voter file, they face the choice of doing the matching themselves. They can either take the whole voter file (or large portions of it) and write computer code to find the records that best correspond to the survey respondent, or they can opt to have a voter file vendor do it for them. Having a vendor do the matching is appealing, since it requires less work from the researcher and it can even be less expensive, since it means purchasing less data from a voter file vendor, but it comes at the cost of having less control over the matching process. When contracting out the matching process to a vendor, researchers typically never see the rejected matches, making it difficult to assess whether better matches were erroneously rejected by the vendor.
On the other hand, vendors have more experience matching and can usually devote more computational and software engineering resources to the problem than researchers can. Even if the methods are proprietary and not especially transparent, they could be a preferable option if their performance is superior.
Biases in the match
Failures to match do not occur randomly. Rather, certain kinds of people are less likely to be successfully matched. These individuals also tend to be different politically than those who are easier to match. This can lead to biases in conclusions drawn from data with matched voter file information. Panelists who are registered to vote and say they participate regularly in elections are more likely to be matched, leaving the politically disengaged underrepresented in voter files. This is to be expected, as registered voter lists in the states make up the bedrock of voter files. In particular, Files 1 and 2 match more of those who are not politically active and engaged than the other vendors. Just 19% of those who said they didn’t vote in 2016 were matched to File 5. By comparison, 56% of 2016 nonvoters matched to File 2 and 53% were matched by File 1. A similar pattern emerges with voter registration. While File 2 matches 54% of those who say they’re not registered to vote, File 4 matches only about one-third (35%) of that group to their file, and File 5 – with the lowest overall match rate – matched only 12%.
A similar pattern appears with respect to party affiliation. Files with higher match rates, such as File 1, were able to match eight-in-ten or more of those who identify with a party to their file (86% of Republicans and 79% of Democrats), while 61% of those who do not lean toward either party were matched. While Republicans have a slightly higher match rate in several files, the partisan differences are modest.
Differences in the match rates for different subgroups naturally have an impact on the demographic and political composition of those matched. While all files have a political engagement bias in terms of who is matched, those biases increase as match rates decrease. In other words, as vendors become stricter in terms of who they consider a match, the sample of people who are matched looks increasingly politically engaged. For example, 75% of American Trends Panel members say they voted in the 2016 election. Among those matched to File 1, the file with the highest match rate, 83% report having voted in 2016. Among those matched to File 5, the file with the lowest match rate, 90% report having voted. Interestingly, these differences are not present when it comes to partisanship. While the partisan composition of the panelists matched to each of the five files is slightly more Republican than the panel overall, differences among the files are minor or negligible.
A consequence of these differences in match rates by partisanship and political engagement is that panelists who are registered to vote and regularly participate in elections are more likely to be matched to multiple files, while those who do not participate tend to be found on fewer (or no) files. Nearly two-in-ten who self-report not leaning toward either party (17%) are not able to be matched to any of the five voter files compared with just 3% of those who identify as Republican. Democrats and independents who lean Democratic are also slightly less likely to match: 11% of Democrats and 12% of Democratic leaners were not matched to any files.
By the same token, those who identify with either of the parties are far more likely to be found in many, if not all, of the voter files in this study – a reasonable proxy for being easy to find. While just 23% of those who do not lean toward either party were found in all five files, more than four-in-ten Republican identifiers (47%) and Democratic identifiers (42%) were found on all five files. Those who lean toward either party, regardless of partisanship, were a little less likely to match across the files: Only 41% of Republican leaners and 36% of Democratic leaners matched to all five files. An even more dramatic pattern can be seen with political participation. Half (51%) of those who reported voting in the 2016 election matched to all five voter files, compared with just 15% of those who said they did not vote. More than four-in-ten (44%) of those who said they didn’t vote were found in just one or no voter files, vs. 9% of those who said they voted. Among panelists who report not being registered to vote, 26% are not found on any voter files and another 23% match to only one file. Just 9% match to all five voter files.
Beyond the impact of political engagement, certain demographic characteristics are strongly associated with propensity to match. Voter files tend to do a better job of matching older, white, less mobile panelists while younger, more diverse and more mobile panelists end up with fewer or no matches. And, of course, these demographic characteristics are related to both partisanship and likelihood of participating in politics.
Age and mobility are particularly strongly associated with matching. Across all of the vendors, there is a roughly 30-point difference in the rate of matches between people ages 18-29 and those 65 and older. Similarly, people who have lived at their current address for less than one year are considerably less likely to be matched than those who have resided at their address for at least five years.
As a consequence of these patterns, the demographic profile of those matched differs somewhat across the vendors. File 5, with the lowest match rate, has the smallest share of panelists ages 18-29 (13% vs. at least 16% for the other files). And two-thirds of File 5’s panelists have lived at their current residence for at least five years, compared with 58% to 59% for the other vendors.
The demographic differences in propensity to match also mean that more than one-in-six younger panelists (18% of those ages 18-29) are not matched to any of the five files and an additional 16% were found on just one file. Only 22% of younger panelists were found in all five files. By comparison, 59% of older panelists (ages 65 and older) were found on all five files, and just 2% were not found on any of the files. Similarly, 52% of those who have lived at their current address for five or more years matched to all five files and just 5% could not be located in any file. Just 14% of those with less than one-year tenure at their current address were located by all five files.
Hispanics match at lower rates than other racial or ethnic groups. Nearly a quarter (23%) are not matched to any files. Only 26% of Hispanics were matched by all five files, while nearly half (47%) of whites were found by all five. Blacks fall somewhere in between. Roughly four-in-ten blacks (43%) were found on all five files, while 10% were not matched to any files.
While there are differences in propensity to match by educational attainment, they are comparatively minor. Half (48%) of panelists who report having at least a bachelor’s degree were matched to all five files, compared with 36% of those who reported having a high school diploma or less. Panelists at all education levels are roughly equally likely to not be matched to any file.
How well do the voter files cover the unregistered?
When voter files first came to prominence for practitioners and researchers, many were just what the name suggests – lists of registered voters. However, as research and targeting using the voter files has become more widespread, most vendors try to provide coverage of all U.S. adults, including those not registered to vote, in their files. Because the core component of the files is a combination of official state lists of registered voters, vendors have sought out commercial databases – available from sources such as credit rating agencies – to locate Americans missing from state voter rolls.
How well the files cover the unregistered population is potentially an important consideration for those who wish to use the files to locate and attempt to persuade the unregistered to register. Coverage of the unregistered is also important if the file is to be used for describing or conducting surveys of the general public and not just voters. To date, pollsters have used the files as a source for sampling the registered voter population, but files that make an effort to cover the full population could theoretically have utility as sampling sources for the general public. To the extent that they accurately represent the non-registered population, such files provide the researcher with the opportunity to use information in the files to guide the sampling. For example, the non-registered and registered voters with lower turnout propensities could be oversampled for research aimed at understanding the less engaged.
To assess how well the files cover the unregistered, the match rates and composition of the matched cases was compared for panelists who report being registered to vote and for those who say they are not registered or are not sure if they are registered. In Pew Research Center surveys, respondents are considered unregistered if they report not being registered or express uncertainty about their registration. Among members of the American Trends Panel, those considered unregistered are much less likely to have been matched by the files. As noted in the previous chapter on the matching process, the match rates for the self-reported unregistered varied from a low of 12% to a high of 54%, depending on the vendor. Not surprisingly, panelists who were certain about their lack of registration had the lowest rates, ranging from 4% to 50% matched, with those who said they were probably registered but not certain falling between the certainly registered and the certainly unregistered. The files collectively found far more of the unregistered than did any single file by itself. Two-thirds of those who were certain that they were not registered were located by at least one of the files, while 86% of those who said they were probably registered were matched. More than nine-in-ten (96%) of the certainly registered group were found in at least one file. But differences in match rates across the files were much greater for people in the two unregistered categories than for those who were certain they are registered.
The collective results of the five files provide evidence that the unregistered are not completely invisible to commercial files of the sort examined in this study. This is reinforced when comparing the demographic and political profiles of the registered and the unregistered. As a group, the matched unregistered are similar to all unregistered, perhaps somewhat unsurprisingly since they constitute about three-quarters of the latter group. One difference that stands out is that the matched unregistered are significantly more likely to identify as Republican or Republican-leaning than are all unregistered panelists (and twice as likely to be Republican as the unmatched unregistered). This anomaly is evident in the collective group (matched to any file), as well as in each of the individual voter files. Research suggests it could be linked to the fact that those who are matched and unregistered tend to be wealthier than the unmatched.
Although the files collectively cover a sizable share of the unregistered, the unregistered population who are unmatched to any of the files are quite different with respect to age, race and partisanship. Just over half (53%) of the unmatched unregistered are younger than 30, compared with 37% among those matched to at least one file (and 21% among all adults). Half of the unmatched unregistered (52%) identify as Hispanic, compared with just 21% among the matched cases. And just two-in-ten (19%) of the unmatched unregistered identify as Republican or Republican-leaning, compared with 41% of all unregistered. Collectively, these results show that, especially within a group known to be harder to match (the unregistered), there are demographic biases in the unmatched. These biases largely echo what we see in matching among the general public.
Political data in voter files
Among the most important data on the voter files for the election analyst are the records for whether or not someone is registered to vote and whether they voted in a given election. These individual registration and turnout records come directly from records kept by each state for every election. The turnout record indicates whether or not someone voted in a given election, though it does not provide their chosen candidate or party. The registration record may include which political party the individual is registered with (in states where voters can register by party). When combined with other data in the voter file, it is possible to create a rich picture of who is registered and who showed up to vote in previous elections.
In addition, while an individual’s vote history is readily available through the official voter records in all 50 states and the District of Columbia, commercial voter files typically offer scores for things like partisanship and expected turnout for future elections generated through predictive models. This chapter will explore the availability and accuracy of political data on voter files, both raw and modeled.
Vote history is largely consistent across the files
Election analysts greatly value the availability of turnout records for past elections. Being able to document turnout in different types of elections (e.g., presidential years and off-years) enables researchers to better understand how voters differ in motivation and resources to participate. It is, of course, possible to ask survey respondents about voting in past elections. But pollsters recognize that memories about events that occurred two or four years ago (or longer) are potentially faulty, especially for respondents who are not especially interested in politics. Thus, having accurate turnout records for individuals is an important asset of the commercial voter files. Even with direct access to state voter files, a researcher may not be able to document an individual’s past voting behavior if they have changed their state of residence during the period of interest. One important caveat to consider with vote history is that, while the presence of a record of voting almost certainly means that a person voted in that election, the absence of a record doesn’t mean they definitely did not vote. The lack of a record could indicate that someone did not vote, that the matched data has missed one or more election records for an individual or even that the match is to the wrong person. Even when the match is to the correct person, the voter record attached to that person in the commercial file may be out of date or otherwise incorrect.
The situation is even more ambiguous for individuals who are not matched to a voter file. Since voter files are built on a base of official state records and subsequently expanded with non-official commercial records, the absence of a match may indicate that the individual does not have a state registration or voter record where he or she currently lives. This could imply that he or she is not registered and therefore probably did not vote in recent elections. But this cannot be said for sure, since failures to match can occur even when a state record exists (for reasons discussed earlier).
In assessing turnout for the 2016 presidential election, there tends to be a fairly high degree of agreement among the files on an individual’s vote history. This is likely because all the vendors draw from the same state voter files as raw source material. This is especially the case for four of the five files, which produce relatively similar turnout rates. Estimates in File 1 through File 4 range from a low of 71% who are listed as having voted in 2016 to a high of 78%. However, File 5 exists as an outlier. As the file with the lowest match rate, File 5 produces the highest estimate for turnout in 2016, at 86%. While these turnout rates are in line with self-reported turnout on the American Trends Panel, the turnout rates here are considerably higher than the known turnout rate in each election. However, as noted in Chapter 2, politically engaged respondents are more likely than less engaged respondents to be matched to the voter files. This leads to higher estimates for turnout in each election.
To eliminate the variation in turnout rates produced by differences in match rates across vendors, the turnout rates were computed for the roughly four-in-ten (42%) panelists who were matched by all five files. Among these panelists, 85% have identical turnout records across the five files (75% are recorded as having voted in all five and 10% have no record of a vote in all five). At the aggregate level, turnout was 87% to 88% in four of the five files, but is 7 points lower in File 3 (81% turnout). The reason for this exception is unclear.
As with turnout in 2016, the vendors vary somewhat in their rates of voting for 2012 and 2014. However, when restricting to the common set of matches between all five vendors, most of the variability is eliminated (as it was for 2016): Turnout estimates for 2014 vary between 65% and 67%, and for 2012, between 76% and 80%. In this analysis, File 3 does not stand out as exceptional, as it did with the 2016 vote.8
The fact that turnout rates for 2012 are considerably lower than for 2016 illustrates the difficulty of accurately tracking voting records over time, even for organizations that have made it a very high priority to do so. The actual turnout rate among voting-eligible adults for 2016 is estimated at 60%, while the 2012 rate is just 1 point lower (59%). And yet, the 2016 turnout rate for the panelists exceeded the 2012 rate by margins of 3 to 9 points across the five files. It is clear that vote histories get lost as people move or change names, despite the best efforts of vendors to build a complete history for those in its files.
Survey error in reported turnout
One of the most common challenges facing survey research about elections is the tendency for some people to say they voted when they did not. This phenomenon has received extensive academic attention, and much of the research has relied upon surveys matched with validated voter turnout data. For many people, voting is a socially desirable behavior because it conforms to traditional notions of civic duty. Accordingly, there may be pressure for people to claim they voted even when they did not. Previous research has documented that the incidence of misreporting turnout is higher among people who value political participation and, as a group, may already have higher rates of turnout. Voter files have greatly aided researchers’ understanding of error in the measurement of voter turnout.
As expected, the rate of self-reported turnout in 2016 exceeded the voter file estimates among matched panelists in all five voter files. The overestimate of turnout ranged from 4 percentage points in File 5 to 13 points in File 3. Yet unlike most studies that have examined overreporting of voting, which typically use a single source of voter validation, Pew Research Center has five sources for evidence of turnout and thus can be more confident that failures to match or errors in record-keeping by a single source might lead to erroneous conclusions about an individual’s turnout. If researchers are confident of the accuracy of the matches for an individual, a record in one file that they voted is strong evidence even if other files provide no record of voting.
Panelists were interviewed shortly after the 2016 election about their participation in the election and asked whether and for whom they voted. The self-reported turnout rate among panelists (restricted to citizens) was 77% (weighted) – 17 percentage points higher than the estimated turnout rate among the entire voting-eligible population.
This overestimate of turnout is likely a consequence of three different factors. One is (as discussed above) misreporting by respondents, driven by the desire to appear more engaged or perhaps by a respondent’s impression of one’s self as a dutiful citizen who usually votes. Another is that the survey’s sample includes people who are more politically engaged than the typical American. The third is that being surveyed, and especially being in a panel with regular surveys, might stimulate a respondent’s interest in politics and potentially motivate them to vote. Warren Miller, a renowned political scientist who was a coauthor of the seminal research on elections, “The American Voter,” once said that the American National Election Study was “the most expensive voter mobilization project in American history” because it appeared to have motivated many of its respondents to vote when they might otherwise have not done so.
The voter files provide excellent evidence about the first of these explanations – misreporting by respondents. Self-reports of turnout can be compared with the verified record of voting to estimate the extent of overreporting and the characteristics of those who overreport. To do this, researchers used a composite estimate of turnout based on records in all five files. If any file included a record of turnout for the panelist, it was assumed that the panelist voted, even if other files did not find a voter record. If a matched panelist had no record of voting in any file, that person was considered a nonvoter. But because there were five vendors looking for panelists, researchers made the additional assumption that unmatched panelists were also nonvoters. The validity of this assumption depends on the accuracy of the matches. Consequently, before implementing this step, researchers evaluated the quality of the matches by comparing the name and address of each panelist with the name and address on the voter file record that matched to it. Matches judged to be possibly incorrect because of inconsistencies in the name or address were considered unmatched for purposes of this analysis.9
To review, if any file included a record of turnout for the panelist, it was assumed that the panelist voted, even if other files did not find a voter record. All other panelists were considered to be nonvoters. This is based on the fairly strong assumption that panelists who could not be located and verified as a voter in any official voter file by five different commercial vendors can be assumed to have not voted.
Using this approach, the voter file verified turnout rate among the panelists was 65%, 5 percentage points higher than the best estimate of national turnout among eligible adults. One percent among the 65% are panelists who said they didn’t vote but have a record of doing so. This small group of fewer than 20 individuals may have accidentally selected the wrong option on the survey, or there could be an error in the official turnout record. About one-in-five panelists (22%) are validated nonvoters (respondents who said they didn’t vote and for whom no record of voting exists).
The remaining group consists of the overreporters. These are the 12% of all voting-eligible adults (citizens who are 18 years of age or older) who said they voted but for whom no record can be located across five voter files. Demographically, these individuals are more male than female (56%-44%), disproportionately black and Hispanic (17% each, compared with about 10% each among validated voters), much more Democratic than Republican in party affiliation and more supportive of Hillary Clinton than Donald Trump (56% Clinton, 35% Trump vs. 48% to 45% among verified voters). They are much more likely than validated nonvoters to say they “always” vote (44% vs. 5%) and that they follow what’s going on in government and politics most of the time (36% vs. 13%).10
Having a validated measure of who voted and who did not makes it possible to assemble a more authoritative portrait of the electorate in 2016. As post-election analysis has demonstrated, the composition of the 2016 electorate is important in understanding Donald Trump’s 2016 election victory, and – more broadly – what kinds of changes may be occurring in the U.S. political system.
Analysts have generally relied upon three main sources of data on who votes. One is the National Election Pool’s (NEP) exit poll, which provides estimates of the voting patterns among different groups in the population. Another is the U.S. Census’ Current Population Survey (CPS) supplement on voter registration and turnout, conducted shortly after the general election. A third is the set of independent surveys such as the American Trends Panel and the American National Election Study.
The NEP’s exit poll has been criticized for overrepresenting younger, college educated individuals and minorities. The CPS survey finds an electorate that is less educated and more likely to be white, as do many independent surveys.
The American Trends Panelists who self-identify as having voted in 2016 looks very much like the CPS electorate, especially with respect to the critical category of non-college whites. The ATP sample of self-reported voters is 43% non-college white, about the same as in the CPS survey, and just 34% in the exit poll. But the ATP self-reported voters supported Hillary Clinton by a six point margin, 49% to 43%. Restricting the sample to those who are validated as having voted in at least one of the voter files does not change the composition of the sample very much (though the share of white non-Hispanic voters rises from 71% to 74%), but the vote margin now approximates the actual election result, 48% Clinton to 46% Trump.
Using just the matches in each of the voter files produces similar results with respect to the horse race. Compared with reported vote choice among all matched panelists in each file who said they voted, the Clinton advantage over Trump among validated voters in each file was narrower. Clinton’s advantage varies from 2 to 4 points across the five files (versus 3 to 6 points among all self-reported voters matched by in each file).
Self-reported voter registration status is murkier than voter turnout
Compared with voter turnout, voter registration is a much more problematic measurement issue for survey researchers. The fact that voter registration is a status rather than an activity means it is something that can be difficult to remember accurately. For one, the typical person registers to vote much less often than they turn out to vote. For people who vote rarely or never, their registration is largely an abstraction – an administrative status maintained by their state’s election authority without input from the individual. If someone registered to vote nine years ago but hasn’t voted in five, are they still registered to vote? Without a call to the local election office, it would be hard for them to know.
In addition, there are a number of different ways states handle their voter registration databases. For example, states periodically clean voter registration data, either because someone is believed to have moved or they have not voted over a period of time. So if a voter stays at the same address for many years and is able to maintain their registration, either through periodic voting or because their state allows registrants to remain on the file without voting or confirming their continued residence, their most recent act of registration is long in their past. This adds a source of error for voters answering questions about their registration in that they may simply not know with certainty if they are registered.
The abstraction of voter registration in a survey respondent’s mind, however, does not mean that his or her voter registration cannot be validated. If a state voter file contains a record of the respondent at their current address, then the respondent is definitely registered to vote. After all, the state voter file is the authoritative source of data used on Election Day to check in voters.
Ambiguities occur when a voter claims to be registered but no record matching their current address can be found on the voter file. The lack of a matching record is not proof that the person is not registered. In some localities, voters who have moved can vote as long as they haven’t changed voting districts. Others may choose to vote in their old precinct, using the registration attached to their previous address. College students are able to vote in some states where they attend school, but that may not reflect their permanent address.
Another possibility for why voters who report being registered do not have a corresponding record is that the respondent was not able to be matched to the commercial voter file at all. This could be due either to errors on the voter file or in the personally identifying data provided by the respondent, preventing an otherwise valid registration from being found. In light of these possibilities, care should be taken when assessing the registration status of seemingly unregistered respondents.
Survey error in reported registration
The problematic nature of measuring voter registration is evident in the mismatch between the voter file data and responses from the American Trends Panel participants. Panelists are asked periodically about their registration status using the three-category question described earlier in the report. Survey responses about registration were compared with registration status from the voter files. For the purpose of this analysis, due to the complicated nature of voter registration as discussed above, survey respondents with possibly incorrect matches were flagged as unregistered, unless a valid registration record was located on at least one other file.
A registration record was located on at least one matched voter file for 89% of panelists who expressed certainty that they are registered. Half (50%) of those who were uncertain about their status (and who are considered unregistered in our normal survey protocol) had a registration record on at least one file. Even 34% of those who said that they are not registered had a registration record on at least one of the files. Because some official registration records themselves may be out of date, the survey measure may not be as problematic as it appears here. For example, someone who has moved may have a valid registration record at a previous address – perhaps the source of the voter file match – but be unsure as to whether they are registered at their current address. But it is clear that registration status is a murkier concept to capture in a survey.
Modeled partisanship is correct for a majority of cases
There are traditionally two types of partisanship classifications available in voter files. The first is party registration. However, since this is not available in all states, voter file vendors attempt to model partisanship based on demographics, voter turnout and other factors. While each of these models is different, four vendors provided a modeled score that ranges from 0 to 100, where 0 is most Republican and 100 is most Democratic. One vendor, however, simply categorized panelists by party.
In all, files that provided a modeled 0 to 100 score did a better job of correctly classifying the partisan affiliation of panelists against their self-reported partisanship. In particular, Files 1 and 2 performed relatively well at correctly classifying voters (76% and 73% correctly classified respectively). File 4 had the lowest share of panelists correctly classified (59%), due in part to a higher than average share classified as independent in this model. Two-in-ten American Trends Panel members (20%) matched to File 4 are classified as politically independent, compared with just 3% who self-identify as not leaning towards either party.
In general, all of the files were able to identify Democrats at a higher rate than Republicans. But three vendors stood out in this regard. File 1 correctly identified 85% of Democrats and 70% of Republicans, while File 2 correctly identified 81% of Democrats and 69% of Republicans. And while File 4 had lower rates of accurate identification overall, it, too, was better able to identify Democrats (68% correctly identified) than Republicans (55% correct). The fact that a large majority of blacks identify as or lean Democratic contributes to the higher accuracy rate for Democrats than Republicans.
Modeled turnout scores improve the accuracy of election estimates
Predicted voter turnout is one of the most commonly available and widely used modeled measures. Vendors attempt to model each person’s likelihood of voting in a given election – be it primary, midterm or presidential. Pollsters use this information in building likely voter models, and campaigns use it to allocate resources for mobilization or persuasion. While turnout models are based on voter turnout in previous elections, some also include demographic information and partisanship in the model in an attempt to more accurately predict likely voting behavior.
Modeled turnout scores are typically treated as probabilities and are offered on a 0 to 100 scale, with 0 being the least likely to turn out to vote in a given election and 100 being the most likely to vote. (File 3 did not provide a turnout probability.) Each vendor has its own “secret sauce” that goes into their model. As a result, while all of the models follow a similar 0 to 100 scale, each scale has a different mean and distribution.
To assess the accuracy of the turnout predictions for the 2016 general election, panelists matched by each vendor were sorted by their predicted likelihood of voting into four groups of equal size, referred to here as quartiles. Within each quartile, the average turnout score – the mean of the predicted probabilities for that group – can be compared with the percentage of the group that actually voted. If the predictions are perfectly accurate, the mean of the predicted probabilities and the percentage who voted will be about the same.
The vendors varied somewhat in the accuracy of their turnout predictions. For three of the four, predictions about turnout among the quarter of the sample rated least likely to vote tended to underestimate the true turnout rate. For example, the average predicted probability of turning out for the lowest quartile in File 4 was just 27%, but among this group 68% actually voted. Two other files (File 2 and File 5) also underestimated actual turnout in the lowest quartile. By contrast, the average predicted turnout for the lowest quartile in File 1 was 51%, and the actual turnout was nearly the same, at 47%.11
Most of the vendors did better with their predictions among voters judged as highly likely to vote, though one of them (File 4) substantially overestimated the share in the highest quartile who would vote.
Since these scores can be used to predict who will turn out to vote, they can also be judged by how well they modeled the outcome of the election among those who did vote. Using a technique similar to that employed by pollsters to create a “likely electorate” among respondents to a pre-election survey, panelists who responded to a post-election survey were weighted by their pre-election likelihood of turning out to vote in 2016 (along with the usual survey weighting on demographic and related characteristics). While self-reported voters in the panel as a group gave Clinton a 7-point advantage (50% for Clinton vs. 43% for Trump), weighting the results by the expected turnout scores from each file produced a result closer to the actual election outcome, which was a 2-point Clinton advantage in the national vote. All the files came close to the actual vote, showing either a 3- or a 4-point Clinton advantage.
Demographic data
As use of commercial voter lists by campaigns and public opinion researchers has grown, data offerings provided by voter file vendors have expanded. On top of standard political offerings, many vendors now provide a host of additional demographic and lifestyle data generated through predictive models or gathered from other sources. This chapter compares demographic data in the voter files with self-reports from panelists.
Predictive models leverage data from a mix of third-party commercial vendors and survey data to try to predict a number of characteristics, ranging from a person’s race to educational attainment. However, for some modeled variables, much of the underlying information is available only in a portion of states. For example, vendors rely on a mix of information from voter records and additional data to predict an individual’s race or ethnicity. In 16 states or portions of states, largely in the South, the Voting Rights Act of 1965 mandated that states list voters’ race on the state voter rolls. However, in states where this information is not available, vendors attempt to use information from other sources such as identifying common surnames or if someone lives in an area that is densely populated by a particular race.
In addition to state voter records and commercial data, some voter file vendors use survey data to enhance and build their models. Partisan vendors, in particular, often feed survey data from partner organizations into the models to improve their accuracy.
Race and ethnicity are generally well measured in the files
Given the central importance of race and ethnicity in American politics, voter file vendors attempt to identify the race of the individuals in the file. Vendors may use race as recorded on state voter records in places where the states are required to collect it. In other locations, race may be modeled using information like surname or geographic concentration. The modeled race and ethnicity of panelists was compared with how panelists described it when they were recruited to the panel (or in subsequent profile surveys). Overall, most vendors are able to accurately identify the race of white respondents, with rates of correct identification varying between 81% for File 3 to 97% for File 2. However, when it comes to accurately identifying the race of self-reported black and Hispanic panelists, some vendors are more accurate than others.
Among panelists who self-report being black in a survey measure, roughly three-quarters in Files 2 and 5 (74% in File 5 and 76% in File 2) are correctly classified as black by the respective models. However, the model in File 1 identifies far fewer black panelists accurately (56%).
In classifying self-reported Hispanic panelists, there is less of a difference across the files, ranging from a low of 64% of Hispanics correctly classified in File 3 to 75% in Files 1 and 5.
Overall, the rate of correct classification by race ranges from 74% for File 3 to 85% for File 2.
Other demographic variables vary greatly in accuracy
In addition to information provided by state voter rolls, many voter file vendors include information from other public and commercial data sources. This data could originate from a variety of sources, such as from magazine subscriptions or credit bureaus, with the goal of providing additional information about Americans beyond what is available directly from state voter lists.
The presence of commercial data in voter files is widespread; however, the specific variables available differ by vendor. Many vendors possess financial data from credit bureaus or credit card companies, including things like home price and mortgage amount. In addition, some vendors provide information like occupation, income and the number of adults or children in a household. The presence of hunting or fishing licenses is one of the most ubiquitous commercial variables.
This commercial data also presents itself in several ways. Some of these variables stand alone as flags, such as the presence of a hunting license, while others are included in models to predict particular outcomes or demographics. For example, several vendors provide models for personal interests like being a gun owner or a boating enthusiast – information that is modeled based on sources such as magazine subscriptions.
An analysis of three of the more commonly available commercial variables – education, income and religious affiliation – shows that some models are more accurate than others. Overall, most vendors had a higher rate of accuracy in predicting education than income. When it comes to religious affiliation, vendors for the most part correctly predict large religions in the U.S. such as Protestantism but have less success with lower incidence religions like Buddhism.
One common issue across many of the models is the preponderance of missing data, with large portions of matches listed as unclassified on some variables. For example, in assessing models produced to predict educational attainment, more than half (57%) of matches in File 4 and one-quarter (25%) of matches to File 5 are listed as unclassified. However, when those missing an estimate for education are excluded, many of the models have a reasonably high rate of correctly classifying panelists with their self-reported education status. Fully six-in-ten or more college graduates are correctly classified as having graduated in college in Files 1, 4 and 5.12
Household income may be the most difficult of the demographic variables to assess. The accuracy of survey measurements of income can be affected by many factors, including a respondent’s lack of knowledge (respondents are typically asked to recall total household income from a previous year). Additionally, income is a sensitive topic, and survey respondents are more likely to decline to provide their income than with other demographic variables. It is perhaps unsurprising that modeled income in the files – even where provided – does not match survey reports of income very closely. Overall, the four files that provided an estimated income corrected placed only 30% to 46% respondents into one of four categories. The files had trouble classifying both high- and low-income respondents. Four-in-ten or more who self-report having an income of $100,000 or more are correctly classified by File 4 (41% correctly classified) and File 5 (45%). And roughly one-third of the self-reported lowest-income adults (under $30,000 annually) are correctly classified by each of the four files that reported income.
Models used to predict religious affiliation vary considerably in the rates of correctly classified panelists. To be sure, all models do best at accurately predicting Protestants, the largest religious group in the United States. In Files 1, 4 and 5, about three-quarters (72%, 77% and 75% respectively) of self-identified Protestants are correctly classified. File 2 correctly classifies roughly six-in-ten (62%) of Protestants. (As a baseline, slightly less than half of Americans currently identify as Protestant.) Within the smaller religious groups in the U.S., some are more likely to be correctly modeled than others. For example, most of the files do a better job of correctly classifying Hindus than of classifying Buddhists, even though both groups are roughly equally rare in the U.S.
The files do not attempt to categorize people who are unaffiliated with a religion, but their residual category of “unclassified” provides evidence that some individuals are not religiously identified. Overall, the unclassified group varies from 5% to 21% across the files. But these unclassified individuals are not necessarily the religiously unaffiliated – just 28% of those who are unclassified in File 1 are people who identify in the panel as atheist, agnostic or “nothing in particular,” and this rises to 36% among those File 2. Given that nearly one-quarter of adults are religiously unaffiliated, the residual category of “uncategorized” does not do a particularly good job of finding them.
The total percent who are correctly classified, including those who are missing or unclassified for a given variable, provides a comparison among various modeled demographics. Many of the files were able to correctly classify a high share of panelists to their self-reported religion. Still, several files stood out, particularly the file with the lowest match rate (File 5), for being able to correctly classify sizeable shares of respondents’ education and income. Voter files in action
Commercial voter files have been used in a wide variety of ways, either by themselves or in conjunction with other data. Although such files have been employed by political campaigns for many years, their use by journalists and others interested in elections has increased recently as familiarity with the files has grown and the ancillary data available on the files has expanded.
Perhaps the most widespread use of the voter files is to help political practitioners more effectively and efficiently engage with potential voters. Political campaigns make use of the files to identify potential supporters and to communicate with them, either to influence their candidate choice, mobilize them to turn out to vote, or both. Groups organized around specific issues such as gun rights or access to abortion use the files in similar ways.
Pollsters increasingly use voter files to draw samples for their surveys. Voter files have long been used for sampling by pollsters working for political campaigns, but their use is growing among public and media pollsters as well, as evidenced in the November 2017 statewide elections in Virginia, where a majority of publicly released polls relied on voter file samples. Sampling from voter files is a more efficient way of reaching likely voters than other sampling methods such as random-digit dialing (RDD), though the fact that phone numbers are not available for everyone on the voter file can introduce errors. And information about past voting available on the files is useful in helping pollsters make more accurate predictions about who is likely to turn out in an upcoming election. Although the files have not been widely used as sampling sources for general public surveys, it is possible that they could be in the future if coverage of the unregistered population improves.
A third use of voter files is by journalists, academics and other election analysts who employ the files to answer specific questions about voters and elections. These include the demographic composition of the electorate, what kinds of voters tend to vote early or by absentee ballot, who votes in primary elections and what kinds of people are habitual vs. episodic voters. This chapter takes a closer look at several of these applications of voter files for improving our understanding of political attitudes and behaviors.
Voter files as sampling frames for surveys and experiments
Political campaigns have long used voter files as sampling frames for their election-related polling, but public pollsters have recently begun to adopt them as well. Of the nine pollsters that released surveys conducted in the final nine days before the 2017 Virginia gubernatorial election and made their sample source public, seven used a voter file and only two used RDD.
Voter files were also the predominant source of telephone samples for state-level public polling in the 2016 presidential election. The Ad Hoc Committee on 2016 Election Polling, created by the American Association for Public Opinion Research (AAPOR), compiled a database of 206 statewide pre-election polls completed within the last 13 days before the election. The source of the sample (whether RDD, voter file or internet) was coded. Of 206 state polls in the database, 62% were based on telephone interviews or a hybrid of telephone and online. Of these phone polls, 80% used a voter file as a sample source.
Voter files are attractive as sources of samples because they provide good coverage of the population of interest (registered voters in the case of election polling) while largely excluding individuals who are not eligible to vote. Since most campaign polling occurs within defined geographies such as a state or a legislative district, voter files make targeting the voters of interest much more efficient than is the case with RDD, especially now that cellphones constitute large shares of the typical RDD sample and cellphone area codes and exchanges are not reliable indicators of where a person actually resides.
Another important benefit of using voter files for sampling is that they contain information about past voting behavior as well as partisan registration or estimates of party affiliation. This information permits a pollster to better target likely voters by including more individuals in the sample who have a proven history of voting in elections similar those of interest to a pollster. Similarly, the inclusion of measures of modeled party identification helps pollsters to draw samples that reflect the population of interest, whether it is all registered voters or those who have a high propensity for voting.
One of the downsides of using voter files for telephone polls is that telephone numbers are not available for everyone on the voter file. Among members of the American Trends Panel matched to the commercial voter files in this study, the percentage of matched cases for which a phone number is available from the vendor varied between 55% and 91%. Older adults are more likely than others to have a phone number on a given file, though the availability of numbers did not vary as much across other demographic variables.
Political scientists and political practitioners alike have made extensive use of voter files for selecting and assigning research subjects in experiments. One recent academic publication describes an ambitious field experiment by David E. Broockman and Daniel M. Butler that enlisted state legislators to help test the impact of different messages in official communications with constituents. Legislators who agreed to cooperate with the study allowed the researchers to vary the issue-related content of mailings to voters in their districts, who were selected from a commercial voter file and randomly assigned to different experimental conditions. Using surveys conducted before and after sending the mailings, the researchers found that “legislators can shape constituents’ views on issues by merely staking out their positions. The constituents who received letters containing legislators’ positions were significantly more likely to subsequently share their legislators’ view.”
Describing the electorate
On June 9, 2016, The New York Times published an analysis by Nate Cohn that argued that “millions more white, older working class voters went to the polls in 2012 than was found by exit polls on Election Day.” This finding led Cohn to a somewhat surprising conclusion about Donald Trump’s electoral prospects, given Hillary Clinton’s consistent lead in national polls at the time: “There’s more room for him to make gains among white working-class voters than many assumed — enough to win without making gains among nonwhite or college-educated white voters.” In fact, Cohn’s analysis described how Trump was able to find a narrow path to victory on the support of non-college white voters in key states.
The New York Times analysis was based on a combination of data from surveys conducted by the U.S. Census and from Catalist, a commercial national voter file. The key datum of interest was the share of voters who were older non-college whites: “Over all, the exit polls suggest that 23 percent of voters in 2012 were white, over age 45 and without a college degree. Catalist puts this group at 29 percent, and the census at 30 percent — implying 10 million more voters than the 23 percent figure.”
According to Cohn, if there were this many additional older, non-college white voters, President Obama must have done better with this group than is generally assumed, especially outside the South. The implication is that these voters were potentially available to Trump, who was making explicit appeals to them. Post-election analysis of polling data by The New York Times suggests that Trump was able to capture enough white 2012 Obama voters to win in the critical states of Wisconsin, Michigan and Pennsylvania.
Identifying the political affiliation of … just about anyone
Commercial voter files can be used to describe political engagement and affiliation among almost any group of individuals, as long as their names and locations are publicly available. Political scientist Eitan Hersh and his colleagues have used voter files to describe the political characteristics of professionals such as physicians, members of the clergy and even married couples. For the clergy study, Hersh and his colleague Gabrielle Malina compiled a database of 186,000 Christian and Jewish clergy from websites of congregations across the U.S., of whom 130,000 could be matched to a commercial voter file. With this linkage, they were able to characterize the partisan composition and voter turnout patterns of clergy in different denominations. With ancillary information on the voter files, they could further describe patterns of political affiliation and engagement among clergy by demographic characteristics. Reform Judaism rabbis were the most Democratic, while pastors in Wisconsin Lutheran congregations were the most Republican.
Hersh’s study of married couples (conducted with Yair Ghitza of Catalist, a voter file vendor) found that about one-in-ten households with a married couple included one Democratic and one Republican spouse. Many other households had a Republican or a Democrat married to an independent, and 15% featured two independents. Overall, about 55% had partisans (Democratic or Republican) who were married to someone of the same party. Among other insights in the study was the fact that voter turnout tended to be higher among partisans who were married to someone of the same party than partisans married to an independent or someone of the opposite party. These kinds of applications come with the standard caveats that apply to all voter file work – matching people to the files is an inexact science, the data on the files are not perfect – but they do provide a perspective on certain populations that would be expensive or perhaps impossible to obtain through conventional surveys.
Using voter files to identify ‘consistent voters,’ ‘drop-off voters’ and ‘nonvoters’
Voter turnout in the U.S. varies considerably by the type of election. It is highest in presidential election years and drops off considerably in off-years. Not only does overall turnout vary but the kinds of people who vote only in presidential elections are different from those who vote in both the presidential and the off-year elections. And, of course, some people rarely or never vote at all. Pew Research Center explored the differences between these three kinds of voters: “consistent voters” – those who vote in both presidential and off-year elections, “drop-off voters” – those who vote in presidential but not off-year elections and “nonvoters” – those who rarely or never vote. The Center could have classified voters based on self-reported turnout in previous elections, but considerable research has shown that people tend to overreport their past voting. Accordingly, survey respondents from a sizable survey conducted using GfK’s KnowledgePanel (a probability-based panel of U.S. adults who have agreed to take periodic surveys) were matched with turnout records in the national voter file compiled by TargetSmart, a commercial voter file vendor. Nearly nine-in-ten respondents (88%) were matched to a record in the TargetSmart database. Voters were classified based on whether they voted in 2012, 2014 and 2016 (consistent voters), 2012 and 2016 but not 2014 (drop-off voters) or none of the three elections (nonvoters). These three kinds of voters were compared on a wide range of demographic and political characteristics, including attitudes about citizenship, politics and the role of government.
Matching a telephone survey to a voter file
The core analysis in this report is based on linking members of the American Trends Panel with their corresponding voter registration and turnout data found in commercial voter files. This linkage is easier and more reliable for survey panels, which typically have names, addresses and other information that is useful for matching. But other kinds of surveys – such as RDD telephone surveys – may also be matched to commercial voter files, even if it is not feasible to gather all of the necessary personal information for precise matching. Matching by phone is possible because most records in the commercial voter files have telephone numbers associated with them. For example, File 2 reported to us that it has phone numbers for 72% of registered adults and 55% of unregistered adults. But how well does matching by phone number alone work in practice?
To test the feasibility of linking an RDD sample to a voter file, researchers matched records from an August 2016 dual-frame RDD telephone survey to a commercial voter file vendor. Portions of the matched data (which included voter file records associated with telephone numbers from both survey respondents and nonrespondents) were employed in an analysis of possible nonresponse bias in Pew Research Center’s 2017 study of survey nonresponse. Of 40,182 phone numbers dialed, 16,466 (41%) were matched to one or more voter records. Among the 2,802 completed interviews, 1,513 (54%) were matched to at least one voter record. Many numbers were matched to more than one voter record. Especially in the landline sample, it was evident that two or more members of the same household were associated with the same number; many of these shared the same last name and the same address. Similarly, some individuals had two or three voter records (usually from different states or locations within a state).
Center researchers attempted to select the voter record that best corresponded with the actual survey respondent and was the most up-to-date. Respondents who matched the voter record with respect to sex and age (within plus or minus two years) were retained for further examination, along with those for whom age was not available from either the survey or the voter file. The respondents’ first names (collected at the end of the survey for many of the respondents) and ZIP code were used to further narrow the matched cases.
In all, 948 respondents in the poll (34% unweighted, 30% weighted) were matched to a voter record that corresponded with the survey record on sex, age, race (white vs. nonwhite) and location. The unweighted match rate was 67% among landline numbers and 23% among cellphone numbers. This match rate yields a sizable number of survey respondents with official voting records and modeled data on partisanship, political engagement and other variables. Still, the kinds of respondents who could be matched differed somewhat from those for whom a reliable match could not be made. The pattern of differences is very similar to that seen in the analysis of matching using the American Trends Panel, though the magnitude of the differences is greater. As we would expect, respondents who say they are not registered to vote were far less likely than others to be matched, though some were. And younger, less educated, less affluent, minority and politically unengaged individuals (based on survey responses) were considerably less likely to be matched.
Consequently, the trade-offs described earlier in this report are very evident here. The composition of the matched group is different from the unmatched group. Demographically, the matched respondents are older (29% ages 65 and older compared with just 12% among the unmatched), better educated, more likely to be non-Hispanic white and to own their home. Politically, the matched group is much more engaged and much more likely to be Republican than the unmatched group.
The utility of a process that matches about one-third of a telephone survey sample may be limited for researchers who are working with small sample sizes. But if the survey had attempted to collect name and address for the respondents, it’s possible that additional matches could have been located.
Commercial voter files in perspective
Despite the potential value of commercial voter files, they are hardly perfect. The imperfections stem from a variety of sources. At their core, the files are a compilation of official records from each state and the District of Columbia, with the addition of information about both registered and unregistered adults from other sources. But the administration of elections in the U.S. is remarkably decentralized, and the means by which official records are maintained and updated varies, although less so now than in the past. Moreover, the rules and norms governing access to voter records vary considerably from place to place.
Beyond the record of a voter’s registration and turnout, the quality of additional information such as demographic characteristics or a phone number is not uniform and is sometimes unavailable.
One important source of error in voter files is that Americans remain a fairly mobile population and there is no official system to notify elections officials that a voter has moved. (The National Change of Address dataset is maintained by the U.S. Postal Service but is not automatically integrated with election systems in the states.) The companies that compile and market voter data attempt to link voting records of individuals when they move, but the process is complex and far from foolproof. The kinds of people who are most likely to be missed in the voter files when they move do not constitute a random subset of the population, but instead are more likely to be younger, less educated, poorer and nonwhite. Similarly, very mobile Americans are more likely to appear on files in more than one location.
A related source of bias is the fact that voter files systematically miss those who are not registered to vote. Most of the commercial vendors of voting data attempt to include all Americans – registered and unregistered – because many users of voter files are interested in reaching and mobilizing all voting-eligible citizens. But since the files are built initially on official registration records, many of the unregistered fall through the cracks. The unregistered in the U.S. are less likely to have clear digital footprints, due in part to their greater mobility.
Efforts have been made to deal with errors in voter registration records resulting from mobility and other factors. For example, the Electronic Registration Information Center, also known as ERIC, is a nonprofit organization funded by 20 participating state governments to actively align official voter files across state lines to reduce these kinds of errors and to increase access to voter registration for all eligible citizens. (Disclosure: ERIC was formed in 2012 with assistance from The Pew Charitable Trusts, the parent organization of Pew Research Center.)
Some political scientists have also argued that the use of commercial voter files raises important normative questions. Those who believe that the political process benefits from higher levels of citizen participation may see voter files as providing a means for facilitating participation in the political process. While it can be demonstrated that voter files can be instrumental in promoting greater turnout among targeted groups and individuals, it is difficult to know whether their use results in an overall increase in political engagement. Similarly, while greater aggregate participation may be a desirable goal for a democracy, there is evidence in the political science literature that voter files increase inequality in participation because they are used primarily to further mobilize people who are already engaged. If efficiency in the use of campaign resources is a principal goal of practitioners (rather than engaging new or irregular voters), voter files could produce greater inequality in participation by making it easier for campaigns to avoid “wasting” effort on younger or poorer voters who may have a low propensity to participate in the first place.
Beyond the impact that voter files may have on the democratic process, the widespread availability of such detailed information about individuals raises concerns about personal privacy. Pew Research Center studies have found that Americans hold strong views about privacy in everyday life. They worry about the amount of their personal information that is being collected but at the same time are open to providing information in exchange for certain kinds of benefits. Nevertheless, they have little confidence that personal data about them held by businesses and government is secure (see the Methodology section of this report for details about how the Center handled survey respondents’ personal information).
The core data in voter files are the publicly available voting records of individuals. Members of the public may be unaware that voting records are public, but campaigns have long had access to them. What has changed is that they are much more accessible in the digital age due to changes in both government policies and the routine practices of the agencies that administer elections. It is simply more efficient for governments to digitize the records necessary for the orderly administration of registration and voting.
Another change is that it is now much easier to merge voter records with other kinds of digital data, such as that collected by marketing and credit data companies. And it is possible to merge the voter file data, including the financial and marketing data, with data from social media platforms. Together, this information can provide a relatively comprehensive portrait of many individual citizens for use by campaigns and interest groups. Of course, this is just the political equivalent of what marketers are doing to identify and target consumers for specific products and services. But it brings the political process into the ongoing debate about personal privacy, where people often have strong negative reactions to finding themselves the focus of tailored ad campaigns and the like.
 |
| Rubén Weinsteiner |
אין תגובות:
הוסף רשומת תגובה