
By Solomon Messing

Early morning voters wait to cast their ballots on Election Day
Americans have long been familiar with “horse race” polls that accompany elections in the United States. But since 2008, a new polling tool has gained prominence, one that not only suggests which candidate is ahead at any given moment but also estimates their probability of winning the eventual election.
These probabilistic forecasts can give potential voters the impression that one candidate will win more decisively and may even lower the likelihood that they vote, according to a new study by Sean Westwood of Dartmouth, Yphtach Lelkes of the University of Pennsylvania and Solomon Messing of Pew Research Center.
The use of such probabilistic forecasts was a constant in coverage of the 2016 presidential race, with an average of 16 mentions per day in cable news broadcasts, according to the study. And at least in 2016, outlets with more liberal audiences featured more coverage. Forecasters uniformly favored Hillary Clinton to capture the White House, with odds ranging from 70% to 99%.
The new study finds that numbers like these can leave people with the impression that the race is far less competitive than when they see polling data presented as the percentage of the vote they are expected to get – something familiar to the public.
But probability can be difficult to understand, and small differences in horse race projections of vote share correspond to large differences in the probability of a candidate winning. Probabilities are especially hard to grasp for a single event like an election, as New York Times columnist David Leonhardt recently pointed out. “People understand that if they roll a die 100 times, they will get some 1’s. But when they see a probability for one event, they tend to think: Is this going to happen or not?”
These probabilistic forecasts rose to prominence after at least one of them successfully predicted nearly every state’s Senate race and presidential result in 2008. The number of articles returned by Google News that mention probabilistic forecasting rose from 907 in 2008, to 3,860 in 2012, to 15,500 in 2016 (data as of Jan. 30, 2017; exact numbers fluctuate).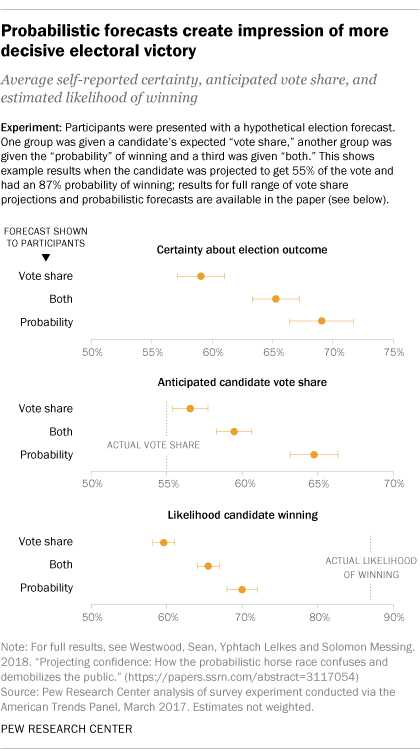
To investigate how people interpret probabilistic forecasts, 4,151 participants were presented with a hypothetical U.S. Senate race, where “Candidate A supports the majority of the policies you support and is well qualified for the job” and “Candidate B does not share your views and is less qualified than Candidate A.”
Participants then saw a hypothetical election projection based on the same underlying numbers, but presented either in the form of:
the vote share, for example, “Candidate A is expected to win 55% of the vote, ±2” (i.e., margin of error of plus or minus 2 points);
the equivalent probability that Candidate A would win, for example, “Candidate A has an 87% chance of victory”;
or both, “Candidate A is expected to win 55% of the vote, ±2, and has an 87% chance of victory.” Usually probabilistic forecasters present both kinds of projections, but probabilities have generally been more prominent.
Next, they were asked to judge the share of the vote they expected Candidate A to receive, how likely they thought Candidate A was to win, and how certain they were Candidate A would win or lose.
Those exposed to probability forecasts were more confident in their assessments of which candidate was ahead and who would ultimately win, compared with those shown only a projection of the candidate’s vote share. In every condition across the board, participants provided inaccurate accounts of the likelihood of winning.
The findings suggest that media coverage featuring probabilistic forecasting gives rise to much stronger expectations that the leading candidate will win, compared with more familiar coverage of candidates’ vote share.
How people interpret statistics might seem inconsequential – unless these interpretations affect behavior. And there is evidence that they do: Other research shows that when people aren’t sure who will win an election, they vote at higher rates, though not all studies find the same effect. That could mean that if citizens feel assured that the election will almost certainly break one way after reading probabilistic forecasts, some may see little point in voting.
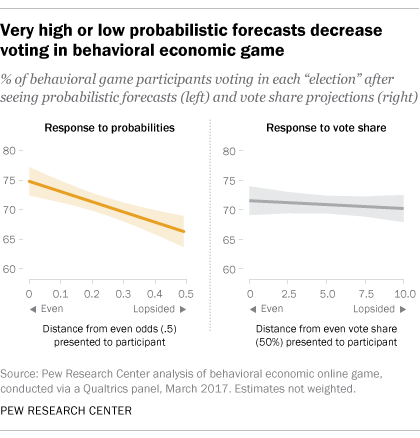 To test whether these forecasts might keep people away from the polls, researchers ran a second experiment with 1,171 respondents drawn from a national online nonprobability survey panel, recruited by Qualtrics. Rather than relying on self-reported vote intent, the experiment consisted of several rounds of an economic game designed to mimic the incentives faced by potential real-world voters. Respondents could decide whether or not to pay a small fee to “vote” for their team, simulating the real-world costs that real voters face, such as the time it takes to vote. If their team won each “election,” they would win money, or lose money if their team lost.
Before each round, respondents saw probabilistic forecasts and vote share projections for their team. Sometimes these numbers were closer to 50-50, sometimes they depicted large margins or high odds. The exact numbers were selected based on random assignment, though both vote share and probability for a team had to be either below or above 50% – for example, a team might be assigned a projected 56% of the vote and a 63% chance of winning.
Results showed that probabilistic forecasts with higher odds of one candidate winning resulted in people not expending resources necessary to cast a vote in the game. In contrast, the size of vote share projections had no detectable effect on voting in the game.
To be sure, an online game can only simulate the calculations potential voters make before Election Day, and neither study measures real voting in an actual election. However, the pattern suggests that being told a candidate’s chance of winning or losing can have a much bigger effect on their propensity to vote than being told how far ahead or behind they are in percentage terms.
The increased use of probabilistic forecasts in the media means they may have additional, downstream effects. Other studies have shown that election coverage has secondary effects on donations and mobilization, while candidates’ perceptions of the closeness of an election can give campaigns an incentive to invest more in campaigning and try harder to understand and enact their constituents’ preferences.
All in all, these findings are not a criticism of the underlying data, the statistical processes or the ultimate accuracy of probabilistic forecasts. Instead, they speak to how people interpret these forecasts and behave based on those interpretations. Moreover, it is worth noting that the study does not show that probabilistic forecasts lead voters to overestimate the probability of a candidate’s chance of winning.
But probabilistic forecasts do give voters a stronger impression of the certainty of the outcome than does the presentation of vote margins, which potentially has a significant effect on participation. And as the paper shows, the effect may disproportionately affect one side: It is strongest for the candidate who appears to be ahead in the polls.
Note: Read the new study on probabilistic forecasts by Sean Westwood of Dartmouth, Yphtach Lelkes of the University of Pennsylvania and Solomon Messing of Pew Research Center.
Early morning voters wait to cast their ballots on Election Day
Americans have long been familiar with “horse race” polls that accompany elections in the United States. But since 2008, a new polling tool has gained prominence, one that not only suggests which candidate is ahead at any given moment but also estimates their probability of winning the eventual election.
These probabilistic forecasts can give potential voters the impression that one candidate will win more decisively and may even lower the likelihood that they vote, according to a new study by Sean Westwood of Dartmouth, Yphtach Lelkes of the University of Pennsylvania and Solomon Messing of Pew Research Center.
The use of such probabilistic forecasts was a constant in coverage of the 2016 presidential race, with an average of 16 mentions per day in cable news broadcasts, according to the study. And at least in 2016, outlets with more liberal audiences featured more coverage. Forecasters uniformly favored Hillary Clinton to capture the White House, with odds ranging from 70% to 99%.
The new study finds that numbers like these can leave people with the impression that the race is far less competitive than when they see polling data presented as the percentage of the vote they are expected to get – something familiar to the public.
But probability can be difficult to understand, and small differences in horse race projections of vote share correspond to large differences in the probability of a candidate winning. Probabilities are especially hard to grasp for a single event like an election, as New York Times columnist David Leonhardt recently pointed out. “People understand that if they roll a die 100 times, they will get some 1’s. But when they see a probability for one event, they tend to think: Is this going to happen or not?”
These probabilistic forecasts rose to prominence after at least one of them successfully predicted nearly every state’s Senate race and presidential result in 2008. The number of articles returned by Google News that mention probabilistic forecasting rose from 907 in 2008, to 3,860 in 2012, to 15,500 in 2016 (data as of Jan. 30, 2017; exact numbers fluctuate).
To investigate how people interpret probabilistic forecasts, 4,151 participants were presented with a hypothetical U.S. Senate race, where “Candidate A supports the majority of the policies you support and is well qualified for the job” and “Candidate B does not share your views and is less qualified than Candidate A.”
Participants then saw a hypothetical election projection based on the same underlying numbers, but presented either in the form of:
the vote share, for example, “Candidate A is expected to win 55% of the vote, ±2” (i.e., margin of error of plus or minus 2 points);
the equivalent probability that Candidate A would win, for example, “Candidate A has an 87% chance of victory”;
or both, “Candidate A is expected to win 55% of the vote, ±2, and has an 87% chance of victory.” Usually probabilistic forecasters present both kinds of projections, but probabilities have generally been more prominent.
Next, they were asked to judge the share of the vote they expected Candidate A to receive, how likely they thought Candidate A was to win, and how certain they were Candidate A would win or lose.
Those exposed to probability forecasts were more confident in their assessments of which candidate was ahead and who would ultimately win, compared with those shown only a projection of the candidate’s vote share. In every condition across the board, participants provided inaccurate accounts of the likelihood of winning.
The findings suggest that media coverage featuring probabilistic forecasting gives rise to much stronger expectations that the leading candidate will win, compared with more familiar coverage of candidates’ vote share.
How people interpret statistics might seem inconsequential – unless these interpretations affect behavior. And there is evidence that they do: Other research shows that when people aren’t sure who will win an election, they vote at higher rates, though not all studies find the same effect. That could mean that if citizens feel assured that the election will almost certainly break one way after reading probabilistic forecasts, some may see little point in voting.
To test whether these forecasts might keep people away from the polls, researchers ran a second experiment with 1,171 respondents drawn from a national online nonprobability survey panel, recruited by Qualtrics. Rather than relying on self-reported vote intent, the experiment consisted of several rounds of an economic game designed to mimic the incentives faced by potential real-world voters. Respondents could decide whether or not to pay a small fee to “vote” for their team, simulating the real-world costs that real voters face, such as the time it takes to vote. If their team won each “election,” they would win money, or lose money if their team lost. Before each round, respondents saw probabilistic forecasts and vote share projections for their team. Sometimes these numbers were closer to 50-50, sometimes they depicted large margins or high odds. The exact numbers were selected based on random assignment, though both vote share and probability for a team had to be either below or above 50% – for example, a team might be assigned a projected 56% of the vote and a 63% chance of winning.
Results showed that probabilistic forecasts with higher odds of one candidate winning resulted in people not expending resources necessary to cast a vote in the game. In contrast, the size of vote share projections had no detectable effect on voting in the game.
To be sure, an online game can only simulate the calculations potential voters make before Election Day, and neither study measures real voting in an actual election. However, the pattern suggests that being told a candidate’s chance of winning or losing can have a much bigger effect on their propensity to vote than being told how far ahead or behind they are in percentage terms.
The increased use of probabilistic forecasts in the media means they may have additional, downstream effects. Other studies have shown that election coverage has secondary effects on donations and mobilization, while candidates’ perceptions of the closeness of an election can give campaigns an incentive to invest more in campaigning and try harder to understand and enact their constituents’ preferences.
All in all, these findings are not a criticism of the underlying data, the statistical processes or the ultimate accuracy of probabilistic forecasts. Instead, they speak to how people interpret these forecasts and behave based on those interpretations. Moreover, it is worth noting that the study does not show that probabilistic forecasts lead voters to overestimate the probability of a candidate’s chance of winning.
But probabilistic forecasts do give voters a stronger impression of the certainty of the outcome than does the presentation of vote margins, which potentially has a significant effect on participation. And as the paper shows, the effect may disproportionately affect one side: It is strongest for the candidate who appears to be ahead in the polls.
Note: Read the new study on probabilistic forecasts by Sean Westwood of Dartmouth, Yphtach Lelkes of the University of Pennsylvania and Solomon Messing of Pew Research Center.
אין תגובות:
הוסף רשומת תגובה